. 2024 Aug 23;3(8):e70003.
doi: 10.1002/jex2.70003. eCollection 2024 Aug.

Orthogonal analysis reveals inconsistencies in cargo loading of extracellular vesicles

Affiliations

Orthogonal analysis reveals inconsistencies in cargo loading of extracellular vesicles

Neona M Lowe et al. J Extracell Biol. .

Abstract

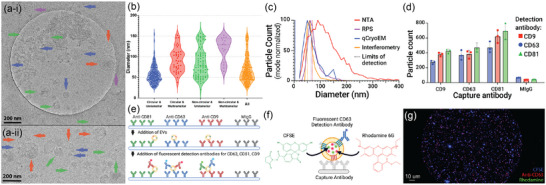
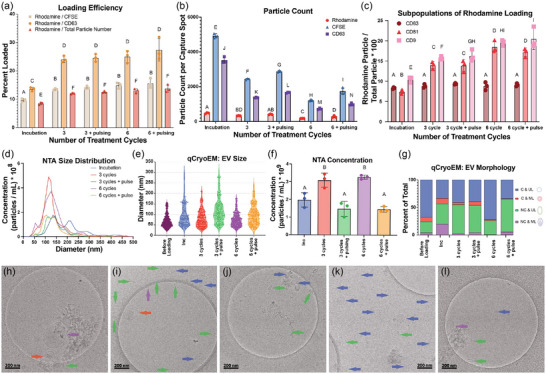
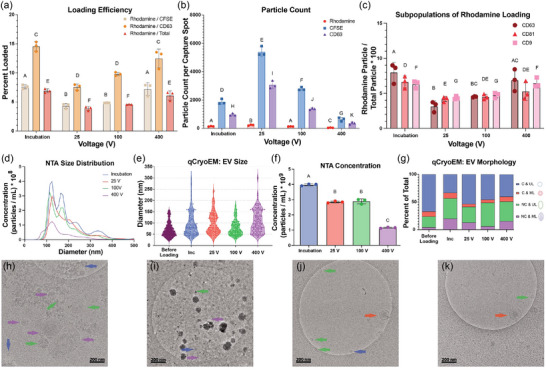
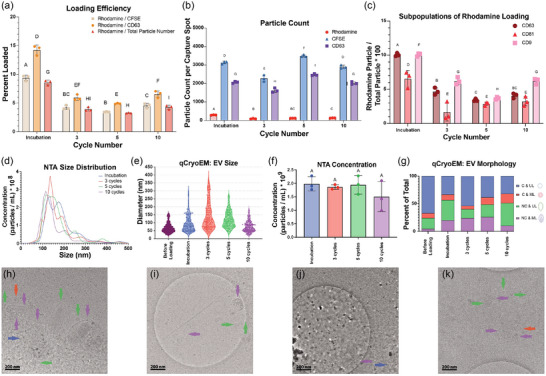
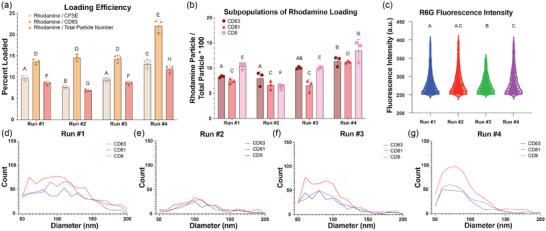
Since extracellular vesicles (EVs) have emerged as a promising drug delivery system, diverse methods have been used to load them with active pharmaceutical ingredients (API) in preclinical and clinical studies. However, there is yet to be an engineered EV formulation approved for human use, a barrier driven in part by the intrinsic heterogeneity of EVs. API loading is rarely assessed in the context of single vesicle measurements of physicochemical properties but is likely administered in a heterogeneous fashion to the detriment of a consistent product. Here, we applied a suite of single-particle resolution methods to determine the loading of rhodamine 6G (R6G) surrogate cargo mimicking hydrophilic small molecule drugs across four common API loading methods: sonication, electroporation, freeze-thaw cycling and passive incubation. Loading efficiencies and alterations in the physical properties of EVs were assessed, as well as co-localization with common EV-associated tetraspanins (i.e., CD63, CD81 and CD9) for insight into EV subpopulations. Sonication had the highest loading efficiency, yet significantly decreased particle yield, while electroporation led to the greatest number of loaded API particles, albeit at a lower efficiency. Moreover, results were often inconsistent between repeated runs within a given method, demonstrating the difficulty in developing a rigorous loading method that consistently loaded EVs across their heterogeneous subpopulations. This work highlights the significance of how chosen quantification metrics can impact apparent conclusions and the importance of single-particle characterization of EV loading.

Keywords: bioengineering; drug delivery; exosomes; therapeutics.


Conflict of interest statement

The authors declare no conflicts of interest.

Figures

FIGURE 1
FIGURE 1
Characterization HEK293T EVs prior to loading. (a) Representative qCryoEM images of isolated particles, with arrows indicating vesicles and (b) the corresponding quantification of size distribution categorized by EV morphology and lamellarity (n = 433). Blue, red, green and purple arrows indicate C&UL, C&ML, NC&UL and NC&ML EVs, respectively. (c) Orthogonal size distributions from NTA (red), RPS (purple), qCryoEM (blue) and hybrid interferometry/immunofluorescence imaging (orange), with corresponding limits of detection for each technique indicated by vertical dashed lines of the respective colour. (d) An immunofluorescence assay was used to assess the presence and colocalization of common EV tetraspanins CD9, CD63 and CD81, alongside non‐specific control MIgG. (e) Schematic showing workflow for the immunofluorescence assay. (f) Schematic showing labelling strategy for assessing loading with EV specific anti‐CD63, CFSE as a non‐specific EV label, and R6G as the surrogate loaded cargo. (g) Microarray fluorescence image showing a single spot decorated with captured EVs (blue channel: CFSE, red channel: CF647‐anti‐CD63, green channel: R6G). Figure 1e,f were created with BioRender. C, circular; ML, multilamellar; NC, non‐circular; UL, unilamellar.
FIGURE 2
FIGURE 2
Loading EVs with R6G via sonication using various cycle numbers with and without pulsing. One cycle consisted of 30 s of sonication with or without pulsing (4 s on/ 2 s off) and 3 min of rest at room temperature. R6G loading into EVs was characterized by using the immunofluorescence readout of tetraspanin capture assays and quantified as (a) loading efficiency, defined as ratio of R6G‐loaded EVs to total EV count (using either the number of detected CFSE particles, CD63+ particles or total particle number), (b) particle count and (c) subpopulations of R6G‐loaded EVs. (d) NTA and (e) qCryoEM were used size distribution of samples after loading. (f) NTA was used to determine concentration of samples after loading. (g) qCryoEM was used to determine morphology after loading. Representative CryoEM images with arrows pointing to EVs from (h) the incubation sample, and samples sonicated for (i) 3 cycles, (j) 3 cycles with pulse, (k) 6 cycles and (l) 6 cycles with pulse. Blue, red, green and purple arrows indicating C&UL, C&ML, NC&UL and NC&ML EVs, respectively. C, circular; Inc, incubation; ML, multilamellar; NC, non‐circular; UL, unilamellar. Bars with no common letters are significantly different (ANOVA, < 0.05).
FIGURE 3
FIGURE 3
Loading of EVs with R6G via electroporation. EVs were electroporated with a single pulse at various voltages and 125 µF. The loading of R6G into the EVs was characterized by using the immunofluorescent readout of tetraspanin immunocapture assays and quantified as (a) loading efficiency, (b) particle count, and (c) subpopulations of R6G‐loaded EVs. (a) Loading efficiency was defined as ratio of R6G‐loaded EVs count (number of detected R6G particles) to total EV count (number of detected CFSE particles, CD63 particles, or total particle number). (d) NTA and (e) qCryoEM were used size distribution of samples after loading. (f) NTA was used to determine concentration of samples after loading. (g) qCryoEM was used to determine morphology after loading. Representative CryoEM images with arrows pointing to EVs from (h) the incubation sample, and samples after electroporation at (i) 25 V, (j) 100 V and (k) 400 V. Blue, red, green and purple arrows indicating C&UL, C&ML, NC&UL and NC&ML EVs, respectively. C, circular; Inc, incubation; ML, multilamellar; NC, non‐circular; UL, unilamellar. Bars with no common letters are significantly different (ANOVA, < 0.05).
FIGURE 4
FIGURE 4
Loading of EVs with R6G via various number of freeze‐thaw cycles. Freeze‐thaw cycles consisted of 5 min at −80°C and 10 min at room temperature. The loading of R6G into the EVs was characterized by using the immunofluorescent readout of tetraspanin immunocapture assays and quantified as (a) loading efficiency, (b) particle count, and (c) subpopulations of R6G‐loaded EVs. (a) Loading efficiency was defined as ratio of R6G‐loaded EVs count (number of detected R6G particles) to total EV count (number of detected CFSE particles, CD63 particles, or total particle number). (d) NTA and (e) qCryoEM were used size distribution of samples after loading. (f) NTA was used to determine concentration of samples after loading. (g) qCryoEM was used to determine morphology after loading. Representative CryoEM images with arrows pointing to EVs from (h) the incubation sample, and samples after (i) 3 cycles, (j) 5 cycles and (k) 10 cycles of freeze‐thaw. Blue, red, green and purple arrows indicating C&UL, C&ML, NC&UL and NC&ML EVs, respectively. C, circular; ML, multilamellar; NC, non‐circular; UL, unilamellar.. Bars with no common letters are significantly different (ANOVA, < 0.05).
FIGURE 5
FIGURE 5
Comparison of incubation, sonication, electroporation, and freeze‐thaw to load EVs with R6G. The loading of R6G into the EVs was characterized by using the immunofluorescent readout of tetraspanin immunocapture assays and quantified as (a) loading efficiency, (b) particle count and (c) subpopulations of R6G‐loaded EVs. (a) Loading efficiency was defined as ratio of R6G‐loaded EVs count (number of detected R6G particles) to total EV count (number of detected CFSE particles, CD63 particles, or total particle number). RPS and NTA were used to determine (d) the size distribution and (e) concentration of samples. (f) The immunofluorescent readout of tetraspanin immunocapture assays was used to determine tetraspanin expression of unlabelled EVs incubated in PBS rather than R6G solution before and after loading methods. This was compared to the number of detected CD63 particles in the presence of R6G. Bars with no common letters are significantly different (ANOVA, < 0.05).
FIGURE 6
FIGURE 6
Comparison of incubation replicates to load EVs with R6G. Incubation samples were run alongside sonication samples (run #1), electroporation samples (run #2), freeze‐thaw samples (run #3) and during the method comparison (run #4). The loading of R6G into the EVs was characterized by using the immunofluorescent readout of tetraspanin immunocapture and quantified as (a) loading efficiency and subpopulations of R6G‐loaded EVs. (a) Loading efficiency was defined as ratio of R6G‐loaded EVs count (number of detected R6G particles) to total EV count (number of detected CFSE particles, CD63 particles, or total particle number). (d) Tetraspanin immunocapture was also used to determine the size distribution of R6G‐loaded EVs via interferometry. Bars with no common letters are significantly different (ANOVA, < 0.05).

References

    1. Alvarez‐Erviti, L. , Seow, Y. , Yin, H. , Betts, C. , Lakhal, S. , & Wood, M. J. (2011). Delivery of siRNA to the mouse brain by systemic injection of targeted exosomes. Nature Biotechnology, 29(4), 341–345. 10.1038/nbt.1807 - DOI - PubMed
    1. Artuyants, A. , Chang, V. , Reshef, G. , Blenkiron, C. , Chamley, L. W. , Leung, E. , & Hisey, C. L. (2021). Production of extracellular vesicles using a CELLine adherent bioreactor flask. In Turksen K. (ed.), Bioreactors in stem cell biology (Vol. 2436, pp. 183–192). Methods in Molecular Biology. Springer. 10.1007/7651_2021_413 - DOI - PubMed
    1. Bachurski, D. , Schuldner, M. , Nguyen, P. H. , Malz, A. , Reiners, K. S. , Grenzi, P. C. , Babatz, F. , Schauss, A. C. , Hansen, H. P. , Hallek, M. , & Pogge von Strandmann, E. (2019). Extracellular vesicle measurements with nanoparticle tracking analysis—An accuracy and repeatability comparison between NanoSight NS300 and ZetaView. Journal of Extracellular Vesicles, 8(1), 1596016. 10.1080/20013078.2019.1596016 - DOI - PMC - PubMed
    1. Buzas, E. I. (2022). The roles of extracellular vesicles in the immune system. Nature Reviews Immunology, Published online August 4, 2022. 10.1038/s41577-022-00763-8 - DOI - PMC - PubMed
    1. Caponnetto, F. , Manini, I. , Skrap, M. , Palmai‐Pallag, T. , Di Loreto, C. , Beltrami, A. P. , Cesselli, D. , & Ferrari, E. (2017). Size‐dependent cellular uptake of exosomes. Nanomedicine: Nanotechnology, Biology, and Medicine, 13(3), 1011–1020. 10.1016/j.nano.2016.12.009 - DOI - PubMed