. 2024 Aug 9:15:1373464.
doi: 10.3389/fimmu.2024.1373464. eCollection 2024.

Characteristics and impact of infiltration of B-cells from systemic sclerosis patients in a 3D healthy skin model

Affiliations

Characteristics and impact of infiltration of B-cells from systemic sclerosis patients in a 3D healthy skin model

Mathilde Le Maître et al. Front Immunol. .

Abstract

Introduction: In systemic sclerosis (SSc), B-cells are activated and present in the skin and lung of patients where they can interact with fibroblasts. The precise impact and mechanisms of the interaction of B-cells and fibroblasts at the tissular level are poorly studied.

Objective: We investigated the impact and mechanisms of B-cell/fibroblast interactions in cocultures between B-cells from patients with SSc and 3-dimensional reconstituted healthy skin model including fibroblasts, keratinocytes and extracellular matrix.

Methods: The quantification and description of the B-cell infiltration in 3D cocultures were performed using cells imagery strategy and cytometry. The effect of coculture on the transcriptome of B-cells and fibroblasts was studied with bulk and single-cell RNA sequencing approaches. The mechanisms of this interaction were studied by blocking key cytokines like IL-6 and TNF.

Results: We showed a significant infiltration of B-cells in the 3D healthy skin model. The amount but not the depth of infiltration was higher with B-cells from SSc patients and with activated B-cells. B-cell infiltrates were mainly composed of naïve and memory cells, whose frequencies differed depending on B-cells origin and activation state: infiltrated B-cells from patients with SSc showed an activated profile and an overexpression of immunoglobulin genes compared to circulating B-cells before infiltration. Our study has shown for the first time that activated B-cells modified the transcriptomic profile of both healthy and SSc fibroblasts, toward a pro-inflammatory (TNF and IL-17 signaling) and interferon profile, with a key role of the TNF pathway.

Conclusion: B-cells and 3D skin cocultures allowed the modelization of B-cells infiltration in tissues observed in SSc, uncovering an influence of the underlying disease and the activation state of B-cells. We showed a pro-inflammatory effect on skin fibroblasts and pro-activation effect on infiltrating B-cells during coculture. This reinforces the role of B-cells in SSc and provide potential targets for future therapeutic approach in this disease.

Keywords: 3D coculture; B-cell; fibroblast; fibrosis; skin; systemic sclerosis.


Conflict of interest statement

The authors declare that the research was conducted in the absence of any commercial or financial relationships that could be construed as a potential conflict of interest.

Figures
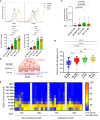
Figure 1
Figure 1
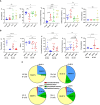
Infiltration of B-cells from healthy and SSc patients in 3D healthy skin. (A) State of proliferation and activation of B-cells before coculture, measured respectively via CD71 and CD25 markers by cytometry (N=8 patients and healthy subjects). (B) Illustration of the strategy used to collect confocal microscopy images after 4 days of coculture. The results of image analysis are presented in (C) with the quantification of B-cell signal at 40 µm (% of total surface occupied by B-cell signal normalized with the number of viable B-cells used; N=7), and in (D) with the volume occupied by B-cell signal quantified in the whole thickness of the skin (N=7 cocultures per condition; 10 images per patients and healthy subjects). (E) Repartition of B-cell infiltration represented by the % of total B-cell infiltration in the different levels of skin depth. Kruskal-Wallis non-parametric test (bar) and Mann-Whitney unpaired t-test (bracket). Mean +/- SD. NS = not significant; *p<=0.05; **p<=0.01; ***p<=0.001; ****p<=0.0001. HC NA B-cells, non-activated B-cells from healthy subjects; SSc NA B-cells, non-activated B-cells from SSc patients; HC A B-cells, activated B-cells from healthy subjects; SSc NA B-cells, non-activated B-cells from SSc patients. Panel (B) was partly generated using Servier Medical Art, provided by Servier, licensed under a Creative Commons Attribution 3.0 unported license.
Figure 2
Figure 2
Characterization of B-cells sub-populations before and after 3D cocultures. Percentages of transitional (IgD+ CD24high CD38high), naïve (IgD+), unswitched memory (IgM+ IgDlow), switched memory (IgM- IgD-) B-cells and plasmablasts (CD24- CD38+) among CD19+ cells. (A) after 4 days of coculture with healthy or SSc B-cells, activated or not, and (B) before and after 4 days of coculture with healthy or SSc non-activated B-cells. (C) Repartition of B-cells sub-populations after coculture depending on B-cell origin and activation state. Kruskal-Wallis non-parametric test (black bar) and Mann-Whitney unpaired t-test (black bracket) and Wilcoxon paired t-test (grey bracket). Mean +/- SD. NS = not significant; * p<=0.05; ** p<=0.01; *** p<=0.001. HC NA B-cells, non-activated B-cells from healthy subjects; SSc NA B-cells, non-activated B-cells from SSc patients; HC A B-cells, activated B-cells from healthy subjects; SSc NA B-cells, non-activated B-cells from SSc patients.
Figure 3
Figure 3
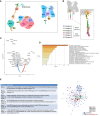
Analysis by single-cell RNAseq of activated B-cells from patients with systemic sclerosis before and after 5 days of coculture with healthy 3D skin. (A) UMAP visualization of analyzed cells from three 3D skin models alone, control SSc A B-cells from three SSc patients and three cocultures between 3D healthy skin models and SSc A B-cells. (B) Focus on LB 7 cluster, which includes all B-cells after coculture. (C) Volcano plot representing the most significant differentially expressed genes in B-cells of LB 7 cluster after coculture compared to before coculture (threshold: padj > 0.05). (D) Enrichment in GOTERM and molecular pathways and (E) Protein-protein interactions network and MCODE components identified after analysis by Metascape of genes overexpressed in c. FB, Fibroblast, LB, B-cell.
Figure 4
Figure 4
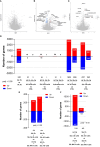
Differentially expressed genes in fibroblasts from 3D (4 days) and 2D (2 days) cocultures with B-cells analyzed with bulk-RNAseq. Volcano plots of (A) Comparison between healthy fibroblasts cocultured in 3D with healthy non-activated B-cells (HC NA B-cells) vs healthy control fibroblasts alone (B) Comparison between healthy fibroblasts cocultured in 3D with SSc non-activated B-cells (SSc NA B-cells) vs healthy control fibroblasts alone (C) Comparison between healthy fibroblasts cocultured in 3D with SSc NA B-cells vs healthy fibroblasts cocultured in 3D with HC NA B-cells. Significance thresholds: |FC| > 1.5 and padj < 0.05. Number of genes differentially expressed in fibroblasts with (D) Comparison between SSc (SSc Fb) and HC (HC Fb) fibroblasts; Comparison between HC Fb or SSc Fb cocultured in 2D with HC NA B-cells vs Fb alone, HC or SSC, (CTRL); Comparison between HC Fb or SSc Fb cocultured in 2D with SSc NA B-cells vs HC Fb or SSc Fb (=CTRL); Comparison between HC Fb or SSc Fb cocultured in 2D with activation mix (anti-BCR, CD40L/anti-histidine, CpG) vs HC Fb or SSc Fb (=CTRL); Comparison between HC Fb or SSc Fb cocultured in 2D with healthy activated B-cells (HC A B-cells) vs HC Fb or SSc Fb (=CTRL); Comparison between HC Fb or SSc Fb cocultured in 2D with SSc A B-cells vs HC Fb or SSc Fb (=CTRL); (E) Comparison between HC Fb cocultured in 2D with SSc NA B-cells or SSc A B-cells vs SSc Fb cocultured in 2D with SSc NA B-cells or SSc A B-cells. (F) Comparison between HC Fb cocultured in 2D with SSc NA B-cells vs SSc A B-cells; Comparison between SSc Fb cocultured in 2D with SSc NA B-cells vs SSc A B-cells. Significance thresholds: padj < 0.05. HC, Healthy control; NA, non-activated; A, activated; Fb, Fibroblasts; SSc, Systemic sclerosis.
Figure 5
Figure 5
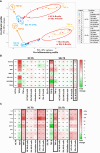
Pro-fibrotic and pro-inflammatory profiles of healthy control (n=1) and systemic sclerosis fibroblasts (n=1) after 2D coculture with activated and non-activated B-cells from healthy controls (n=5) and patients with systemic sclerosis (n=5). (A) Principal component analysis of bulk RNAseq data. The different conditions are displayed on the right. Heatmaps represent the relative expression of (B) pro-fibrotic and (C) pro-inflammatory genes measured by qPCR according to the different culture conditions. Framed results highlight conditions with similar profiles. Unpaired t-test (Mann-Whitney). *p<=0.05 **p<=0.01 ***p<=0.001. NS, not significant; HC NA B-cells, non-activated B-cells from healthy subjects; SSc NA B-cells, non-activated B-cells from SSc patients; HC A B-cells, activated B-cells from healthy subjects; SSc NA B-cells, non-activated B-cells from SSc patients.
Figure 6
Figure 6
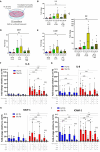
Expression of pro-inflammatory markers in healthy or SSc fibroblasts after 2 days 2D cocultures with healthy B-cells with or without blocking. (A) Experimental plan for 2D cocultures. N = 1 healthy subject for B-cells vs 4 to 5 healthy subjects for HC Fb and 4 to 5 SSc patients for SSc Fb, for all figures. Without blocking: Gene expression is measured by qPCR, normalized with GAPDH and HPRT1, in the different conditions expressed in fold-change relative to control fibroblasts: IL-6 (B), IL8 (C), MCP-1 (D) and ICAM1 (E). Statistical analysis with Kruskal-Wallis non-parametric test (bar). With blocking: HC B-cells were activated and separated from HC or SSc fibroblasts with a transwell in the different conditions. Genes expression is measured by qPCR, normalized with GAPDH and HPRT1 expressed in fold-change relative to control fibroblasts: IL-6 (F), IL8 (G), MCP-1 (H) and ICAM1 (I). Statistical analysis with Friedman non-parametric paired test (bar; separate for HC Fb and SSc Fb conditions) and Wilcoxon paired t-test (bracket). Mean +/- SD. * p<=0.05; ** p<=0.01; *** p<=0.001; **** p<=0.0001. NS, not significant; HC NA B-cells, non-activated B-cells from healthy subjects; SSc NA B-cells, non-activated B-cells from SSc patients; HC A B-cells, activated B-cells from healthy subjects; SSc NA B-cells, non-activated B-cells from SSc patients; HC Fb, control fibroblasts from healthy subjects; SSc Fb, control fibroblasts from SSc patients; aIL-6, anti-IL-6 inhibition; aTNFs, anti-TNF-α and anti-TNF-β inhibition; aGal-3, anti-galectin-3 inhibition.

References

    1. Fukasawa T, Yoshizaki A, Ebata S, Yoshizaki-Ogawa A, Asano Y, Enomoto A, et al. . Single-cell-level protein analysis revealing the roles of autoantigen-reactive B lymphocytes in autoimmune disease and the murine model. eLife. (2021) 10:e67209. doi: 10.7554/eLife.67209.sa2 - DOI - PMC - PubMed
    1. Sanges S, Guerrier T, Launay D, Lefèvre G, Labalette M, Forestier A, et al. . Role of B cells in the pathogenesis of systemic sclerosis. Rev Med Interne. (2017) 38:113–24. doi: 10.1016/j.revmed.2016.02.016 - DOI - PubMed
    1. Whitfield ML, Finlay DR, Murray JI, Troyanskaya OG, Chi JT, Pergamenschikov A, et al. . Systemic and cell type-specific gene expression patterns in scleroderma skin. Proc Natl Acad Sci U S A. (2003) 100:12319–24. doi: 10.1073/pnas.1635114100 - DOI - PMC - PubMed
    1. Lafyatis R, Kissin E, York M, Farina G, Viger K, Fritzler MJ, et al. . B cell depletion with rituximab in patients with diffuse cutaneous systemic sclerosis. Arthritis Rheumatol. (2009) 60:578–83. doi: 10.1002/art.24249 - DOI - PMC - PubMed
    1. Bosello S, Angelucci C, Lama G, Alivernini S, Proietti G, Tolusso B, et al. . Characterization of inflammatory cell infiltrate of scleroderma skin: B cells and skin score progression. Arthritis Res Ther. (2018) 20:75. doi: 10.1186/s13075-018-1569-0 - DOI - PMC - PubMed

MeSH terms

LinkOut - more resources