. 2024 Aug 9:15:1436900.
doi: 10.3389/fimmu.2024.1436900. eCollection 2024.

BAFF neutralization impairs the autoantibody-mediated clearance of dead adipocytes and aggravates obesity-induced insulin resistance

Affiliations

BAFF neutralization impairs the autoantibody-mediated clearance of dead adipocytes and aggravates obesity-induced insulin resistance

Melissa D Lempicki et al. Front Immunol. .

Abstract

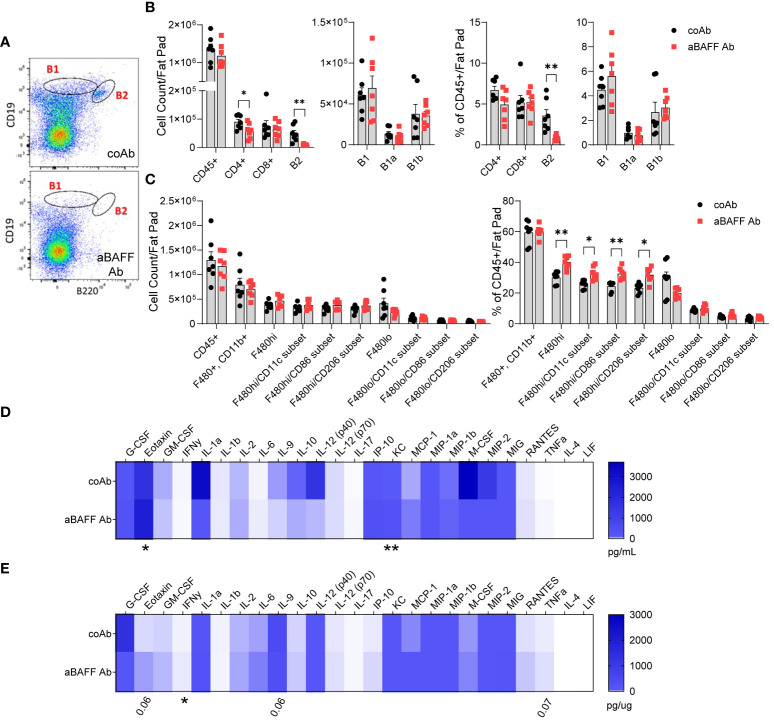
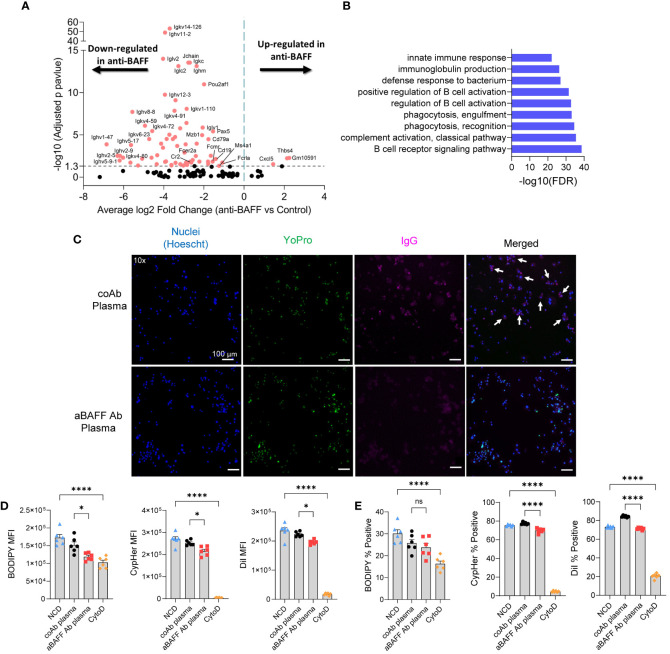
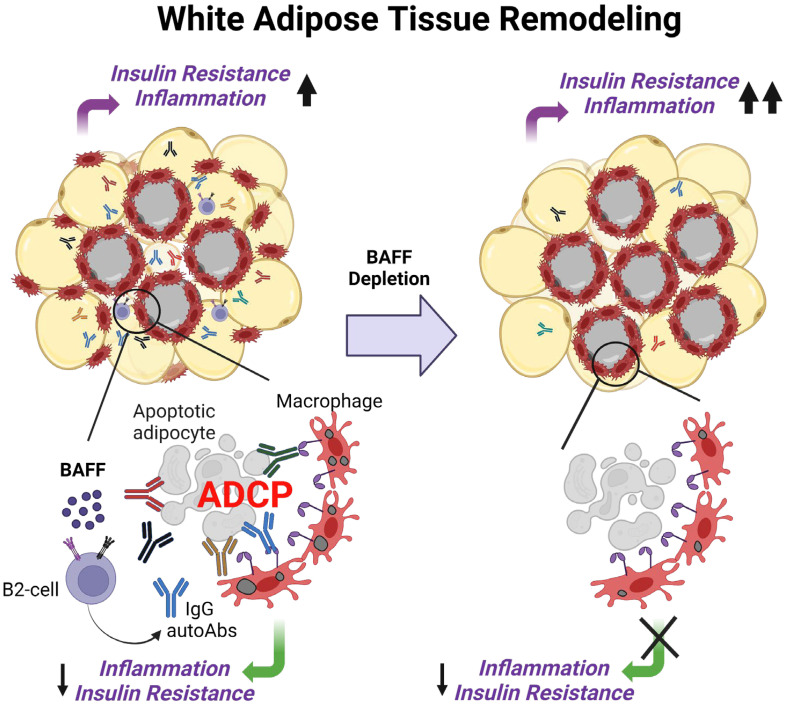
B cell-activating factor (BAFF) is a critical TNF-family cytokine that regulates homeostasis and peripheral tolerance of B2 cells. BAFF overproduction promotes autoantibody generation and autoimmune diseases. During obesity, BAFF is predominantly produced by white adipose tissue (WAT), and IgG autoantibodies against adipocytes are identified in the WAT of obese humans. However, it remains to be determined if the autoantibodies formed during obesity affect WAT remodeling and systemic insulin resistance. Here, we show that IgG autoantibodies are generated in high-fat diet (HFD)-induced obese mice that bind to apoptotic adipocytes and promote their phagocytosis by macrophages. Next, using murine models of obesity in which the gonadal WAT undergoes remodeling, we found that BAFF neutralization depleted IgG autoantibodies, increased the number of dead adipocytes, and exacerbated WAT inflammation and insulin resistance. RNA sequencing of the stromal vascular fraction from the WAT revealed decreased expression of immunoglobulin light-chain and heavy-chain variable genes suggesting a decreased repertoire of B cells after BAFF neutralization. Further, the B cell activation and the phagocytosis pathways were impaired in the WAT of BAFF-neutralized mice. In vitro, plasma IgG fractions from BAFF-neutralized mice reduced the phagocytic clearance of apoptotic adipocytes. Altogether, our study suggests that IgG autoantibodies developed during obesity, at least in part, dampens exacerbated WAT inflammation and systemic insulin resistance.

Keywords: B2 cell; BAFF; IgG autoantibodies; inflammation; obesity-induced insulin resistance; white adipose tissue.


Conflict of interest statement

The authors declare that the research was conducted in the absence of any commercial or financial relationships that could be construed as a potential conflict of interest. The author(s) declared that they were an editorial board member of Frontiers, at the time of submission. This had no impact on the peer review process and the final decision.

Figures

Figure 1
Figure 1
Autoantibodies from obese mice promote phagocytosis in an in vitro model. (A) Representative fluorescent images of apoptotic 3T3-L1 adipocytes incubated with plasma from NCD or HFD-fed mice stained for nucleus (Hoechst-blue), apoptosis (YoPro-green), and IgG (pink, anti-IgG antibody). White arrows indicate cells positive, for Hoechst, YoPro, and IgG. (B) Schematic of phagocytosis experiment used for confocal imaging. (C) 3D confocal images of macrophages (DiI-red) co-cultured with apoptotic 3T3-L1 adipocytes (BODIPY-green) for 0 hours (0hr) and 6 hours (6hr). Parts of the images were digitally enlarged to show the localization of BODIPY stains inside the macrophages with yellow arrows. (D) Schematic of phagocytosis experiment used for flow cytometry. In this experiment, macrophages were stained with CellTrace Violet, and adipocytes were stained with three dyes: BODIPY, CypHer5E, and DiI. (E, F) Flow cytometry of macrophages after co-cultured with apoptotic adipocytes in the presence of IgG-rich plasma fraction from NCD or HFD-fed mice. (E) The amount of apoptotic cell uptake was assessed by median fluorescent intensity (MFI) of BODIPY, CypHer5e, and DiI of macrophages. (F) The percentage of phagocytic macrophages was determined by the percent of BODIPY, CypHer5e, and DiI-positive macrophages. Values are expressed as means + SEM. *, p<0.05; **, p<0.01; ***, p<0.001 ****, p<0.0001 by parametric unpaired t-test. n=3 wells per treatment, 3 images each (A), n=1 well per treatment, 10 images each (C), n=6 (E, F). Scale bars: 100 μm (A); 40 μm (C).
Figure 2
Figure 2
Anti-BAFF antibody-treated mice had increased insulin resistance in the long-term high-fat diet model. (A) Representative timeline of antibody treatment for mice on HFD. (B) GTT and of mice on HFD for 12 weeks. coAb: mice treated with a control antibody, and aBAFF Ab: mice treated with anti-BAFF antibody. (C) GTT at 14 weeks, (D) GTT at 16 weeks, and, (E) GTT at 20 weeks on HFD. (F) Area under the curve (AUC) of GTTs from weeks 12, 14, 16, and 20. (G) ITT and AUC at 22 weeks on HFD. (H) Plasma insulin levels in ng/ml; (I) fat mass, lean mass, and total body weight of controls and anti-BAFF Ab-treated mice were determined by EchoMRI; (J) liver triglyceride quantified by colorimetric assay; and (K) plasma BAFF levels in ng/ml after the completion of the experiment. Values are expressed as means + SEM. *, p<0.05; **, p<0.001; ****, p<0.0001 by parametric unpaired t-test. n=9-10 (B-F, H-K) and n=5 (G).
Figure 3
Figure 3
Anti-BAFF antibody treatment impairs recovery from insulin resistance in the diet intervention model. (A) Representative timeline of diet change and antibody treatment of mice. (B) GTT and area under the curve (AUC) of mice on HFD for 12 weeks. (C) Weight loss of control and anti-BAFF Ab-injected mice after switching from HFD to NCD. (D) GTT and AUC of mice on NCD for 2 weeks (week 14). (E) ITT and AUC of mice 3 weeks on NCD (week 15). (F) GTT and AUC of mice 5 weeks on NCD (week 17). (G) Plasma insulin levels in ng/ml; (H) fat mass, lean mass, and total body weight of controls and anti-BAFF Ab-treated mice were determined by EchoMRI; (I) liver triglyceride levels; and (J) Plasma BAFF levels in ng/ml after the completion of the experiment. Values are expressed as means + SEM. *, p<0.05; ****, p<0.0001 by a parametric unpaired t-test, n=10-11 (B-F, H-J) and n=4-5 (G).
Figure 4
Figure 4
Anti-BAFF antibody treatment effectively depleted the B2 cell populations and increased inflammation in the diet intervention model. (A) Representative flow cytometry plots of B1 and B2 cell gating of the SVF from the gonadal WAT of control Ab and anti-BAFF Ab-treated mice. (B) Quantification and percent population (% of CD45+ cells) of B cell and T cell subsets in the SVF. (C) Quantification and percent population of macrophage subsets in the SVF of gonadal WAT. (D) Plasma and (E) gonadal WAT lysate cytokine and chemokine levels determined by the Milliplex Multiplex assay. Values are expressed as means + SEM. *, p<0.05; **, p<0.01; by parametric unpaired t-test, n=7 (A-C) and n=6 (D, E).
Figure 5
Figure 5
BAFF neutralization increased CLS formation and decreased autoantibody levels. (A) Representative confocal images of gonadal WAT from control and anti-BAFF Ab-treated groups stained for nucleus (DAPI-blue), macrophages (Mac2-white), and adipocytes (FABP4-green). (B) Quantification of the number of CLSs per section per mouse. (C) Plasma and (D) gonadal WAT antibody isotype levels from control and anti-BAFF Ab-treated mice. (E) Plasma IgG and (F) IgM autoAb levels in control and anti-BAFF Ab-treated mice after diet intervention. The top 20 autoAbs out of 120 tested autoAbs are shown. (G) Representative confocal images of gonadal WAT from control and anti-BAFF Ab-treated groups stained for nucleus (DAPI-blue), adipocytes (FABP4-green), necroptosis (phosphorylated MLKL - red), and IgG (white). Values are expressed as means + SEM. *, p<0.05; **, p<0.01; and ***, p<0.001 by a generalized estimating equation (B) or nonparametric U-test. n=9-10 mice, 1 section per mouse, 8-10 images per section (A, B), n=4-5 mice (C-F), n=4-6 mice, 1 section per mouse, 5 images per section (G). Scale bars: 100 μm (A, G).
Figure 6
Figure 6
BAFF neutralization impaired phagocytosis pathways in the gonadal WAT and in vitro, plasma from BAFF-neutralized mice showed lesser phagocytotic activity compared to the plasma from the control mice. (A) Volcano plot of RNA-seq data for the SVF of diet intervention mice. Significantly up-and down-regulated genes are reported as red dots. The P-value threshold (0.05) is shown as a dashed line. (B) Gene ontology (GO) functional enrichment analysis of significant down-regulated DEGs. Top 9 GO terms of biological processes shown. The horizontal axis represents negative Log10 of the false discovery rate. (C) Representative fluorescent images of apoptotic adipocytes incubated with plasma from NCD or HFD-fed mice stained for nucleus (Hoechst-blue), apoptosis (YoPro-green), and IgG (pink, anti-IgG antibody). White arrows indicate cells positive for Hoechst, YoPro, and IgG staining. (D, E) Flow cytometry of macrophages after co-cultured with apoptotic adipocytes in the presence of IgG-rich plasma from control or anti-BAFF Ab-treated diet intervention mice. (D) The amount of apoptotic cell uptake was assessed by median fluorescent intensity (MFI) of BODIPY, CypHer5e, and DiI of macrophages. (E) The percentage of phagocytic macrophages was determined by the percent of BODIPY, CypHer5e, and DiI-positive macrophages. Values are expressed as means + SEM. *, p<0.05; ****, p<0.0001 by parametric unpaired t-test. n=4-5 (A & B), n=3 wells per treatment, 3 images each (C), and n=6 (D–E). Scale bars: 100 μm (D).
Figure 7
Figure 7
Working model of BAFF’s role in the regulation of insulin resistance during healthy remolding of white adipose tissue. Excess BAFF promotes the survival of autoreactive B2 cells leading to the production of IgG autoantibodies against dead adipocytes. During healthy remodeling of the white adipose tissue, these IgG autoantibodies, natural and adaptive IgM antibodies bind to the dead adipocytes, promote their phagocytic clearance by macrophages, and lower inflammation and IR. The introduction of a BAFF-neutralizing antibody causes depletion of adipocyte-binding autoantibodies, dysregulating remodeling the white adipose tissue, and impairing the recovery from insulin resistance.

References

    1. Czech MP. Mechanisms of insulin resistance related to white, beige, and brown adipocytes. Mol Metab. (2020) 34:27–42. doi: 10.1016/j.molmet.2019.12.014 - DOI - PMC - PubMed
    1. Winer DA, Winer S, Shen L, Wadia PP, Yantha J, Paltser G, et al. . B cells promote insulin resistance through modulation of T cells and production of pathogenic igg antibodies. Nat Med. (2011) 17:610–7. doi: 10.1038/nm.2353 - DOI - PMC - PubMed
    1. Lumeng CN, Deyoung SM, Bodzin JL, Saltiel AR. Increased inflammatory properties of adipose tissue macrophages recruited during diet-induced obesity. Diabetes. (2007) 56:16–23. doi: 10.2337/db06-1076 - DOI - PubMed
    1. Lumeng CN, Bodzin JL, Saltiel AR. Obesity induces a phenotypic switch in adipose tissue macrophage polarization. J Clin Invest. (2007) 117:175–84. doi: 10.1172/JCI29881 - DOI - PMC - PubMed
    1. Cinti S, Mitchell G, Barbatelli G, Murano I, Ceresi E, Faloia E, et al. . Adipocyte death defines macrophage localization and function in adipose tissue of obese mice and humans. J Lipid Res. (2005) 46:2347–55. doi: 10.1194/jlr.M500294-JLR200 - DOI - PubMed

MeSH terms