. 2024 Aug 9:15:1367819.
doi: 10.3389/fimmu.2024.1367819. eCollection 2024.

Dietary galactose exacerbates autoimmune neuroinflammation via advanced glycation end product-mediated neurodegeneration

Affiliations

Dietary galactose exacerbates autoimmune neuroinflammation via advanced glycation end product-mediated neurodegeneration

Stefanie Haase et al. Front Immunol. .

Abstract

Background: Recent studies provide increasing evidence for a relevant role of lifestyle factors including diet in the pathogenesis of neuroinflammatory diseases such as multiple sclerosis (MS). While the intake of saturated fatty acids and elevated salt worsen the disease outcome in the experimental model of MS by enhanced inflammatory but diminished regulatory immunological processes, sugars as additional prominent components in our daily diet have only scarcely been investigated so far. Apart from glucose and fructose, galactose is a common sugar in the so-called Western diet.

Methods: We investigated the effect of a galactose-rich diet during neuroinflammation using myelin oligodendrocyte glycoprotein-induced experimental autoimmune encephalomyelitis (MOG-EAE) as a model disease. We investigated peripheral immune reactions and inflammatory infiltration by ex vivo flow cytometry analysis and performed histological staining of the spinal cord to analyze effects of galactose in the central nervous system (CNS). We analyzed the formation of advanced glycation end products (AGEs) by fluorescence measurements and investigated galactose as well as galactose-induced AGEs in oligodendroglial cell cultures and induced pluripotent stem cell-derived primary neurons (iPNs).

Results: Young mice fed a galactose-rich diet displayed exacerbated disease symptoms in the acute phase of EAE as well as impaired recovery in the chronic phase. Galactose did not affect peripheral immune reactions or inflammatory infiltration into the CNS, but resulted in increased demyelination, oligodendrocyte loss and enhanced neuro-axonal damage. Ex vivo analysis revealed an increased apoptosis of oligodendrocytes isolated from mice adapted on a galactose-rich diet. In vitro, treatment of cells with galactose neither impaired the maturation nor survival of oligodendroglial cells or iPNs. However, incubation of proteins with galactose in vitro led to the formation AGEs, that were increased in the spinal cord of EAE-diseased mice fed a galactose-rich diet. In oligodendroglial and neuronal cultures, treatment with galactose-induced AGEs promoted enhanced cell death compared to control treatment.

Conclusion: These results imply that galactose-induced oligodendrocyte and myelin damage during neuroinflammation may be mediated by AGEs, thereby identifying galactose and its reactive products as potential dietary risk factors for neuroinflammatory diseases such as MS.

Keywords: MOG-EAE; advanced glycation end products; galactose; human induced primary neurons; multiple sclerosis; neuroinflammation; oligodendrocytes.


Conflict of interest statement

The authors declare that the research was conducted in the absence of any commercial or financial relationships that could be construed as a potential conflict of interest. The reviewer ML declared a shared affiliation with the authors KK and FM to the handling editor at the time of the review.

Figures

Figure 1
Figure 1
A diet rich in galactose exacerbates the clinical symptoms in MOG-EAE. C57BL/6N mice with an age of 11.9 weeks ± 4 days were adapted to a galactose-rich diet 14 days prior to active immunization and during MOG-EAE. (A) Clinical course of MOG-EAE (controls: n=5, galactose-diet: n=6). Mice were daily scored for clinical signs on a 5-point scale. (B) Blood glucose levels were measured after 14 days of galactose feeding prior to active immunization (d0) and at the maximum of MOG-EAE (d21; n=3 mice per group and time point). All data are represented as mean ± SEM; (A) ***p<0.001 using a Mann-Whitney test, (B) data were analyzed by two-way ANOVA.
Figure 2
Figure 2
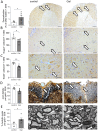
A galactose-rich diet significantly increased demyelination and impaired the neuro-axonal integrity during MOG-EAE. C57BL/6N mice were adapted to a galactose-rich diet 14 days prior to active immunization and during MOG-EAE. Histological analyses were performed on spinal cord cross sections from control or galactose-treated (Gal) mice suffering from chronic EAE (34 days p.i., control n=5, Gal n=6) for (A) demyelination with CNPase staining, IHC-staining of (B) oligodendrocytes, (C) anterior horn neurons, and (D) axonal densities determined by Bielschowsky silver staining. (E) Analysis of axolytic axons using electron microscopy (n=5 per group). Left: Scale bars depict mean ± SEM. Right: Representative images of the respective staining. Scale bars are 400µm in (A, B), 200µm (C, D) and 5µm in (E). White arrows show the demyelinated regions in (A), positive cells in (B, C), axons in (D) or axolytic axons in (E). *p<0.05, **p<0.01 using an unpaired t-test.
Figure 3
Figure 3
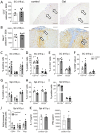
A galactose-rich diet does not affect immunological processes during MOG-EAE. C57BL/6N mice were adapted to a galactose-rich diet 14 days prior to active immunization and during MOG-EAE. (A, B) Histological analysis of spinal cord cross sections for (A) CD3+ T cells and (B) Mac3+ macrophages/microglia at the maximum of EAE (16 days p.i., control n=5, Gal n=6). Right: Representative images. Scale bars are 200µm. White arrows mark positive cells. (C, D) Flow cytometry analysis of spinal cord infiltrating cells isolated on day 16 of EAE for IFNγ+ Th1 cells, IL-17A+ Th17 cells and FoxP3+ Treg cells and (D) CD11b+/CD11c+ APCs (Th1, Th17, CD11b, CD11c control n=9, Gal n=10; Treg control n=5, Gal n=6). (E) Activation of spinal cord infiltrating CD4+ T cells was analyzed by flow cytometry analysis of CD44 and CD25 expression in CD4+ T cells (n=5 per group). (F) Activation of spinal cord CD11b+/CD11c+ cells was analyzed by flow cytometry analysis of CD69 expression in CD11b+/CD11c+ cells in the spinal cord in day 16 p.i. (n=5 per group). (G, H) Flow cytometry analysis of splenic cells isolated on day 10 of EAE for (G) IFNγ+ Th1 cells, IL-17A+ Th17 cells and CD25+FoxP3+ Treg cells and (H) CD11b+/CD11c+ APCs. (n=5 per group). (I) Activation of splenic CD4+ T cells was analyzed by flow cytometry analysis of CD44 and CD25 expression in CD4+ T cells (n=5 per group). (J, K) Splenocytes were isolated on day 10 of EAE from control and galactose treated mice and in vitro restimulated with MOG peptide for 48h and 72h. (J) Proliferation of CD4+ T cells, IFNγ secreting Th1 cells or FoxP3 expressing Treg cells was analyzed via flow cytometry as fold increase of proliferating cells upon antigen re-stimulation compared to control treated cells after 72h. (n=5 per group). (K) Cytokines in cell culture supernatants were measured by ELISA after 48h. All data are presented as mean ± SEM. Scale bars depict mean ± SEM. Data were analyzed by unpaired t-test or two-way ANOVA.
Figure 4
Figure 4
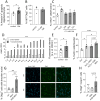
Galactose enhances the formation of AGEs that affects neuronal and oligodendroglial cell viability. (A) C57BL/6N mice were adapted to a galactose-rich diet 14 days prior to active immunization and during MOG-EAE. Oligodendrocytes (O4+) were isolated via magnetic cell separation on day 20 of EAE and stained with Annexin-V and viability dye for the analysis of cell apoptosis. The frequency of Annexin-V+ cells in O4+ cells was analyzed by flow cytometry (control n=5, Gal n=8). (B) Percentage of Ki67+ Olig2+ proliferative cells in oligodendroglial cell cultures after incubation with or without 1.5 mM galactose for 3 days determined by immunofluorescence staining (n=3). (C) Percentage of apoptotic cells in human neuronal iPSCs cultures treated with 1.5mM galactose for 24h, 48h and 72h (n=3-4 from two independent experiments). (D) Incubation of BSA (10 mg/ml) without galactose (control) or with 0.5 M D-galactose (AGE-BSA) and weekly determination of the formation of AGE-BSA over a 12 week (w) period after dialysis by measurement of autofluorescence (n=3, one representative experiment is shown). (E) Determination of fluorescent AGEs in protein isolated from spinal cord on day 16 of MOG-EAE of control diet mice compared to mice on a galactose-rich diet (control n=8; Gal n=5). (F) Percentage of apoptotic cells in human neuronal iPSCs cultures treated with H2O2, H2O2+BSA or H2O2+50 µg/ml AGE-BSA for 48 h (n=4 from two independent experiments). (G) Percentage of Olig2+ cells with apoptotic nuclei in oligodendrocyte cultures after treatment with 50 µg/ml AGE-BSA or BSA alone for 72 h assessed by immunofluorescence staining (n=4) and representative images (arrows indicate Olig2+ cells with shrunken nuclei). (H) Percentage of Caspase-3+ cells in oligodendroglial cell cultures after treatment with 50 µg/ml AGE-BSA or BSA alone for 72 h assessed by immunofluorescence staining (n=4). Scale bars depict mean ± SEM; *p<0.05, **p< 0.01, ***p<0.001 using an unpaired t test in (A, B, E) or an ordinary one-way ANOVA in (C, D, F–H).

References

    1. Manzel A, Muller DN, Hafler DA, Erdman SE, Linker RA, Kleinewietfeld M. Role of Western diet in inflammatory autoimmune diseases. Curr Allergy Asthma Rep. (2014) 14:404. doi: 10.1007/s11882-013-0404-6 - DOI - PMC - PubMed
    1. Jörg S, Grohme DA, Erzler M, Binsfeld M, Haghikia A, Müller DN. Environmental factors in autoimmune diseases and their role in multiple sclerosis. Cell Mol Life Sci CMLS. (2016) 73:4611–22. doi: 10.1007/s00018-016-2311-1 - DOI - PMC - PubMed
    1. Swank RL, Lerstad O, Strøm A, Backer J. Multiple sclerosis in rural Norway its geographic and occupational incidence in relation to nutrition. N Engl J Med. (1952) 246:722–8. doi: 10.1056/NEJM195205082461901 - DOI - PubMed
    1. Kleinewietfeld M, Manzel A, Titze J, Kvakan H, Yosef N, Linker RA. Sodium chloride drives autoimmune disease by the induction of pathogenic TH17 cells. Nature. (2013) 496:518–22. doi: 10.1038/nature11868 - DOI - PMC - PubMed
    1. Jörg S, Kissel J, Manzel A, Kleinewietfeld M, Haghikia A, Gold R. High salt drives Th17 responses in experimental autoimmune encephalomyelitis without impacting myeloid dendritic cells. Exp Neurol Mai. (2016) 279:212–22. doi: 10.1016/j.expneurol.2016.03.010 - DOI - PubMed

MeSH terms

LinkOut - more resources