. 2024 Aug 9:16:1435445.
doi: 10.3389/fnagi.2024.1435445. eCollection 2024.

Modeling APOE ε4 familial Alzheimer's disease in directly converted 3D brain organoids

Affiliations

Modeling APOE ε4 familial Alzheimer's disease in directly converted 3D brain organoids

Yunkyung Kim et al. Front Aging Neurosci. .

Abstract

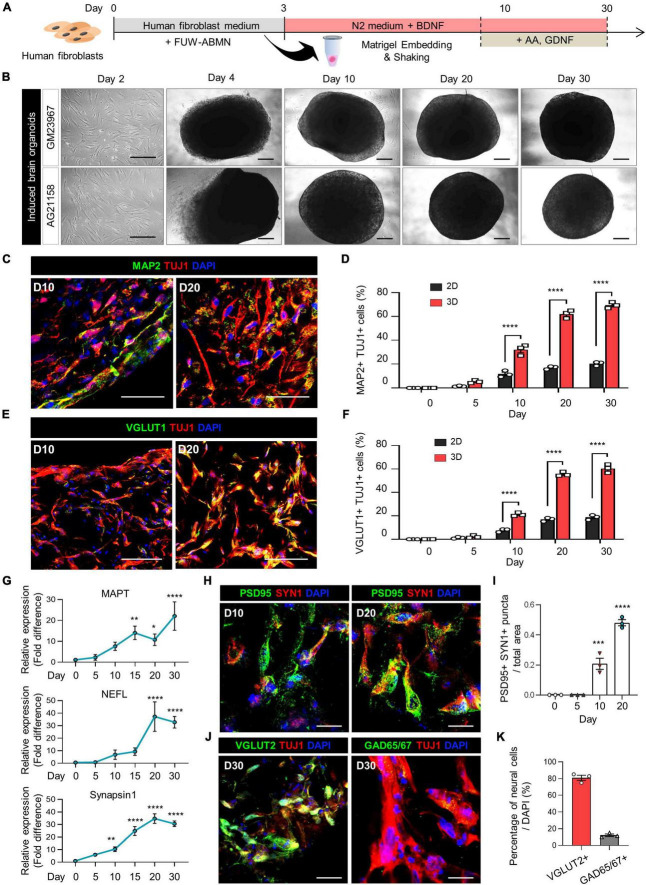
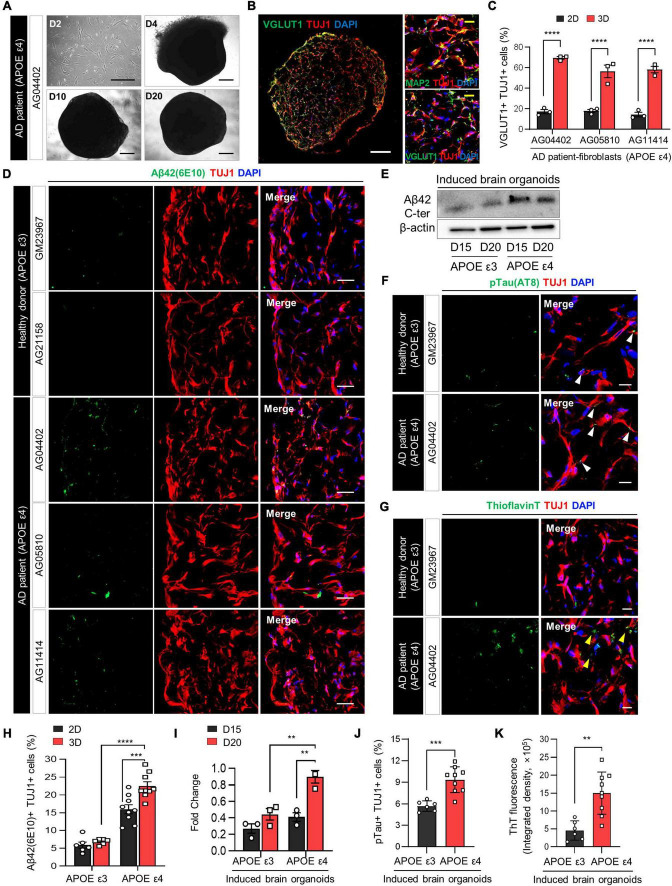
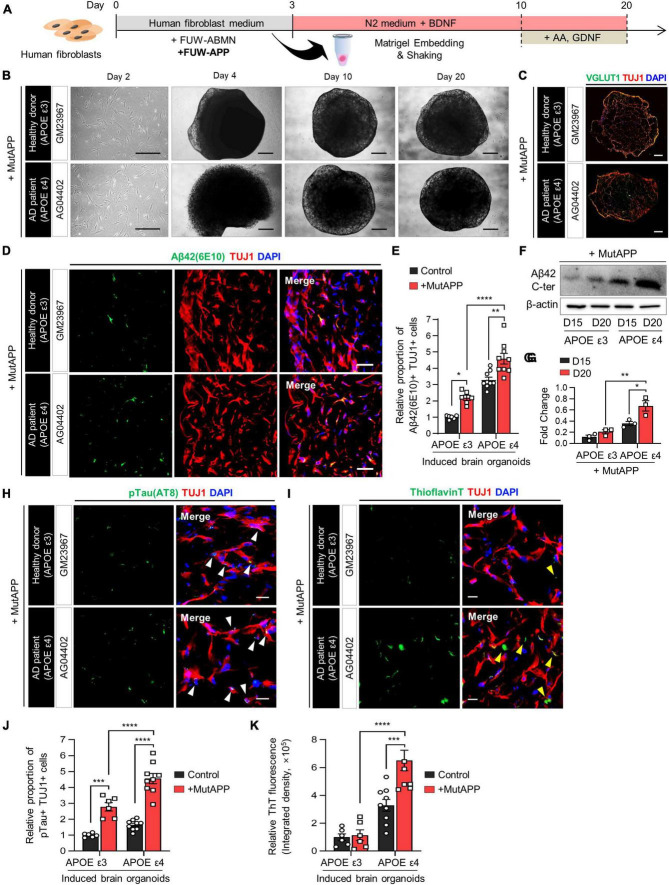
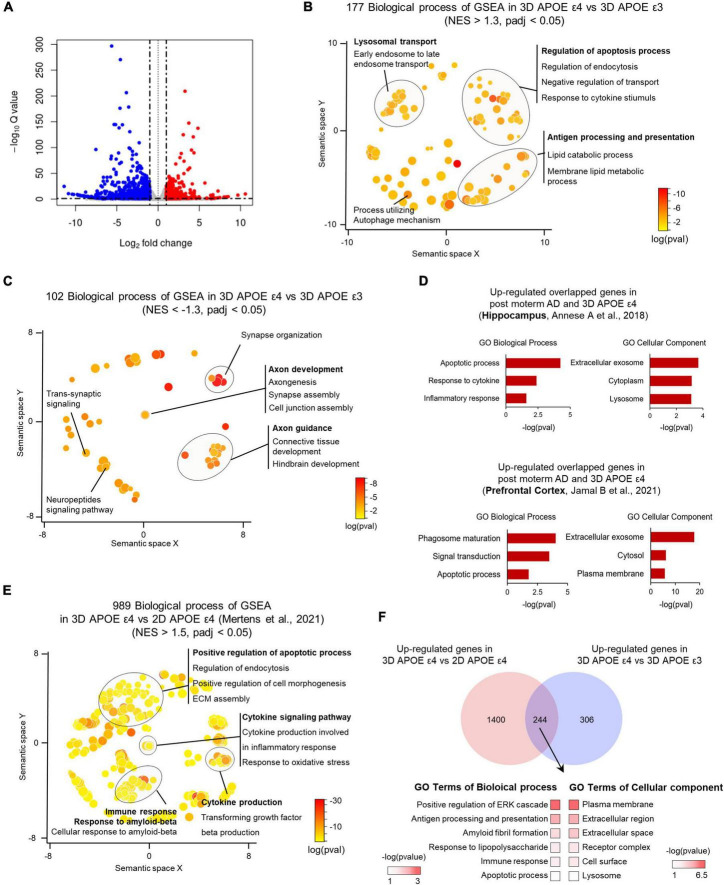
Brain organoids have become a valuable tool for studying human brain development, disease modeling, and drug testing. However, generating brain organoids with mature neurons is time-intensive and often incomplete, limiting their utility in studying age-related neurodegenerative diseases such as Alzheimer's disease (AD). Here, we report the generation of 3D brain organoids from human fibroblasts through direct reprogramming, with simplicity, efficiency, and reduced variability. We also demonstrate that induced brain organoids from APOE ε4 AD patient fibroblasts capture some disease-specific features and pathologies associated with APOE ε4 AD. Moreover, APOE ε4-induced brain organoids with mutant APP overexpression faithfully recapitulate the acceleration of AD-related pathologies, providing a more physiologically relevant and patient-specific model of familial AD. Importantly, transcriptome analysis reveals that gene sets specific to APOE ε4 patient-induced brain organoids are highly similar to those of APOE ε4 post-mortem AD brains. Overall, induced brain organoids from direct reprogramming offer a promising approach for more efficient and controlled studies of neurodegenerative disease modeling.

Keywords: 3D modeling; Alzheimer’s disease; amyloid-beta; apolipoprotein E; direct conversion.


Conflict of interest statement

The authors declare that the research was conducted in the absence of any commercial or financial relationships that could be construed as a potential conflict of interest.

Figures

FIGURE 1
FIGURE 1
Generation of induced brain organoids from human fibroblasts using 3D direct reprogramming. (A) Schematic diagram illustrating the generation of directly reprogrammed 3D-cultured induced brain organoids from human fibroblasts. (B) Bright-field images of 2D-cultured human fibroblasts at day 2 and 3D-cultured induced brain organoids at days 4, 10, 20, and 30 after seeding. Scale bar = 500 μm. (C) Immunostaining of Tuj1+Map2+ cells in 3D induced brain organoids derived from GM23967 at different time points. Scale bar = 100 μm. (D) Quantification of Tuj1- and Map2-positive cells in 2D-cultured plates and 3D-cultured induced brain organoids at different time points. Data represent mean ± SEM. Two-way ANOVA with Tukey’s multiple comparisons test, ****P < 0.0001, n = 3 per fibroblast. (E) Immunostaining of Tuj1+Vglut1+ cells in 3D induced brain organoids derived from GM23967 at different time points. Scale bar = 100 μm. (F) Quantification of Tuj1- and Vglut1-positive cells in 2D-cultured plates and 3D-cultured induced brain organoids at different time points. Data represent mean ± SEM. Two-way ANOVA with Tukey’s multiple comparisons test, ****P < 0.0001, n = 3 per fibroblast. (G) Quantitative RT-qPCR analysis of 3D induced brain organoids regarding MAPT and NEFL (neuronal markers), as well as Synapsin1 (a pre-synaptic marker), at different time points. Data represent mean ± SEM. One-way ANOVA with Tukey’s multiple comparisons test, *P < 0.05, **P < 0.01, ***P < 0.001, ****P < 0.0001, n = 3 per sample. (H) Immunofluorescence staining of Syn1- and PSD95-positive cells in 3D induced brain organoids derived from GM23967. Scale bar = 20 μm. (I) The number of Syn+PSD95+ puncta per total area at different time points. Data represent mean ± SEM. Ordinary one-way ANOVA with Dunnett’s multiple comparisons test, ***P < 0.001, ****P < 0.0001, n = 3 per fibroblast. (J) Immunofluorescence staining of Tuj1+Vglut2+ or Tuj1+GAD65/67+ cells in 3D induced brain organoids derived from GM23967 at day 30. Scale bar = 20 μm. (K) Percentage of Vglut2- or GAD65/67-positive neural cells. n = 3 per fibroblast.
FIGURE 2
FIGURE 2
Increase in AD-related phenotypes in APOE ε4-expressing 3D induced brain organoids from AD patients compared to those expressing APOE ε3. (A) Bright-field images of 2D-cultured fibroblasts from an AD patient (AG04402) at day 2 and 3D-cultured induced brain organoids at days 4, 10, and 20. Scale bar = 500 μm. (B) Representative immunofluorescence images of Tuj1+Map2+ or Tuj1+Vglut1+ cells in 3D induced brain organoids derived from AG04402 (APOE ε4) at day 20. Scale bar = 250 μm (white) or 20 μm (yellow). (C) Quantification of Tuj1- and Vglut1-positive cells in 3D induced brain organoids derived from AD patients at day 20. Data represent mean ± SEM. Two-way ANOVA with Tukey’s multiple comparisons test, ****P < 0.0001, n = 3 per fibroblast. (D) Immunostaining of Aβ42(6E10)- and Tuj1-positive cells in 3D induced brain organoids from healthy donors (GM23967 and AG21158) and AD patients (AG04402, AG05810, and AG11414) at day 20. Scale bar = 50 μm. (E) Western blot analysis of β-Amyloid in APOE ε3- or APOE ε4-expressing 3D induced brain organoids on days 15 and 20. (F) Representative immunofluorescence images of phosphorylated tau (pTau) in 3D induced brain organoids from a healthy donor or an AD patient at day 20. White arrows indicate areas that are double positive for pTau and Tuj1. Scale bar = 20 μm. (G) Representative images of Thioflavin T (ThT) staining in 3D induced brain organoids from a healthy donor or an AD patient at day 20. Yellow arrows indicate areas that are ThT-positive and correspond to the extracellular region. Scale bar = 20 μm. (H) Quantification of Tuj1- and Aβ42(6E10)-positive cells in 3D induced brain organoids derived from APOE ε3- or APOE ε4-fibroblasts. Data represent mean ± SEM. Two-way ANOVA with Tukey’s multiple comparisons test, ***P < 0.001, ****P < 0.0001, n = 3 per fibroblast for both APOE ε3 (GM23967 and AG21158) and APOE ε4 (AG04402, AG05810, and AG11414). (I) Quantification of Western blot analysis data for β-Amyloid in APOE ε3- or APOE ε4-expressing 3D induced brain organoids on days 15 and 20. Data represent the mean ± SEM. Two-way ANOVA with Tukey’s multiple comparison test; **P < 0.01, n = 3 per sample. (J) Quantification of pTau- and Tuj1-positive cells in 3D induced brain organoids derived from APOE ε3 or APOE ε4 fibroblasts. Data represent mean ± SEM. Unpaired t-test, ***P < 0.001. n = 3 per fibroblast for both APOE ε3 (GM23967 and AG21158) and APOE ε4 (AG04402, AG05810, and AG11414). (K) Measurement of ThT fluorescence as integrated density values using ImageJ software in 3D induced brain organoids from APOE ε3 or ε4 fibroblasts. Data represent mean ± SEM. Unpaired t-test, **P < 0.01. n = 3 per fibroblast for both APOE ε3 (GM23967 and AG21158) and APOE ε4 (AG04402, AG05810, and AG11414).
FIGURE 3
FIGURE 3
Acceleration of Aβ deposition and Aβ-associated pathologies in APOE ε4 3D induced brain organoids with APP mutation. (A) Schematic diagram of the generation of 3D-cultured induced brain organoids with APP mutation from AD patient fibroblasts. (B) Bright-field images of 2D-cultured human fibroblasts at day 2 and 3D-cultured induced brain organoids at day 4, 10, and 20 from a healthy donor (GM23967) or an AD patient (AG04402). Scale bar = 500 μm. (C) Immunostaining of Tuj1+Vglut1+ cells in induced brain organoids with APP mutation from a healthy donor or an AD patient at day 20. Scale bar = 250 μm. (D) Representative immunofluorescence images of Aβ42(6E10)- and Tuj1-positive cells in induced brain organoids with APP mutation from a healthy donor or an AD patient at day 20. Scale bar = 50 μm. (E) Quantification of Tuj1- and Aβ42(6E10)-positive cells in induced brain organoids with APP mutation derived from APOE ε3 or APOE ε4 fibroblasts. Data represent mean ± SEM. Unpaired t-test, *P < 0.05, **P < 0.01, ****P < 0.0001. n = 3 per fibroblast for both APOE ε3 (GM23967 and AG21158) and APOE ε4 (AG04402, AG05810, and AG11414). (F,G) Western blot analysis of β-Amyloid in APOE ε3- or APOE ε4-expressing induced brain organoids with APP mutation on day 15 and 20 with quantification. Data represent mean ± SEM. Two-way ANOVA with Tukey’s multiple comparisons test, *P < 0.05, **P < 0.01, n = 3 per sample. (H) Representative immunofluorescence images of phosphorylated tau (pTau) in induced brain organoids with APP mutation from a healthy donor or an AD patient at day 20. White arrows indicate areas that are double positive for pTau and Tuj1. Scale bar = 20 μm. (I) Representative images of Thioflavin T (ThT) staining in induced brain organoids with APP mutation from a healthy donor or an AD patient at day 20. Yellow arrows indicate areas that are ThT-positive and correspond to the extracellular region. Scale bar = 20 μm. (J) Quantification of pTau- and Tuj1-positive cells in induced brain organoids with APP mutation derived from APOE ε3 or ε4 fibroblasts. Data represent mean ± SEM. Unpaired t-test, ***P < 0.001, ****P < 0.0001. n = 3 per fibroblast for both APOE ε3 (GM23967 and AG21158) and APOE ε4 (AG04402, AG05810, and AG11414). (K) Measurement of ThT fluorescence as integrated density values using ImageJ software in induced brain organoids with APP mutation from APOE ε3 or ε4 fibroblasts. Data represent mean ± SEM. Unpaired t-test, ***P < 0.001, ****P < 0.0001. n = 3 per fibroblast for both APOE ε3 (GM23967 and AG21158) and APOE ε4 (AG04402, AG05810, and AG11414).
FIGURE 4
FIGURE 4
Transcriptome analysis of APOE ε4-expressing 3D induced brain organoids. (A) Volcano plot for APOE ε4 versus ε3 DE genes in 3D induced brain organoids. (B) Enriched GO terms for genes significantly upregulated in APOE ε4-induced brain organoids versus APOE ε3-induced brain organoids within a redundancy-trimmed semantic space (NES > 1.3, adjusted p-value < 0.05). (C) Enriched GO terms for genes significantly downregulated in APOE ε4-induced brain organoids versus APOE ε3-induced brain organoids within a redundancy-trimmed semantic space (NES < –1.3, adjusted p-value < 0.05). (D) Bar graph showing GO categories from overlapping genes that are commonly changed in the same direction in APOE ε4-induced brain organoids and post-mortem brain (hippocampus and prefrontal cortex). (E) Enriched GO terms in significantly upregulated 3D APOE ε4-induced brain organoids versus 2D APOE ε4-induced neurons genes in redundancy-trimmed semantic space (NES < 1.5, adjusted p-value < 0.05). (F) Venn diagram and GO categories showing overlapping up-regulated genes from 3D versus 2D APOE ε4 conditions and from 3D APOE ε4 versus ε3 conditions.

Similar articles

Cited by

References

    1. Centeno E. G., Cimarosti H., Bithell A. (2018). 2D versus 3D human induced pluripotent stem cell-derived cultures for neurodegenerative disease modelling. Mol. Neurodegener. 13 1–15. 10.1186/s13024-018-0258-4 - DOI - PMC - PubMed
    1. Chen H., I, Song H., Ming G. L. (2019). Applications of human brain organoids to clinical problems. Dev. Dyn. 248 53–64. 10.1002/dvdy.24662 - DOI - PMC - PubMed
    1. Chiaradia I., Lancaster M. A. (2020). Brain organoids for the study of human neurobiology at the interface of in vitro and in vivo. Nat. Neurosci. 23 1496–1508. 10.1038/s41593-020-00730-3 - DOI - PubMed
    1. Faravelli I., Costamagna G., Tamanini S., Corti S. (2020). Back to the origins: Human brain organoids to investigate neurodegeneration. Brain Res. 1727:146561. 10.1016/j.brainres.2019.146561 - DOI - PubMed
    1. Gu L., Guo Z. (2013). Alzheimer’s Aβ42 and Aβ40 peptides form interlaced amyloid fibrils. J. Neurochem. 126 305–311. 10.1111/jnc.12202 - DOI - PMC - PubMed

LinkOut - more resources