. 2024 Nov 15;84(22):3772-3787.
doi: 10.1158/0008-5472.CAN-23-3890.

PTEN Loss Shapes Macrophage Dynamics in High-Grade Serous Ovarian Carcinoma

Affiliations

PTEN Loss Shapes Macrophage Dynamics in High-Grade Serous Ovarian Carcinoma

Sarah Spear et al. Cancer Res. .

Abstract

High-grade serous ovarian carcinoma (HGSC) remains a disease with poor prognosis that is unresponsive to current immune checkpoint inhibitors. Although PI3K pathway alterations, such as PTEN loss, are common in HGSC, attempts to target this pathway have been unsuccessful. We hypothesized that aberrant PI3K pathway activation may alter the HGSC immune microenvironment and present a targeting opportunity. Single-cell RNA sequencing identified populations of resident macrophages specific to Pten-null omental tumors in murine models, which were confirmed by flow cytometry. These macrophages were derived from peritoneal fluid macrophages and exhibited a unique gene expression program, marked by high expression of the enzyme heme oxygenase-1 (HMOX1). Targeting resident peritoneal macrophages prevented the appearance of HMOX1hi macrophages and reduced tumor growth. In addition, direct inhibition of HMOX1 extended survival in vivo. RNA sequencing identified IL33 in Pten-null tumor cells as a likely candidate driver, leading to the appearance of HMOX1hi macrophages. Human HGSC tumors also contained HMOX1hi macrophages with a corresponding gene expression program. Moreover, the presence of these macrophages was correlated with activated tumoral PI3K/mTOR signaling and poor overall survival in patients with HGSC. In contrast, tumors with low numbers of HMOX1hi macrophages were marked by increased adaptive immune response gene expression. These data suggest targeting HMOX1hi macrophages as a potential therapeutic strategy for treating poor prognosis HGSC. Significance: Macrophages with elevated HMOX1 expression are enriched in PTEN-deficient high-grade serous ovarian carcinoma, promote tumor growth, and represent a potential therapeutic target.


Conflict of interest statement

S. Spear reports receiving salary and research consumable support through a grant from the charity Ovarian Cancer Action, reference PSF687. O. Le Saux reports grants from AstraZeneca and Bristol Myers Squibb outside the submitted work. J.D. Brenton reports grants from Cancer Research UK during the conduct of the study, as well as personal fees and other support from Tailor Bio Ltd. and personal fees from GSK, GE Healthcare, and Clovis Oncology outside the submitted work. B.C. Vanderhyden reports grants from Ovarian Cancer Canada outside the submitted work. I.A. McNeish reports grants from Ovarian Cancer Action and Cancer Research UK, grants and personal fees from AstraZeneca, and personal fees from GSK, pharma&, Clovis Oncology, Roche, BioNTech, OncoC4, and Duke Street Bio outside the submitted work. No disclosures were reported by the other authors.

Figures

Figure 1.
Figure 1.
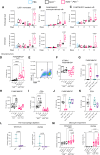
Pten-null cells are dependent on a tumor microenvironment for accelerated tumor growth. A, Survival curve for mice injected with ID8 Trp53−/− (clones F3, M20, and C7) and Trp53−/−;Pten−/− (clones Pten1.12, Pten1.14, and Pten1.15), n = 6 per clone. Statistical significance was tested using the log-rank (Mantel–COX) test. B, ID8 Trp53−/− (F3) and Trp53−/−;Pten−/− (Pten1.14) cells grown in flat high-attachment plates were imaged every 4 hours over 72 hours. Each data point represents the average of three to four technical replicates per clone and four images per replicate. Data were generated as phase object count per well normalized to the first scan (“0 hour”). Representative data from the experiment are shown. C, Mean doubling time of ID8 cells grown in conditions as in B for 72 hours. Each data point represents a clone grown at a different passage or different clone; an average of three to four wells, and four images per well were used to generate each data point. Clones were plated as follows: Trp53−/− ID8-F3 (circle), ID8-M20 (square), and Trp53−/−;Pten−/−, ID8-F3; Pten1.14 (circle), ID8-F3;Pten1.15 (triangle). Significance was tested by an unpaired t test. D, Mean doubling time of ID8 subclones grown in 2D under same conditions as in C. Clones used were Trp53−/− (F3), Trp53−/−;Pten−/− (Pten1.14), Trp53−/−;Brca2−/− (Brca2 2.14), and Trp53−/−;Brca2−/−;Pten−/− (Brca2.14 Pten22). Statistical significance was tested using an ordinary one-way ANOVA, with Šidák multiple comparison test on selected pairs. E, ID8 Trp53−/− (F3), Trp53−/−;Pten−/− (Pten1.14) cells were seeded and grown in 4%, 0.4%, or 0% FBS for up to 72 hours, and the doubling time was calculated as in C. Each symbol represents the average of technical triplicates, performed over three passages (P1, P4, and P5). Statistical significance was tested using an ordinary one-way ANOVA, with the Šidák multiple comparison test on selected pairs. F, ID8 clones Trp53−/− (F3), Trp53−/−;Pten−/− (Pten1.14) were grown in low-attachment u-bottomed plates for 168 hours. Each symbol represents the average of technical triplicates, repeated on two passages. The largest brightfield object area (μm2) per image was quantified and shown over time. G, Mice were injected with either PBS, Trp53−/− (F3), or Trp53−/−;Pten−/− (Pten1.14) ID8 cells on day 0 and a peritoneal lavage was performed on days 1, 2, 7, and 14. The ID8 cell count was estimated by flow cytometry (gated on as CD45-, SSC-Ahi, Live). Each point represents an individual mouse. Statistical significance was tested using an ordinary one-way ANOVA, with the Šidák multiple comparison test on selected pairs. H, Mice were injected with Trp53−/− (F3) or Trp53−/−;Pten−/− (Pten1.14) ID8 cells on day 0 and the omental tumors harvested at days 14, 25, and 28. Tumor weights shown are pooled from several experiments, including control groups from other studies. Each point represents an individual mouse. Triangles indicate mice received artificial sweeteners in their drinking water for 14 days prior to ID8 injection. Significance was tested by an ordinary one-way ANOVA, with the Šidák multiple comparison test on selected pairs. I, Mean doubling times of HGS2 lentivirus–transduced clones grown for 72 hours in the same conditions as in C. Each circle represents an average of two technical replicates from one passage, with nine images taken per well. Clones E1, F6, and F8 were transduced with control GFP lentivirus, and clones C9, E11, and F3 were transduced with Pten GFP lentivirus. Significance was tested by an ordinary one-way ANOVA, with the Tukey multiple comparison test. J, HGS2 subclones were grown in low-attachment u-bottomed plates for 90 hours. Each symbol represents the average of technical triplicates per subclone, performed at a different passage. The largest brightfield object area (μm2) per image was quantified and is shown over time. K, HGS2 parental cells, control lentivirus, or Pten lentivirus–transduced subclones were injected intraperitoneally into mice, and omental tumors were harvested. Each symbol represents an individual mouse. Omental tumor weights are shown when harvested on days 56 (white) or 59 (filled). Control lentivirus clones F6 (triangle) and F8 (circle), and Pten lentivirus clones C9 (triangle), E11 (circle), and F3 (square). Significance was tested by one-way ANOVA, with the Šidák multiple comparisons test. In all experiments, results are considered significant when P < 0.05. ns, not significant.
Figure 2.
Figure 2.
Pten-null tumor cells enhance the accumulation of resident-like macrophages within the omentum. A–C, Mice were injected with either ID8 Trp53−/− (F3) or Trp53−/−;Pten−/− (Pten1.14) cells. Peritoneal fluid and omenta were harvested 1, 2, 7, and 14 days later. Flow cytometry was performed for indicated cell populations. Counting beads were used to estimate absolute cell numbers, normalized to either the total lavage fluid (mL) or per omentum. A, Gating strategy for monocytes: Zombie Yellow, CD45+, CD11b+, Ly6Chi. B and C, Macrophages: Zombie Yellow, CD45+, CD11b+, Ly6C, Ly6G, SiglecF, F4/80lo, MHCIIhi (monocyte-derived; B), or F4/80hi, MHCIIlo (resident-like; C). Every data point represents an individual mouse. Statistical significance was tested using a one-way ANOVA with the Šidák multiple comparison test on selected samples. D–F, Mice were injected with individual ID8 Trp53−/− (F3, C7, and M20) or Trp53−/−;Pten−/− clones (Pten1.12, Pten1.14, and Pten1.15) on day 0 and omental tumors harvested at day 28 for flow cytometry. D, Resident macrophages were defined as Zombie Yellow, CD45+, CD11b+, Ly6C, Ly6G, SiglecF, F4/80hi, and MHCIIlo and normalized to omental tumor weight (mg). E, Representative gating strategy used to define TIM4+ cells within the F4/80hiMHCIIlo population. F, Quantification of percentage of TIM4+ cells out of total F4/80hiMHCIIlo macrophages. Statistical significance was tested using a one-way ANOVA, with the Šidák multiple comparison test on selected samples. G, Mice were injected with ID8 Trp53−/− (F3), Trp53−/−;Pten−/− (Pten1.14), Trp53−/−;Brca2−/− (Brca2 2.14), or Trp53−/−;Brca2−/−;Pten−/− (Brca2.14 Pten22) clones and the number of resident macrophages quantified by flow cytometry as in D. H, Density of monocyte-derived, defined as Zombie Yellow, CD45+, CD11b+, Ly6C, Ly6G, SiglecF, F4/80lo, and MHCIIhi cells in omental tumors of same mice as in D. I, Density of T cells, defined as Zombie Yellow, CD45+, and CD3+ in omental tumors of same mice as in D. J, Density of monocyte-derived, defined as Zombie Yellow, CD45+, CD11b+, Ly6C, Ly6G, SiglecF, F4/80lo, and MHCIIhi cells in omental tumors of same mice as in G. K, Density of T cells, defined as Zombie Yellow, CD45+, and CD3+ in omental tumors of same mice as in G. L, CEL (n = 6 mice) or PBS (n = 3) were injected intraperitoneally into mice on −14, −7, and −1 days prior to Trp53−/−;Pten−/− (Pten1.12) tumor-cell injection. CEL or PBS was then administered on days +7, +14, +21. Mice were harvested on day 26 (circles), apart from one PBS-treated mouse that reached the endpoint at day 23 (triangle), and the omental tumor weight (mg) and ascites fluid volume (mL) were analyzed. Statistical significance was tested using an unpaired t test. M,Ccr2+/+, Ccr2RFP/+, Ccr2RFP/RFP (clear symbols), or in-house wild-type (filled symbols) age-matched mice were injected with either Trp53−/− (F3) or Trp53−/−;Pten−/− (Pten1.14) ID8 cells on day 0 and culled on day 28. Omental tumor weight (mg) and ascites fluid volume (mL) were measured. Statistical significance was tested using a one-way ANOVA, with the Šidák multiple comparison test on selected samples (omental tumors) or with the Tukey multiple comparison test (ascites). In all experiments, results are considered significant when P < 0.05.
Figure 3.
Figure 3.
Pten-null tumors drive accelerated formation of unique HMOX1hi macrophage subpopulation. A, Mice were injected with ID8 Trp53−/− (F3) or Trp53−/−;Pten−/− (Pten1.14) ID8 cells on day 0 and omental tumors harvested at day 28, with n = 4 mice per genotype. Macrophages were single-cell flow-sorted based on DAPI (live), CD45+, CD11b+, Dump (CD3, CD19, and Gr1), SiglecF, F4/80+MHCII+, singlets, and analyzed by plate-based SMART-Seq2 scRNA-seq. Following quality filtering, a Uniform Manifold Approximation and Projection (UMAP) of macrophages is shown, using the Seurat pipeline. Selected significantly DEGs (defined as adjusted P value < 0.05 and average log2-fold change >0) are shown next to the respective cluster. Total DEGs per cluster are 1,022 genes (cluster 0); 59 genes (cluster 1); 425 genes (cluster 2); 141 genes (cluster 3); and 1,625 genes (cluster 4). B, The percentage of macrophages identified in each cluster isolated from either ID8 Trp53−/− or Trp53−/−;Pten−/− omental tumors from A is shown. C, The expression of F4/80 and MHCII per macrophages, as collected during index sorting is shown with cluster identity overlaid by color. D, Data in A were reanalyzed using the Monocle 3 package and Pseudotime analysis applied (shown as heatmap), with the root node placed in cluster 0. E, Mice were injected with ID8 Trp53−/− or Trp53−/−;Pten−/− ID8 cells on day 0 and omental tumors harvested at early (day 28, Trp53−/−; day 21, Trp53−/−;Pten−/−, “E”) and late (day 47, Trp53−/−; day 28, Trp53−/−;Pten−/−, “L”) time points. The density of macrophages in omental tumors was calculated for F4/80+MHCII+, CX3CR1+MHCIIhiCD86+CD11c+. Statistical significance was tested by one-way ANOVA and Tukey multiple comparison test. F, As in E, the density of macrophages in omental tumors was calculated for F4/80+MHCII+, LYVE1CD102+TIM4+. Statistical significance was tested by one-way ANOVA and Tukey multiple comparison test. G, As in E, the density of macrophages in omental tumors was calculated for F4/80+MHCII+, LYVE1CD102TIM4Arginase1+PD-L1+. Statistical significance was tested by one-way ANOVA and Tukey multiple comparison test. H, As in E, the density of macrophages in omental tumors was calculated for F4/80+MHCII+, HMOX1hi. Statistical significance was tested by one-way ANOVA and Tukey multiple comparison test. I, ID8 Trp53−/− (F3) or Trp53−/−;Pten−/− (Pten1.14) omental tumors harvested at day 28 were stained for HMOX1 by IHC. The number of HMOX1hi cells was quantified using QuPath. Statistical significance was tested using an unpaired t test. J, Representative IHC images of HMOX1 (brown stain) from Trp53−/− and Trp53−/−;Pten−/− tumors from I are shown. Scale bar is indicated in the image. K, HMOX1GFP mice (n = 2) were injected with ID8 Trp53−/−;Pten−/− (Pten1.14) cells on day 0, and omental tumors harvested at day 25. Representative histogram of HMOX1GFP expression is shown per cell population. The CD45 population will contain transgenic stromal cells as well as the GFP ID8 cells. L, Left, gating strategy used to define cluster 2; F4/80+MHCII+, LYVE1, CD11c, MHCIIlo, CD102, F4/80lo, HMOX1hi, arginase1+, and PD-L1+. Right, density of cluster 2 macrophages in day 28 ID8 Trp53−/− (F3) or Trp53−/−;Pten−/− (Pten1.14) tumors. Statistical significance was tested using an unpaired t test. In all experiments, results are considered significant when P < 0.05.
Figure 4.
Figure 4.
HMOX1hi macrophages are partially derived from resident peritoneal fluid macrophages. A, CD45.2 mice were injected with ID8 Trp53−/− (F3) or Trp53−/−;Pten−/− (Pten1.14) cells on day 0 (n = 6 per group). Mice then received an AT of CD45.1 peritoneal fluid cells on either day 1 (n = 3) or day 13 (n = 3 for F3 and n = 2 for Pten1.14) after ID8 intraperitoneal injection. Tumors and ascites were harvested at day 28. One mouse was excluded as there were insufficient cells and thus became a negative control. Representative flow cytometry gating strategy for live CD45.1 and CD45.2 cells in omental tumors. An FMO-CD45.1 control and no AT control are also shown. B, The omental tumors from A were analyzed by flow cytometry. The percentage of resident F4/80hiMHCIIlo macrophages of all CD45.1 cells in omental tumor (left) and ascites (middle) are shown for mice that received CD45.1 AT 24 hours post ID8 injection. The percentage of TIM4+ out of F4/80hiMHCIIloCD45.1+ macrophages in omental tumors is also shown (right). One mouse had no detectable F4/80hiMHCIIlo macrophages, therefore the %TIM4+ value was not able to be analyzed. Black values are from ID8 Trp53−/− (F3)-injected mice and pink are from Trp53−/−;Pten−/− (Pten1.14)-injected mice. Statistical significance was tested by the unpaired t test. C, The omental tumors from A were analyzed by flow cytometry. The percentage of resident F4/80hiMHCIIlo macrophages of all CD45.1 cells in the omental tumor (left) and ascites (middle) are shown for mice that received CD45.1 AT 13 days post ID8 injection. The percentage of TIM4+ out of F4/80hiMHCIIloCD45.1+ macrophages in omental tumors is also shown (right). Black values are from ID8 Trp53−/− (F3)-injected mice and pink are from Trp53−/−;Pten−/− (Pten1.14)-injected mice. Statistical significance was tested by the unpaired t test. D, F4/80hi CD102+ peritoneal macrophages were FACS sorted from healthy Hmox1GFP mice and AT into Hmox1wt littermates bearing ID8 Trp53−/−;Pten−/− (Pten1.14) tumors on day 21. Omental tumors and ascites were harvested on day 28. E, Representative FACS plot of GFP+ cells in the CD45+ live gated cells in an omental tumor. The relative fluorescence of GFP+ cells (green) compared with GFP cells (gray) is shown for markers CD11b, MHCII, CD11c, CD102, arginase1, and PD-L1. F, Macrophages were gated as previously, and the percentage of cells within each gate out of total detected GFP+ cells is shown. G, The percentage of each macrophage population gated within GFP+ (green) or GFP (gray) cells that is positive for arginase1. H, The percentage of each macrophage population gated within GFP+ (green) or GFP (gray) cells that is positive for PD-L1. In all experiments, results are considered significant when P < 0.05. ns, not significant.
Figure 5.
Figure 5.
HMOX1 inhibition extends the survival in mice bearing Pten-null ID8 tumors. A, Mice were injected with ID8 Trp53−/− (F3) or Trp53−/−;Pten−/− (Pten1.14) cells on day 0. From day 14, mice received 25 μmol/kg SnMP (n = 6) or vehicle control (n = 6) daily for 14 days. Omental tumors were harvested on day 28 and analyzed by flow cytometry. The density of CD11c+MHCIIhi macrophages in the omental tumors is shown. Statistical significance was tested using one-way ANOVA and with the Šidák multiple comparisons test with selected comparisons. B, The density of CD102+F4/80hi macrophages from A is shown per mg omental tumor. Statistical significance was tested using one-way ANOVA and Šidák multiple comparisons test, with selected comparisons. C, The density of Arginase1+PD-L1+HMOX1+ macrophages from A is shown per mg omental tumor. Statistical significance was tested using one-way ANOVA and Šidák multiple comparisons test, with selected comparisons. D, The density of LYVE1+ macrophages from A is shown per mg omental tumor. Statistical significance was tested using one-way ANOVA and Tukey multiple comparison test. E, The ascites volume from A. Statistical significance was tested using one-way ANOVA and Šidák multiple comparisons test, with selected comparisons. F, Mice were injected with ID8 Trp53−/−;Pten−/− (Pten1.14) cells on day 0. From day 14, mice received 25 μmol/kg SnMP (n = 9) or vehicle control (n = 9) daily on 5 days on/2 days off schedule until mice were harvested reached the humane endpoint, which included advanced abdominal swelling. One mouse was censored in the SnMP group as it was killed before reaching the endpoint at the end of the study (day 42); it had minimal disease present. Statistical significance was tested using a logrank (Mantel–COX) test. G, Volcano plot depicting log2-normalized fold change and FDR-adjusted P values for gene expression differences between Trp53−/−;Pten−/− and Trp53−/− ID8 cells. Cluster 2 activators are individually labeled. H, List of cluster 2 activators and inhibitors as identified through the IPA analysis. I, Venn diagram showing the overlap of genes upregulated in Trp53−/−;Pten−/− cells and genes that are predicted to activate cluster 2 genes identified through the IPA analysis. Among these 25 predicted activators, 16 were found common among the genes upregulated in Trp53−/−;Pten−/− bulk RNA-seq analysis. J, Bicycle wheel diagram showing the 29 genes expressed by cluster 2 macrophages that are activated or inhibited by Il33, identified through the IPA analysis. K,Il33 gene (left) and IL33 protein expression (right) in ID8 clones. Each data point represents a clone. Clones plated as follows: Trp53−/− ID8-F3 (circle), ID8-M20 (square), ID8-C7 (triangle) and Trp53−/−;Pten−/−, ID8-F3; Pten1.12 (square) ID8-F3; Pten1.14 (circle), ID8-F3;Pten1.15 (triangle). Significance was tested by an unpaired t test. L, Peritoneal fluid macrophages were cultured in vitro for 24 hours in the presence of 50-ng/mL recombinant IL33 protein or untreated media control. Hmox1 gene expression was then assessed. In all experiments, results are considered significant when P < 0.05. ns, not significant.
Figure 6.
Figure 6.
Mouse and human HMOX1hi macrophages share common characteristics in HGSC. A, Scaled and centered HMOX1 expression on tumor-associated macrophages. Macrophages with a scaled HMOX1 expression above one SD from the mean were defined as HMOX1hi. Macrophages with a scaled HMOX1 expression below one SD from the mean were defined as HMOX1lo. B, The overlap between DEG found in human HMOX1hi macrophages and DEG found in each mouse macrophage cluster 0–4 is shown. C, DEG in HMOX1hi macrophages (right side of the volcano plot) and HMOX1lo macrophages (left side) defined in A from human HGSC tumors is shown. D, Comparison of MSigDB pathway enrichment in human HMOX1hi macrophages and mouse cluster 2 macrophages showing selected pathways of interest that were significantly enriched (Hallmark, Gene Ontology, and KEGG).
Figure 7.
Figure 7.
A high proportion of HMOX1hi macrophages is associated with poor OS and PI3K signaling pathway activation. A, MSigDB enrichment analysis (Hallmark, Gene Ontology, and KEGG) of HGSC tumors with high versus low proportion of HMOX1hi macrophages showing selected pathways of interest that were significantly enriched (left) or downregulated (right). Pathways relating to PI3K signaling are highlighted in red. B, CD68 (top left) and HMOX1 (top right) IHC staining in the BriTROC-1 study tissue microarray. QuPath positive cell detection is shown (red) for CD68 (bottom left) and HMOX1 (bottom right). Scale bar, 200 µm. C, Spearman correlation between the proportion of HMOX1hi macrophages and the proportion of CD68+ macrophages found in BriTROC-1 tissue microarray cores. D,pAKT staining in the BriTROC-1 study with (left) and without (right) the QuPath tumor classifier showing weak (1+), moderate (2+), and strong (3+) staining. E, Spearman correlation between pAKT tumor H-score and the average proportion of HMOX1hi macrophages per patient in the BriTROC-1 study. F, OS of patients in the BriTROC-1 study with high (n = 76) and low (n = 50) proportion of HMOX1hi, in which the cutoff is based on the optimal threshold. Statistical comparison was performed using the log-rank test. G, Multivariate regression forest plot of HMOX1hi expression.

References

    1. Ray-Coquard I, Pautier P, Pignata S, Pérol D, González-Martín A, Berger R, et al. . Olaparib plus bevacizumab as first-line maintenance in ovarian cancer. N Engl J Med 2019;381:2416–28. - PubMed
    1. Zhang L, Conejo-Garcia JR, Katsaros D, Gimotty PA, Massobrio M, Regnani G, et al. . Intratumoral T cells, recurrence, and survival in epithelial ovarian cancer. N Engl J Med 2003;348:203–13. - PubMed
    1. Goode EL, Block MS, Kalli KR, Vierkant RA, Chen W, Fogarty ZC, et al. ; Ovarian Tumor Tissue Analysis (OTTA) Consortium . Dose-response association of CD8+ tumor-infiltrating lymphocytes and survival time in high-grade serous ovarian cancer. JAMA Oncol 2017;3:e173290. - PMC - PubMed
    1. Cancer Genome Atlas Research Network . Integrated genomic analyses of ovarian carcinoma. Nature 2011;474:609–15. - PMC - PubMed
    1. Sato E, Olson SH, Ahn J, Bundy B, Nishikawa H, Qian F, et al. . Intraepithelial CD8+ tumor-infiltrating lymphocytes and a high CD8+/regulatory T cell ratio are associated with favorable prognosis in ovarian cancer. Proc Natl Acad Sci U S A 2005;102:18538–43. - PMC - PubMed

MeSH terms