Review
. 2024 Sep;66(7):372-380.
doi: 10.1111/dgd.12940. Epub 2024 Aug 26.

Development of specialized devices for microbial experimental evolution

Affiliations
Review

Development of specialized devices for microbial experimental evolution

Atsushi Shibai et al. Dev Growth Differ. 2024 Sep.

Abstract

Experimental evolution of microbial cells provides valuable information on evolutionary dynamics, such as mutations that contribute to fitness gain under given selection pressures. Although experimental evolution is a promising tool in evolutionary biology and bioengineering, long-term culture experiments under multiple environmental conditions often impose an excessive workload on researchers. Therefore, the development of automated systems significantly contributes to the advancement of experimental evolutionary research. This review presents several specialized devices designed for experimental evolution studies, such as an automated system for high-throughput culture experiments, a culture device that generate a temperature gradient, and an automated ultraviolet (UV) irradiation culture device. The ongoing development of such specialized devices is poised to continually expand new frontiers in experimental evolution research.

Keywords: automation; experimental evolution; microorganisms; temperature control; ultraviolet irradiation.


Conflict of interest statement

The authors declare no competing interests.

Figures
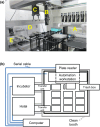
FIGURE 1
FIGURE 1
Automated culture systems for experimental evolution. (a) System appearance. Yellow characters indicate A: microplate reader, B: pipetting arm, C: manipulator arm, D: incubator, and E: microplate hotel. (b) Schematic representation of system integration. The instruments were connected to a computer using serial cables and were controlled by a computer. The panels were adapted from the figures presented in Horinouchi et al. (2014).
FIGURE 2
FIGURE 2
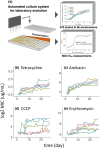
Time series of minimum inhibitory concentration (MIC) during the experimental evolution of E. coli. (a) The experimental procedure, adapted from Maeda et al. (2020). In this experimental evolution, the cells were cultured with the concentration gradient of the selection drug. Then, every 24 hr, the cells were transferred from a well with the highest drug concentration at which cells could grow. The adaptive evolution under (b) tetracycline, (c) amikacin, (d) carbonyl cyanide 3‐chlorophenylhydrazone (CCCP), and (e) erythromycin are presented as examples. The color in the line represents different culture series. See Maeda et al. (2020) for details of the experiments.
FIGURE 3
FIGURE 3
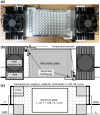
Overview of the temperature gradient devices. (a) System appearance. The device holds a microtiter plate at the center. (b) The device has two temperature sensors at the corners of the microtiter plate. The heat control units on both sides are covered with heat radiation fins and fans. (c) Four Peltier elements are attached to the four corners of the flat aluminum bar. A slightly thicker aluminum plate at the center touches the bottom of the microtiter plate. The panels are adapted from figures presented in Shibai, Kotani, Kawada, et al. (2022).
FIGURE 4
FIGURE 4
Culture experiments of E. coli under temperature gradients. (a) The temperature of water in each well of the 96‐well microtiter plate on the temperature gradient device. The black squares indicate wells at which a thermometer measured temperatures, while a linear interpolation estimated the temperatures of other wells. (b) A schematic representation of the methods for experimental evolution under a high‐temperature stress environment. E. coli cells were inoculated and cultured under a temperature gradient. After 24 hr of cultivation, the cells were transferred to the next round from a well with the highest temperature at which cells could grow. (c) The change of temperatures at which cells were transferred. In this experimental evolution, a hypermutator of E. coli (MDS42ΔmutS) was used as a parent strain. The lines represent the temperature change in eight replica experiments. (d) Growth analysis of E. coli under a two‐dimensional gradient of temperature and antibiotics concentration. The bar height represents the cell density of E. coli after 24 hr of cultivation, and the color represents the culture temperature. Seven of the eight rows were used for the concentration gradient of kanamycin, and the remaining row was used for the drug‐free condition. This two‐dimensional assay data is a result of a single experiment (i.e., n = 1). The panels are adapted from figures presented in Shibai, Kotani, Kawada, et al. (2022).
FIGURE 5
FIGURE 5
Automated UV irradiation device. (a) Schematic representation of the device. Cells in a quartz test tube are exposed to UV irradiation from the bottom while a phototransistor measures the OD. (b) Control flowchart for the automated UV irradiation. UV irradiation is switched on for a defined time if the OD exceeds the threshold (ODTHR). This threshold is updated by adding a given OD increment (ODSTEP). (c) A schematic growth curve (solid black line) obtained from this device. Cellular growth is interrupted by UV irradiation (black lightning symbols) when the OD exceeds ODTHR (horizontal dashed line). The expected growth curve of the surviving fraction (gray line) explains the stepwise growth curve. The panels are adapted from figures presented in Shibai et al. (2019).

References

    1. Arnold, F. H. , & Volkov, A. A. (1999). Directed evolution of biocatalysts. Current Opinion in Chemical Biology, 3(1), 54–59. 10.1016/s1367-5931(99)80010-6 - DOI - PubMed
    1. Arsène, F. , Tomoyasu, T. , & Bukau, B. (2000). The heat shock response of Escherichia coli. International Journal of Food Microbiology, 55(1–3), 3–9. 10.1016/s0168-1605(00)00206-3 - DOI - PubMed
    1. Baym, M. , Lieberman, T. D. , Kelsic, E. D. , Chait, R. , Gross, R. , Yelin, I. , & Kishony, R. (2016). Spatiotemporal microbial evolution on antibiotic landscapes. Science, 353(6304), 1147–1151. 10.1126/science.aag0822 - DOI - PMC - PubMed
    1. Bertaux, F. , Sosa‐Carrillo, S. , Gross, V. , Fraisse, A. , Aditya, C. , Furstenheim, M. , & Batt, G. (2022). Enhancing bioreactor arrays for automated measurements and reactive control with ReacSight. Nature Communications, 13(1), 3363. 10.1038/s41467-022-31033-9 - DOI - PMC - PubMed
    1. Blanchard, K. , Robic, S. , & Matsumura, I. (2014). Transformable facultative thermophile Geobacillus stearothermophilus NUB3621 as a host strain for metabolic engineering. Applied Microbiology and Biotechnology, 98(15), 6715–6723. 10.1007/s00253-014-5746-z - DOI - PMC - PubMed

LinkOut - more resources