. 2024 Aug 26;15(1):7225.
doi: 10.1038/s41467-024-51535-y.

A single-dose intranasal live-attenuated codon deoptimized vaccine provides broad protection against SARS-CoV-2 and its variants

Affiliations

A single-dose intranasal live-attenuated codon deoptimized vaccine provides broad protection against SARS-CoV-2 and its variants

Xiang Liu et al. Nat Commun. .

Abstract

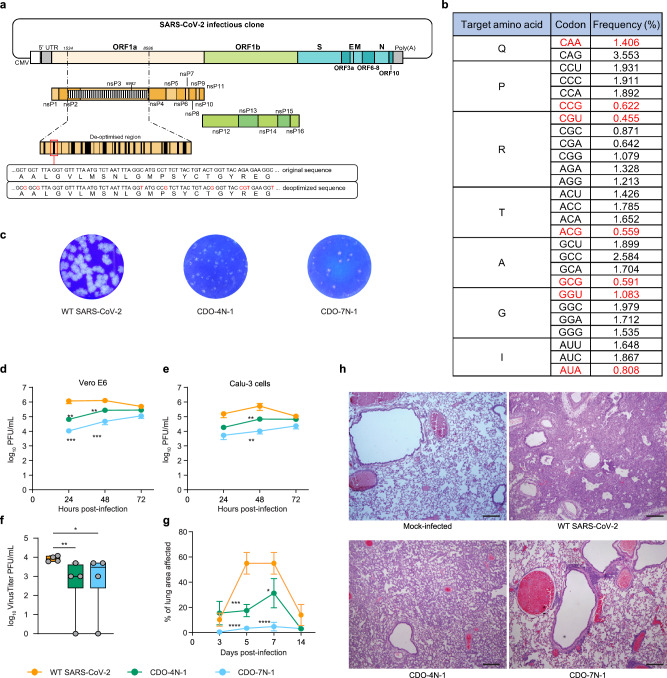
Severe acute respiratory syndrome coronavirus 2 (SARS-CoV-2, COVID-19) continues its significant health and economic impact globally. Despite the success of spike-protein vaccines in preventing severe disease, long-lasting protection against emerging variants and the prevention of breakthrough infections and transmission remain elusive. We generate an intranasal live-attenuated SARS-CoV-2 vaccine, CDO-7N-1, using codon deoptimization. CDO-7N-1 shows highly attenuated replication and minimal or no lung pathology in vivo over multiple passages. It induces robust mucosal and systemic neutralizing antibody and T-cell subset responses, in mice (female K18-hACE2 and male HFH4-hACE2 mice), hamsters, and macaques triggered by a single immunization. Mice and hamsters vaccinated with CDO-7N-1 are protected from challenge with wild-type (WT) SARS-CoV-2 and other variants of concern. Serum from vaccinated animals neutralizes WT SARS-CoV-2, variants of concern (beta and delta), variants of interest (omicron XBB.1.5) and SARS-CoV-1. Antibody responses are sustained and enhanced by repeated immunization or infection with WT SARS-CoV-2. Immunity against all SARS-CoV-2 proteins by CDO-7N-1 should improve efficacy against future SARS-CoV-2 variants.


Conflict of interest statement

Suresh Mahalingam, Xiang Liu, and Andres Merits are inventors of the live-attenuated SARS-CoV-2 vaccine CDO-7N-1, which has been licensed to Indian Immunologicals Ltd for further development. The study was funded by Indian Immunologicals Ltd. Venugopal Yerragunta, Shukra Madhaha Aavula, Sambaiah Gorriparthi, Santhakumar Ponsekaran, Rama Lakshmi Bonda, Priyanka Mani, Sridevi V. Nimmagadda, Priyabrata Pattnaik, Anand Kumar Kanakasapapathy, and Rajendra Lingala are employees of Indian Immunologicals Ltd. The remaining authors declare no competing interests.

Figures

Fig. 1
Fig. 1. Attenuation design for CDO-7N-1.
a Schematic diagram for WT SARS-CoV-2 reverse genetic infectious clone and codon deoptimization design. Examples of mutated nucleotides are indicated in red. CMV, cytomegalovirus promotor; S, spike protein gene; N nucleocapsid gene, E, envelope glycoprotein gene; M membrane glycoprotein gene; UTR, untranslated region. b Homo sapiens codon usage frequency table (DNA HIVE, dnahive.fda.gov). The synonymous codons of each target amino acid (Q, glutamine; I, isoleucine; P, proline; R, arginine; T, threonine; A, alanine; G, glycine) were changed to the corresponding codon with the lowest frequency indicated in red. ce Plaque morphologies and growth kinetics of WT SARS-CoV-2, CDO-4N-1 and CDO-7N-1. Vero E6 or Calu-3 cells were infected with the respective viruses at an MOI of 0.1. The virus titers in the culture media were determined by plaque assay. Values are expressed as the mean ± standard error of the mean (SEM) from three independent experiments. **P < 0.01 and ***P < 0.001 using two-way ANOVA with Bonferroni’s post hoc test. f Six- to eight-week-old Golden Syrian hamsters were infected i.n. with WT SARS-CoV-2, CDO-4N-1 or CDO-7N-1 at 105 PFU in a volume of 50 µL. BALF was collected at 3 days p.i. for plaque assay analysis. Dots represent individual animals (n = 4). Data are presented as box and whisker ± SD with the median indicated by a line across the box, maximum to minimum points from two independent experiments. *P < 0.05 and **P < 0.01 using one-way ANOVA with Fisher’s LSD post hoc test. g, h Lung tissue was collected from the infected hamsters at 7 dpi for histopathology analysis using hematoxylin and eosin (H&E) staining. Stained histologic sections of all the tissues collected from all the hamsters were examined using a light microscope (Model-E600, Make-NIKON), and observations were recorded by veterinary pathologist as per the applicable Test Site’s SOPs. Values are expressed as the mean ± SEM from two independent experiments. *P < 0.05, ***P < 0.001, and ****P < 0.0001 using two-way ANOVA with Bonferroni’s post hoc test.
Fig. 2
Fig. 2. Immunogenicity of CDO-7N-1 in hamsters.
Six- to eight-week-old Golden Syrian hamsters were inoculated with PBS or 105 PFU CDO-7N-1 i.n. in a volume of 50 µL. Serum was collected at day 12, 20, 40, 75 and 90 post-immunization for (a) PRNT assay (PRNT90) against WT SARS-CoV-2 and ELISAs targeting anti-spike protein S1 (b), S2 (c), RBD (d) and N protein (e) IgG. Dotted horizontal lines indicate the detection limit. Dots represent individual animals (n = 12, 24 and 6 for PBS, 12-day CDO-7N-1 and 20/40/75/90-day CDO-7N-1, respectively). Data are presented as box and whisker ± SD with the median indicated by a line across the box, maximum to minimum points from three independent experiments. **P < 0.01, ****P < 0.0001 using two-tailed unpaired Mann‒Whitney U test. At day 28 post-immunization, hamsters were challenged with 105 PFU WT-SARS-CoV-2 i.n in a volume of 50 µL. At day 5 post challenge (33 days post-immunization), nose (f, p = 0.1667, not significant) and BALF (g, p = 0.1667, not significant) were collected for plaque assay analysis. Nasal turbinate and lungs were collected for H&E analysis (h). Scale bar in panel = 100 µm. i Hamsters were inoculated with PBS, or 105 PFU CDO-7N-1 as described in (a). A second and third inoculation of 105 PFU CDO-7N-1 was given at 23 and 33 days post-initial inoculation. Serum was collected at various time points extending over more than one year for PRNT assay (PRNT90) against WT SARS-CoV-2. jn Hamsters were inoculated intranasally with PBS or 105 PFU CDO-7N-1, and serum samples were collected on day 28 post-immunization (pre-challenge); followed by intranasal challenged with 105 PFU of WT-SARS-CoV-2. Serum samples were then collected on day 5 post-challenge (33 days post-immunization). The samples were used for PRNT assay against WT SARS-CoV-2 (j) and ELISAs targeting anti-spike proteins S1 (k), S2 (l), RBD (m), and N protein (n) IgG. Dotted horizontal lines indicate the detection limit. Dots represent individual animals (panels f, g, n = 5 and 4 for PBS and CDO-7N-1; panel i, n = 24 for PBS, for CDO-7N-1: day 12 n = 21, day 25, n = 23, day 35, n = 22, day 180, n = 10, day 259, n = 18, day 367, n = 9; panels jn, n = 4). Data are presented as box and whisker ± SD with the median indicated by a line across the box, maximum to minimum points from three independent experiments. *P < 0.05; ns, not significant using two-tailed unpaired Mann‒Whitney U test.
Fig. 3
Fig. 3. Immunogenicity of CDO-7N-1 in mice post-intranasal immunization.
Seven-week-old K18-hACE2 female mice were inoculated intranasally (i.n.) with WT SARS-CoV-2 or CDO-7N-1 at 103 PFU per animal in a volume of 20 μL (ag). Mice were sacrificed at 3 and 5 days p.i., and lungs (a) and noses (b) were collected for plaque assays (n = 4). cf Mice were inoculated i.n. with CDO-7N-1 at 103 PFU per animal and sacrificed at 14 and 21 days post-immunization. Serum and BALF were collected for measurement of IgG and IgA levels using ELISA, targeting anti-spike (S1 + S2) IgG (c, d) and IgA (e, f). For panel c, n = 10; panel d, n = 8, 9 and 8 for PBS, CDO-7N-1 day 14 and CDO-7N-1 day 21, respectively; panel e and f, n = 7 and 8 for PBS and CDO-7N-1. g Serum from CDO-7N-1-inoculated mice was collected at day 14 post-immunization for the PRNT assay against WT SARS-CoV-2. Dots represent each animal (n = 4). Dotted horizontal lines indicate the detection limit. Data are presented as box and whisker ± SD with the median indicated by a line across the box, maximum to minimum points from two independent experiments. *P < 0.05; **P < 0.01; ***P < 0.001; ****P < 0.0001; ns, not significant using two-tailed unpaired Mann-Whitney U test. hn Antigen specific T cell analysis in immunized mice. Seven-week-old K18-hACE2 mice were inoculated intranasally with CDO-7N-1 at 103 PFU per animal in a volume of 20 μL. At 21 days post-immunization, lung cells were collected and labeled with CFSE. The cells were stimulated with SARS-CoV-2 S protein peptide pool, N protein peptide pool, M protein peptide pool, E protein or CD3e monoclonal antibody as a positive control (data not shown) and labeled with anti-mouse fluorochrome-conjugated monoclonal antibodies against mouse CD45, CD3, CD4 and CD8. CD3 (h, i), CD4 (j, k) and CD8 (l, m) T cells in mock, S, N, M and E protein-stimulated cells were quantified using flow cytometry. (n) Levels of IFN-γ in cell culture of mock, S, N, M and E protein-treated cells was measured by ELISA. Each dot represents pooled samples from three animals. Dotted horizontal lines indicate the detection limit. For panel hn, n = 7 and 6 for PBS and CDO-7N-1. Data are presented as box and whisker ± SD with the median indicated by a line across the box, maximum to minimum points from two independent experiments. *P < 0.05; ns, not significant using two-tailed unpaired Mann-Whitney U test.
Fig. 4
Fig. 4. Protection of CDO-7N-1-immunized mice against WT SARS-CoV-2 infection.
a, b Seven-week-old female K18-hACE2 mice (n = 8, 9, 6 for PBS, PBS + WT SARS-CoV-2, and CDO-7N-1 + WT SARS-CoV-2, respectively) were immunized intranasally with 103 PFU CDO-7N-1 or mock-immunized with PBS in a volume of 20 μL. The mice were challenged with 104 PFU WT SARS-CoV-2 on day 21 post-immunization. Mouse weight (a) and disease (b) were monitored daily. The animal weight is presented as the percentage change relative to day zero post-challenge. The disease development was presented as the percentage of animals showing signs of disease. The severity of the disease was scored numerically in an ascending order from zero to 13. All values represent the mean ± SEM from two independent experiments. **, P < 0.01; ****, P < 0.0001 using two-way ANOVA with Bonferroni’s post hoc test. cf WT SARS-CoV-2 viral loads in the immunized and challenged mice. The mice were sacrificed at day 7 post-challenge (28 days post-immunization), and lung (c, d) and brain (e, f) tissues were collected to determine virus titers and viral genome copy numbers using plaque assay and probe-based RT‒qPCR. The detection limit of the plaque assay is indicated with dotted horizontal lines. Dots represent individual animals. For panel c, n = 7; panel d, n = 10 and 8 for PBS + WT SARS-CoV-2 and CDO-7N-1 + WT SARS-CoV-2; panel e and f, n = 19 and 15 for PBS + WT SARS-CoV-2 and CDO-7N-1 + WT SARS-CoV-2. Data are presented as box and whisker ± SD with the median indicated by a line across the box, maximum to minimum points from two independent experiments. ***P < 0.001; ****P < 0.0001 using two-tailed unpaired Mann‒Whitney U test. (g, h) Histopathological changes in the lungs of immunized and challenged mice. The mice were sacrificed at day 7 post-challenge (28 days post-immunization), and lung tissues were collected for H&E staining (g). Four mice in each group (#1-4) were selected to represent the group. Three sections per tissue was used for cell infiltrates statistical analysis using ImageScope (h). For (h), dots represent individual tissue sections (n = 27, 21, and 21 for PBS, PBS + WT SARS-CoV-2, and CDO-7N-1 + WT SARS-CoV-2, respectively). Data are presented as box and whisker ± SD with the median indicated by a line across the box, maximum to minimum points from two independent experiments. *P < 0.05; ***P < 0.001; ns, not significant using one-way ANOVA with Tukey’s post hoc test.
Fig. 5
Fig. 5. Protection of CDO-7N-1 immunized mice against infection with the Beta, Delta and Omicron SARS-CoV-2 variants of interest (VOI).
Seven-week-old female K18-hACE2 mice were immunized intranasally with 103 PFU CDO-7N-1 or mock-immunized with PBS in a volume of 20 μL. The mice were challenged with 104 PFU beta, delta or omicron variants of SARS-CoV-2 on day 21 post-immunization. (ag; hn) Protection against beta and delta variants of SARS-CoV-2. Mouse weight (a, h) and disease (b, i) were monitored daily. The animal weight is presented as the percentage change relative to day zero post-challenge. The disease development was presented as the percentage of animals showing signs of disease. All values represent the mean ± SEM from two independent experiments. ****, P < 0.0001 using two-way ANOVA with Bonferroni’s post hoc test. Nose (c, j), lung (d, k) and brain (e, l) tissues were collected at day 7 post-challenge. Virus titers were determined by plaque assay. Lung tissues from the immunized and challenged mice were collected for H&E staining [f, g (p = 0.9177, not significant), m, n]. Four mice in each group (#1–4) were selected to represent the group. (o, p = 0.1333, not significant) Protection against the omicron variant of SARS-CoV-2 in mice. Viral titers in lung tissue were determined at day 6 post-challenge by plaque assay. (p, q) Seven-week-old K18-hACE2 female mice were inoculated with PBS or CDO-7N-1 as described above. Serum from the inoculated mice was collected at 14 post-immunization for the PRNT assay against beta and delta variants of SARS-CoV-2. (r, s) Six- to eight-year-old Golden Syrian hamsters were inoculated with PBS or 105 PFU CDO-7N-1 intranasally in a volume of 50 µL. Serum was collected at 14 post-immunization for the PRNT assay against SARS-CoV-2-XBB.1.5 (r) or SARS-CoV-1 (s). Dotted lines indicate the detection limit. For panel (ce, jl, os), dots represent individual animals. For panel (g, n), dots represent individual tissue sections. For panel a, n = 6 and 5 for PBS + Beta and CDO-7N-1 + Beta; panel c, n = 6 and 10 for PBS + Beta and CDO-7N-1 + Beta; panel d and e, n = 5; panel g, n = 11 and 10 for PBS + Beta and CDO-7N-1 + Beta; panel h, n = 6 and 5 for PBS + Delta and CDO-7N-1 + Delta; panel j, n = 6 and 10 for PBS + Delta and CDO-7N-1 + Delta; panel k and l, n = 5; panel n, n = 16; panel o, n = 4 and 6 for PBS + Omicron and CDO-7N-1 + Omicron; panel p and q, n = 4; panel r and s, n = 5. Data are presented as box and whisker ± SD with the median indicated by a line across the box, maximum to minimum points from two independent experiments. *P < 0.05; **P < 0.01; ***P < 0.001; ****P < 0.0001; ns, not significant using two-tailed unpaired Mann‒Whitney U test.
Fig. 6
Fig. 6. Immunogenicity of CDO-7N-1 in cynomolgus macaques post-intranasal immunization.
Cynomolgus macaques were immunized with 105 PFU CDO-7N-1 intranasally in a volume of 250 µL in each nostril (n = 10). ad Viral RNA in the nasopharyngeal fluid (a), tracheal fluid (b), BALF (c) and rectal fluid (d) was assessed using RT‒qPCR at days 0, 3, 4, 5, 8, 11, 16 and 32 post-immunization. Dotted horizontal lines indicate the detection limit. e Histopathological changes in the lungs of unimmunized and immunized macaques. Macaques were sacrificed at two days post-immunization. The nasal mucosa, lung and masseter muscle were collected for H&E staining. Scale bar in panel = 50 µm. The images provided are representative of two macaques from the vaccine group and one macaque from the PBS group. f, g Serum samples were collected for ELISA targeting anti-spike and RBD protein IgG at 0, 2, 4 and 6 weeks post-immunization. The data in WHO International Standard (BAU/mL) is included in supplementary information (Supplementary Fig. 16a, b). h Plasma samples were collected at indicated time points for Spike specific neutralizing IgG assay. Dotted horizontal lines indicate the detection limit. Data in µg/mL for monoclonal antibody to SARS-CoV-2 Spike protein is in Supplementary Fig. 16c. i, j Nasopharyngeal fluid was collected for ELISA targeting anti-spike and RBD protein IgA at 0, 7, 15 and 31 days post-immunization. km At 0, 7, 15 and 31 days post-immunization, PBMCs were collected and stimulated with spike (k, l) protein and N protein (m) peptide pool (2 μg/mL). IFN-γ producing T cells specific for Spike protein and N protein were quantified with an Automated ELISpot Reader ELR08IFL. Data are presented for individual animals.

References

    1. Chan, J. F. et al. A familial cluster of pneumonia associated with the 2019 novel coronavirus indicating person-to-person transmission: a study of a family cluster. Lancet395, 514–523 (2020). 10.1016/S0140-6736(20)30154-9 - DOI - PMC - PubMed
    1. Zhou, P. et al. A pneumonia outbreak associated with a new coronavirus of probable bat origin. Nature579, 270–273 (2020). 10.1038/s41586-020-2012-7 - DOI - PMC - PubMed
    1. Jeong, G. U. et al. Ocular tropism of SARS-CoV-2 in animal models with retinal inflammation via neuronal invasion following intranasal inoculation. Nat. Commun.13, 7675 (2022). 10.1038/s41467-022-35225-1 - DOI - PMC - PubMed
    1. Ng, W. H. et al. Comorbidities in SARS-CoV-2 Patients: a Systematic Review and Meta-Analysis. mBio12, 10.1128/mBio.03647-20 (2021). - PMC - PubMed
    1. WHO. Weekly epidemiological update on COVID-19 – 1 September 2023, <https://www.who.int/publications/m/item/weekly-epidemiological-update-on... (2023).

MeSH terms

Supplementary concepts