. 2024 Aug 26;15(1):7337.
doi: 10.1038/s41467-024-51780-1.

Aberrant mitochondrial DNA synthesis in macrophages exacerbates inflammation and atherosclerosis

Affiliations

Aberrant mitochondrial DNA synthesis in macrophages exacerbates inflammation and atherosclerosis

Niranjana Natarajan et al. Nat Commun. .

Abstract

There is a large body of evidence that cellular metabolism governs inflammation, and that inflammation contributes to the progression of atherosclerosis. However, whether mitochondrial DNA synthesis affects macrophage function and atherosclerosis pathology is not fully understood. Here we show, by transcriptomic analyzes of plaque macrophages, spatial single cell transcriptomics of atherosclerotic plaques, and functional experiments, that mitochondrial DNA (mtDNA) synthesis in atherosclerotic plaque macrophages are triggered by vascular cell adhesion molecule 1 (VCAM-1) under inflammatory conditions in both humans and mice. Mechanistically, VCAM-1 activates C/EBPα, which binds to the promoters of key mitochondrial biogenesis genes - Cmpk2 and Pgc1a. Increased CMPK2 and PGC-1α expression triggers mtDNA synthesis, which activates STING-mediated inflammation. Consistently, atherosclerosis and inflammation are less severe in Apoe-/- mice lacking Vcam1 in macrophages. Downregulation of macrophage-specific VCAM-1 in vivo leads to decreased expression of LYZ1 and FCOR, involved in STING signalling. Finally, VCAM-1 expression in human carotid plaque macrophages correlates with necrotic core area, mitochondrial volume, and oxidative damage to DNA. Collectively, our study highlights the importance of macrophage VCAM-1 in inflammation and atherogenesis pathology and proposes a self-acerbating pathway involving increased mtDNA synthesis.


Conflict of interest statement

The authors declare no competing interests.

Figures
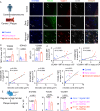
Fig. 1
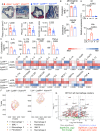
Fig. 1. VCAM-1 is highly expressed in human and mouse plaque macrophages and correlates with increases in mitochondrial volume and oxidative DNA damage.
A Tissue sections of early, and advanced plaque and control (healthy) human carotid arteries were stained with antibodies against 8OHdG (oxidative DNA damage), CD68 (macrophage), TOM20 (mitochondrial volume), and VCAM-1. scale bar= 50 µm. Representative images shown from 2 cohorts of carotid samples: 1. advanced plaque and control from endarterectomy at UPMC and 2. intermediate plaques from NDRI. B VCAM-1, 8OHdG, and TOM20 mean fluorescent intensities (MFI) in control and plaque macrophages in humans are measured, n = 9 (Control), 4 (early plaque), 6 (advanced plaque). Two-tailed t-test (Tom20), One-way ANOVA and post-hoc Fisher LSD test (8OHdG and VCAM-1). C, D Correlations among TOM20, 8-OHdG, and VCAM-1 MFI in macrophages (CD68+), n = 9 (Control), 4 (early plaque), and 6 (advanced plaque) (C), and necrotic core area and 8-OHdG, TOM20, and VCAM-1 MFI in macrophages, n = 9 (Control), 4 (early plaque), 6 (advanced plaque) (D) in human carotid plaques have been shown. The data were pooled from two independent experiments. E MFI of CD68, VCAM-1, TOM20, and 8OHdG in aortic root macrophages of female Apoe−/− mice on regular and high fat diets for 2 and 5 months have been assessed by confocal microscopy. 8-OHdG: regular diet vs. 2 months HFD, 2 months HFD vs. 5 months HFD; TOM20 regular diet vs. 2 months HFD, regular diet vs. 5 months HFD; VCAM-1: regular diet vs. 2 months HFD one-way ANOVA and post-hoc Fisher LSD. VCAM-1, regular diet vs. 2 months HFD, 2-tailed t-test. (n = 4/group). Bar graphs in 1B, E shown as mean ± SEM.
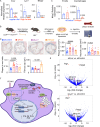
Fig. 2
Fig. 2. Macrophage VCAM-1 promotes atherogenesis.
A Representative images of Masson’s trichrome-stained aortic root sections from Apoe−/− LyzM+/+ Vcam1fl/fl and Apoe−/− LyzMcre/+ Vcam1fl/fl mice are provided. Plaque area, plaque/root ratio, and necrotic core area have been calculated (n = 9 LyzMcre/+ Vcam1fl/fl, 7 LyzM+/+ Vcam1fl/fl, all female mice used). The data were pooled from two independent experiments. Each data point represents one plaque in the aortic root, two-tailed t-test used. B Serum cholesterol levels of Apoe−/− LyzM+/+ Vcam1fl/fl and Apoe−/− LyzMcre/+ Vcam1fl/fl female mice on atherogenic diet (top panel, n = 12/group) and LyzM+/+ Vcam1fl/fl and LyzMcre/+ Vcam1fl/fl mice on regular diet (bottom panel, n = 5/group) were quantified by an enzymatic assay, two-tailed t-test used. C IL-5, IL-17A, GM-CSF, and TNF-α concentrations by Luminex were measured (n = 4,5 Vcam1+/+, n = 3 Vcam1−/−), one-tailed t-test used. D Luminex assay was used to quantify the inflammatory biomarkers in the cell culture supernatants of female LyzM+/+ Vcam1fl/fl and LyzMcre/+ Vcam1fl/fl BMDM treated with oxidized LDL (n = 3/group, one-tailed t-test p values comparing oxLDL treated LyzM+/+ Vcam1fl/fl and LyzMcre/+ Vcam1fl/fl BMDM shown). E Expression of Il6 and Ifnβ in BMDM obtained from Apoe−/− LyzM+/+ Vcam1fl/fl and Apoe−/− LyzMcre/+ Vcam1fl/fl mice was assessed (n = 5/group, one-way ANOVA with post-hoc Fisher LSD test). F Representative spatial distribution of various cell types in the aortic roots from single-cell spatial transcriptomics analysis of Ldlr−/− LysM+/+ Vcam1fl/fl and Ldlr−/− LysMcre/+ Vcam1fl/fl mice. G The volcano plot of differential gene expression in aortic macrophages of Ldlr−/− LysM+/+ Vcam1fl/fl and Ldlr−/− LysMcre/+ Vcam1fl/fl mice, data plotted as log2(fold change) vs. log10(FDR corrected P-value). n = 3/group. Bar graphs in 2A-C, E shown as mean ± SEM.
Fig. 3
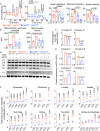
Fig. 3. Macrophage VCAM-1 upregulates mitochondrial metabolism.
A Seahorse experiments were performed to measure oxygen consumption rates (OCR), basal respiration, maximal respiration, and spare capacity in BMDM from LyzM+/+ Vcam1fl/fl and LyzMcre/+ Vcam1fl/fl treated with either native (n) or oxidized (ox) LDL (n = 10/group). The data were pooled from two independent experiments. One-way ANOVA with post-hoc Fisher LSD test was used. B Mitochondrial membrane potential and mitochondrial volume were calculated by mitotracker green and deep red staining, respectively, by flow cytometry (n = 5/group). One-way ANOVA with post-hoc Fisher LSD test was used. CE Mitochondrial complex activities by enzymatic assays (C) and mitochondrial complex levels by immunoblot (D and E, normalized to β actin) were evaluated (n = 3/group, two-tailed t-test used). F 13C glucose flux analyzes of the Krebs cycle metabolites by mass spectrometry were determined in LyzM+/+ Vcam1fl/fl and LyzMcre/+ Vcam1fl/fl BMDM (n = 3/group). The values in oxLDL-treated BMDM were normalized to those after nLDL treatment. All bar graphs shown as mean ± SEM.
Fig. 4
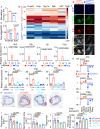
Fig. 4. VCAM-1 mediates inflammation by enhancing mtDNA synthesis.
(A-D) mtDNA levels by qPCR after oxLDL treatment (A, normalized to nLDL, n = 4/group, two-tailed t-test), mtDNA synthesis gene expression after nLDL (n) or oxLDL(ox) treatment by qPCR (B), and representative 8-OHdG, EdU, and TOM20 images after oxLDL treatment (C, scale bar: 20 µm), and 8-OHdG and EdU levels in mitochondria after oxLDL treatment by confocal microscopy (D, normalized to nLDL, n = 4/group) are shown in LyzM+/+ Vcam1fl/fl and LyzMcre/+ Vcam1fl/fl BMDM. (E) Polg was silenced in LyzM+/+ Vcam1fl/fl BMDM treated with either nLDL or oxLDL, and the pro-inflammatory genes were measured by qPCR (n = 5/group, one-way ANOVA with post-hoc Fisher LSD test). (F) Cmpk2 and Sting were silenced in LyzM+/+ Vcam1fl/fl BMDM treated with either nLDL or oxLDL, and the pro-inflammatory genes were measured by qPCR (n = 5/group, one-way ANOVA with post-hoc Fisher LSD test). (G) CMPK2 and STING were overexpressed with a lentiviral vector in THP-1 macrophages treated with either control (siControl n = 5) or VCAM1 siRNA (siVcam1 n = 3-4 no over expression, n = 4 Cmpk2 and Sting over expression), and the pro-inflammatory genes were measured by qPCR, one-way ANOVA with post-hoc Fisher LSD test used. (H-I) Polg, Cmpk2 and Pgc1a were silenced selectively in macrophages of female Ldlr−/− mice on atherogenic diet by siRNA delivery in DOTAP liposomes for 8 weeks. Representative images of Masson’s trichrome-stained aortic root sections are shown (scale bar: 200 µm). One-way ANOVA with post-hoc Fisher LSD test, n = 5/group). All bar graphs shown as mean ± SEM.
Fig. 5
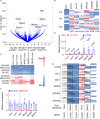
Fig. 5. VCAM-1-mediated mtDNA synthesis regulates the downstream genes.
A Female Ldlr−/− mice were lethally irradiated, transplanted with either LyzM+/+ Vcam1fl/fl or LyzMcre/+ Vcam1fl/fl bone marrow cells, and fed with a high fat diet for four months. RNA sequencing was performed with aortic macrophages isolated from these mice. The volcano plot shows the key differentially expressed genes (n = 3/group) in aortic macrophages, data plotted as log2(fold change) vs. log10(FDR corrected P-value). B The expression of the inflammatory genes after silencing the VCAM-1 downstream genes in BMDM treated with oxLDL was measured by qPCR in LyzM+/+ Vcam1fl/fl BMDM cultured in presence of either native or oxidized LDL (n = 5/group, one-tailed Mann-Whitney test). C, D The VCAM-1 downstream genes were measured after silencing Cmpk2 (C) and Polg (D). C, D: n = 5/group, one-way ANOVA with post-hoc Fisher LSD test. E CMPK2 and STING were overexpressed with a lentiviral vector in THP-1 macrophages treated with either control or VCAM1 siRNA. The VCAM-1 downstream genes were measured by qPCR (n = 5/group, two-tailed Mann-Whitney test. F The VCAM-1 downstream genes were quantified after mtDNA transfection in LyzM+/+ Vcam1fl/fl BMDM treated with oxidized LDL (n = 5/group, Two-tailed Mann-Whitney test). All bar graphs shown as mean ± SEM.
Fig. 6
Fig. 6. VCAM-1 inhibits Fcor and Lyz1 to promote atherosclerosis.
A Expression of Fcor, Lyz1, and Wisp2 in sorted aortic macrophages from Apoe−/− mice on regular and atherogenic diet was quantified by qPCR (n = 4/group, two-tailed Student’s t-test. B The experimental schematic has been shown. Female Ldlr−/− mice were lethally irradiated, transplanted with LyzMcre/+ Vcam1fl/fl bone marrow cells, and fed a high fat diet for five months. The animals were randomized into 4 groups, and siRNA (siControl, siFcor, siLyz1, and siWisp2) in DOTAP nanoparticles was administered intravenously for 8 weeks. C In vivo gene silencing by siRNA-DOTAP delivery has been validated. n = 3/group, two-tailed Student’s t-test. D The representative images and quantification of different parameters of aortic root sections of siControl, siFcor, siLyz1, and siWisp2-treated mice have been shown, scale bar: 100 μm. n = 5/group, one-way ANOVA with post-hoc Fisher LSD test. E The volcano plots depict differentially expressed genes in aortic macrophages of siFcor and siLyz1 vs. siControl-treated mice (n = 5/group), data plotted as log2(fold change) vs. log10(FDR corrected P-value). F Schematic representation of VCAM-1 signaling in macrophages is shown (Biorender). All bar graphs shown as mean ± SEM.

References

    1. Xu, T. et al. Metabolic control of T(H)17 and induced T(reg) cell balance by an epigenetic mechanism. Nature548, 228–233 (2017). 10.1038/nature23475 - DOI - PMC - PubMed
    1. O’Neill, L. A. & Pearce, E. J. Immunometabolism governs dendritic cell and macrophage function. J. Exp. Med213, 15–23 (2016). 10.1084/jem.20151570 - DOI - PMC - PubMed
    1. Desdin-Mico, G. et al. T cells with dysfunctional mitochondria induce multimorbidity and premature senescence. Science368, 1371–1376 (2020). 10.1126/science.aax0860 - DOI - PMC - PubMed
    1. Iwata, R., Casimir, P. & Vanderhaeghen, P. Mitochondrial dynamics in postmitotic cells regulate neurogenesis. Science369, 858–862 (2020). 10.1126/science.aba9760 - DOI - PubMed
    1. Wang, Y. et al. Mitochondrial fission promotes the continued clearance of apoptotic cells by macrophages. Cell171, 331–345.e322 (2017). 10.1016/j.cell.2017.08.041 - DOI - PMC - PubMed

MeSH terms

Substances