. 2024 Nov;38(11):2395-2409.
doi: 10.1038/s41375-024-02390-9. Epub 2024 Aug 26.

Stearoyl-CoA desaturase inhibition is toxic to acute myeloid leukemia displaying high levels of the de novo fatty acid biosynthesis and desaturation

Affiliations

Stearoyl-CoA desaturase inhibition is toxic to acute myeloid leukemia displaying high levels of the de novo fatty acid biosynthesis and desaturation

Vilma Dembitz et al. Leukemia. 2024 Nov.

Abstract

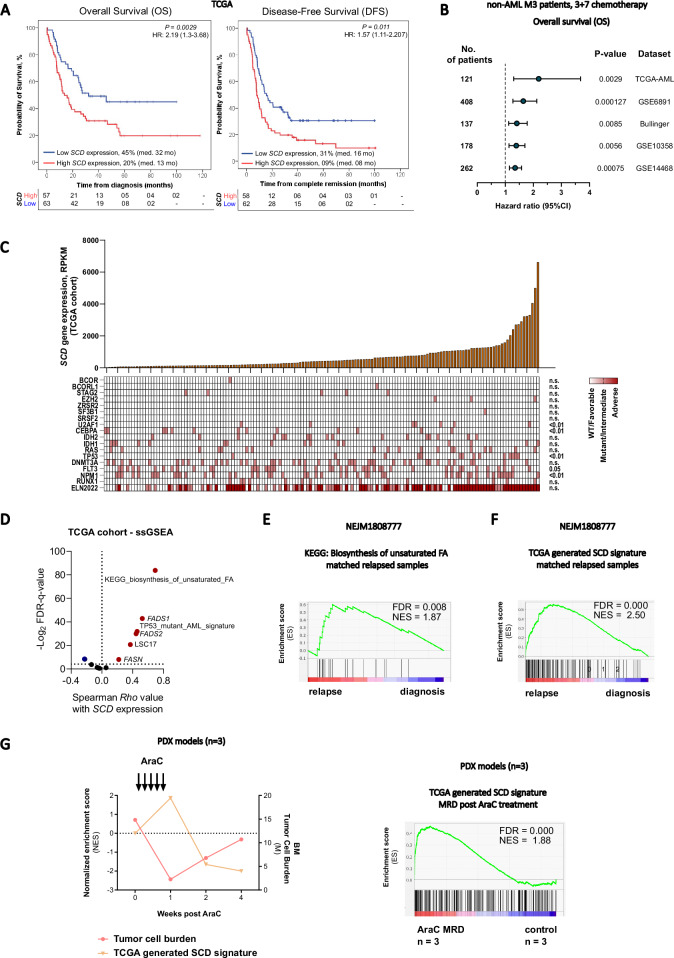
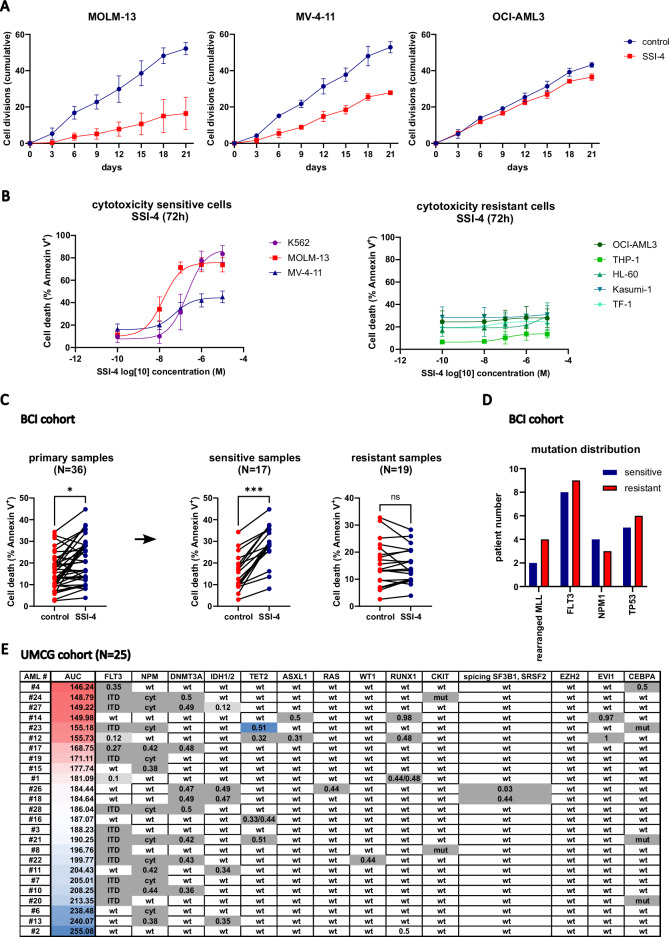
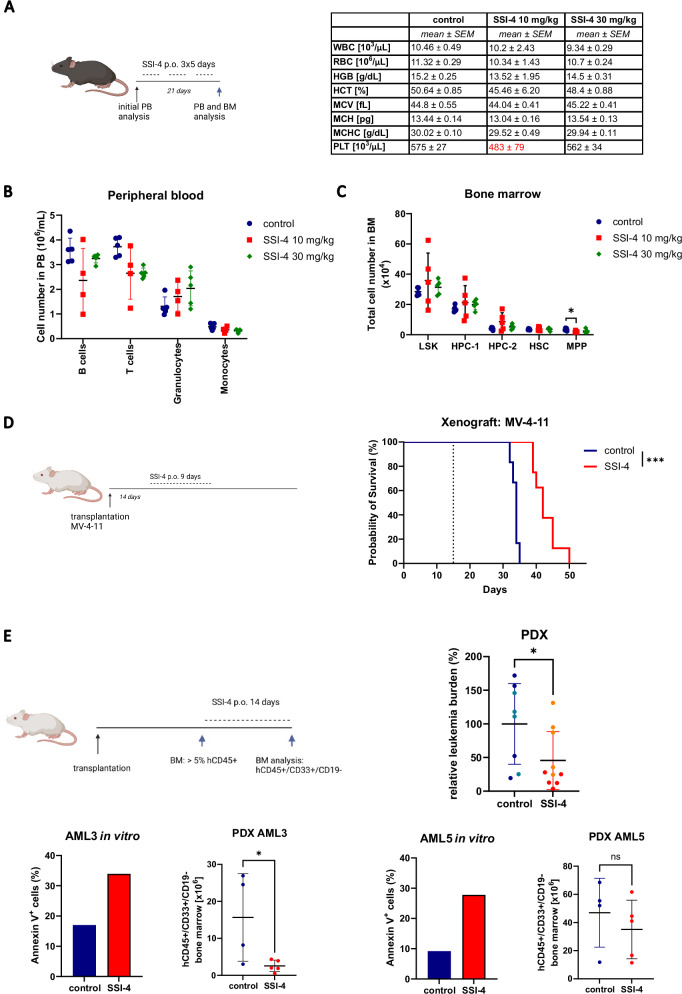
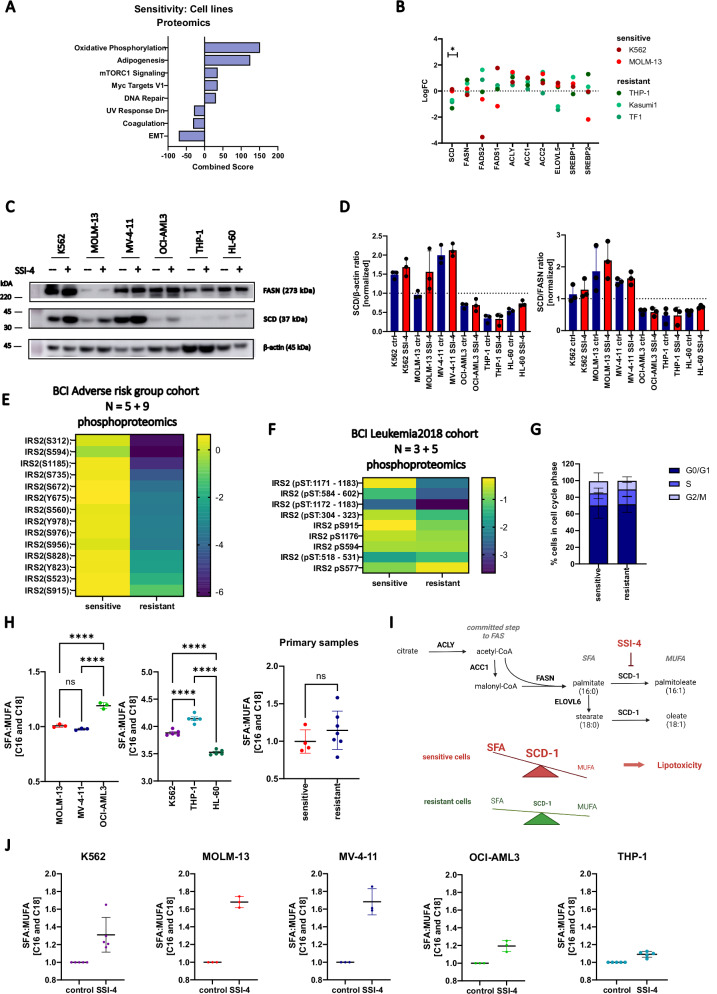
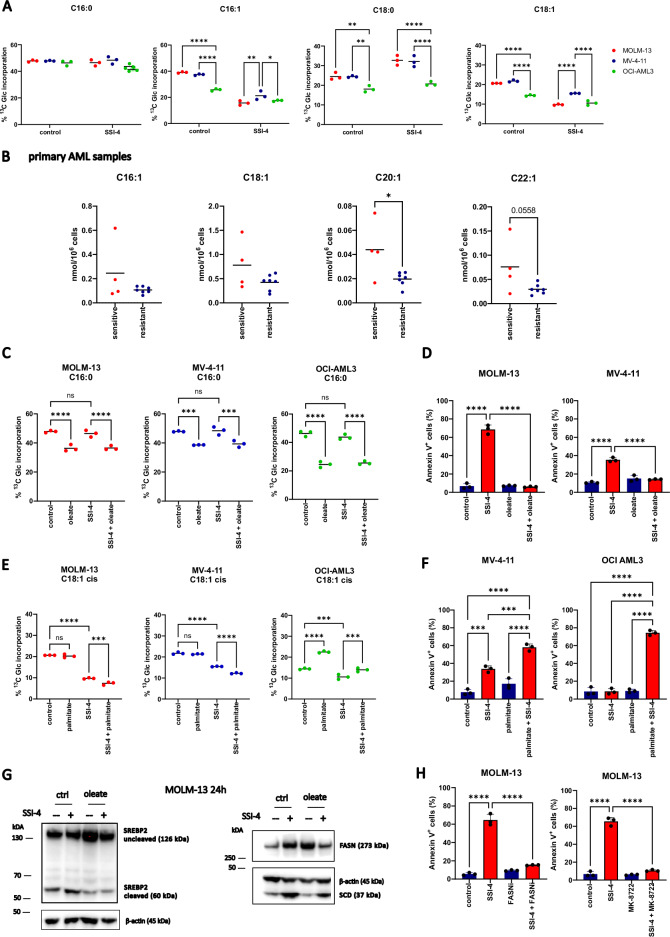
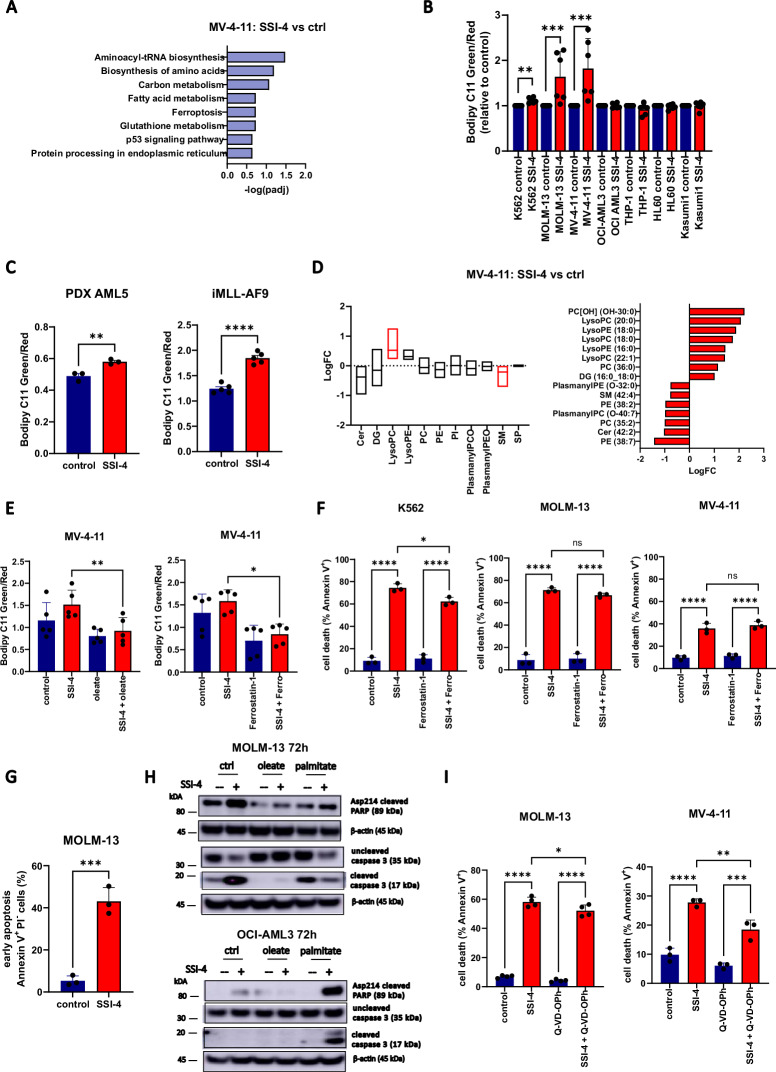
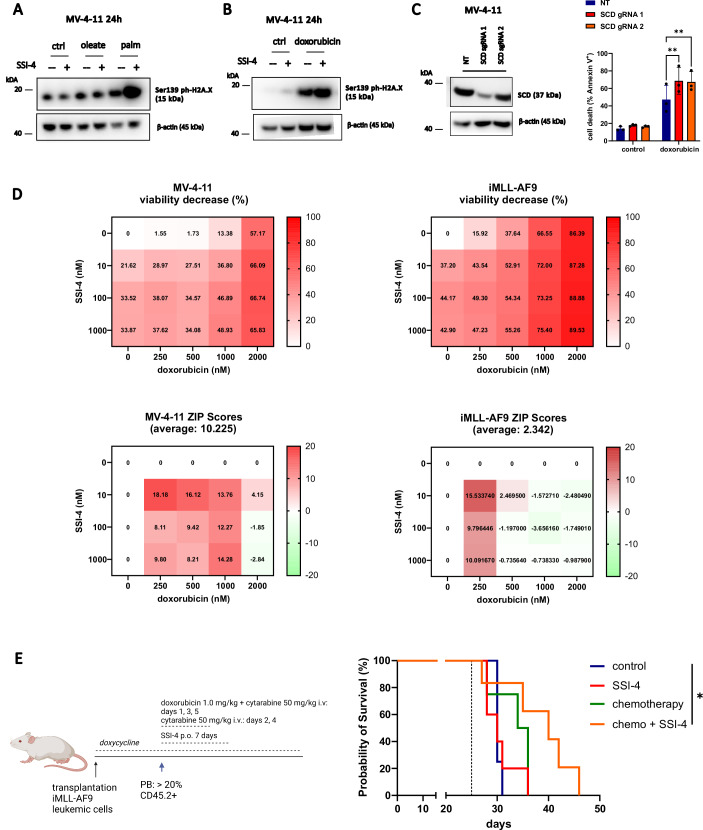
Identification of specific and therapeutically actionable vulnerabilities, ideally present across multiple mutational backgrounds, is needed to improve acute myeloid leukemia (AML) patients' outcomes. We identify stearoyl-CoA desaturase (SCD), the key enzyme in fatty acid (FA) desaturation, as prognostic of patients' outcomes and, using the clinical-grade inhibitor SSI-4, show that SCD inhibition (SCDi) is a therapeutic vulnerability across multiple AML models in vitro and in vivo. Multiomic analysis demonstrates that SCDi causes lipotoxicity, which induces AML cell death via pleiotropic effects. Sensitivity to SCDi correlates with AML dependency on FA desaturation regardless of mutational profile and is modulated by FA biosynthesis activity. Finally, we show that lipotoxicity increases chemotherapy-induced DNA damage and standard chemotherapy further sensitizes AML cells to SCDi. Our work supports developing FA desaturase inhibitors in AML while stressing the importance of identifying predictive biomarkers of response and biologically validated combination therapies to realize their full therapeutic potential.


Conflict of interest statement

LH is CEO and co-founder of Modulation Therapeutics, the company holding intellectual property to SSI-4. J.A.C. holds a patent regarding the use of the SCD inhibitor SSI-4.

Figures

Fig. 1
Fig. 1. High SCD gene expression levels are prognostic in AML and associated with relapse.
A Kaplan–Meier curves comparing overall survival and disease-free survival in TCGA AML patient cohort dichotomized after SCD expression. The expression level of SCD was considered a continuous variable and the Log rank (Mantel–Cox) test was used to determine significance. B Forest plot of overall survival analyses considering continuous SCD gene expression on several patients’ datasets. Multivariate analysis corrected for confounding variables like age, gender, and ELN prognostic group in all datasets. C Oncoprint matrix correlating SCD expression levels with the presence of common mutations in AML and ELN prognostic groups. Kruskal–Wallis test was used for determining significance. D Single sample gene set enrichment analysis (ssGSEA) on TCGA cohort in dependency to SCD expression. E Gene set enrichment analysis (GSEA) for KEGG pathway Biosynthesis of unsaturated fatty acids and F TCGA-generated SCD signature in paired diagnosis-relapse primary AML samples (NEJM1808777 dataset). G Tumor burden and SCD signature expression in Ara-C-treated PDX models (GSE97631) and GSEA for SCD signature at MRD stage.
Fig. 2
Fig. 2. Novel clinical-grade SCD inhibitor SSI-4 induces cell death in a subset of AML samples.
A Proliferation assay in MOLM-13, MV-4-11, and OCI-AML3 cells treated with SSI-4 (1 µM) for 6 cycles of 72 h in a total duration of 21 days. The number of cell divisions was standardized after the initial plating concentration of 300,000 cells per mL. B A panel of eight AML cell lines was treated with SSI-4 (0.01–10 µM) or corresponding vehicle for 72 h. Cells with less than a 10% increase in cell death induction were designated resistant. Results are presented as non-linear regression and data points are mean ± SD. C AML primary samples from Barts Cancer Institute (BCI, n = 36) were depleted of T-cells and grown in co-culture with irradiated MS-5 cells for 7 days with the addition of SSI-4 (1 µM). Samples with less than 5% increase in cell death induction were designated to the resistant group. D Mutation distribution in sensitive and resistant samples across BCI cohort. For a more detailed presentation of the patient’s characteristics please see Supplementary Data 1. E A separate AML patients cohort from the University of Groningen Medical Center (UMCG, n = 25) was treated with SSI-4 (1 and 10 µM) in co-culture with stroma for 4 days and sensitivity to SSI-4 was expressed as area under the curve (AUC). *p < 0.05, **p < 0.01, ***p < 0.001, ****p < 0.0001.
Fig. 3
Fig. 3. SSI-4 demonstrates no hematopoietic toxicity and displays anti-leukemic effects in vivo in humanized xenografts.
A C57BL/6 mice (n = 15) were treated with 10 and 30 mg/kg SSI-4 or corresponding vehicle orally for a total of 21 days with 2 days break after each 5 days of continuous treatment. PB counts of control or SSI-4 treated mice. WBC – white blood cells, RBC – red blood cells, HGB – hemoglobin concentration, HCT – hematocrit, MCV – mean cell volume, MCH – mean cell hemoglobin, MCHC – mean cell hemoglobin concentration, PLT – platelets. B Differential blood counts in peripheral blood of treated animals as determined by flow cytometry. C Total numbers of cells in LSK (Lin-Sca-1+c-Kit+), HPC-1 (LSK CD48+CD150−), HPC-2 (LSK CD48+CD150−), HSC (LSK CD48−CD150+), MPP (LSK CD48-CD150−) compartments in the BM isolated from two legs of treated animals. D MV-4-11 cells were transplanted into NBSGW mice (n = 14). 14 days after transplant animals were treated for 9 days with 10 mg/kg SSI-4 or corresponding vehicle orally. The dotted line represents the start of treatment. Kaplan–Meier curve represents the overall survival of animals treated with SSI-4 and the corresponding vehicle. E Two sensitive samples in vitro were transplanted into NBSGW mice. When engraftment of human CD45+ cells exceeded 5% in the BM, animals were distributed in groups with equal leukemic burden and treated with 10 mg/kg of SSI-4 or corresponding vehicle orally for 14 days. The total number of human leukemic cells (hCD45+hCD33+hCD19) isolated from two legs at the end of the experiment was standardized relative to the mean engraftment of individual patient samples at the end of the experiment. Data are mean ± SD. PDX derived from AML3 are presented in darker shades and those derived from AML5 in lighter shades on the dot plot. SSI-4 mediated increase in cell death in vitro and absolute decrease of human leukemic cells in the bone marrow of treated mice for each patient sample is presented in lower panels. *p < 0.05, **p < 0.01, ***p < 0.001, ****p < 0.0001. Mouse illustrations created with BioRender.com.
Fig. 4
Fig. 4. SSI-4 sensitive cells have a greater dependency on de novo MUFA production.
A Significantly enriched MSigDB signatures in sensitive vs resistant cell lines from the Cancer Cell Line Encyclopedia proteomics dataset ranked by a combined score from Enrichr enrichment analysis. Significantly upregulated signatures in sensitive cells are presented on the right-hand side and downregulated signatures on the left-hand side of the graph. B Normalized expression of fatty acid synthesis-related proteins in AML cell lines tested. C Representative western blot (n = 3) of sensitive (K562, MOLM-13, MV-4-11) and resistant (OCI-AML3, THP-1, HL-60) cell lines treated with SSI-4 (1 µM) or vehicle control for 24 h. D Densitometric analysis shows SCD expression normalized to ß-actin as a loading control and FASN. E Phosphoproteomic analysis of 5 sensitive and 9 resistant AML patients from BCI Adverse prognosis cohort. F Independent phosphoproteomic analysis from BCI Leukemia 2018 cohort of 3 sensitive and 5 resistant AML patients. Heatmaps represent log2 fold change of phosphorylated sites on IRS2 in sensitive and resistant samples normalized on-target relative intensity. G Cell cycle analysis of sensitive (n = 7) and resistant (n = 8) primary AML samples. H SFA/MUFA ratios in sensitive and resistant AML cell lines and primary samples (n = 11). The graphs represent the ratio of C16 and C18 saturated (SFA) and monounsaturated fatty acids (MUFA) in independent runs. I Schematic representation of de novo fatty acid synthesis pathway and SFA/MUFA imbalance upon SCD inhibition in sensitive and resistant cells. ACLY - ATP-citrate lyase, ACC1 – acetyl-CoA carboxylase, FASN – fatty acid synthase, ELOVL6 - ELOVL fatty acid elongase 6, SCD1 – stearoyl-Co desaturase. J SFA/MUFA ratios normalized to control conditions in sensitive and resistant AML cell lines treated with SSI-4 (1 µM) or vehicle control for 24 h.
Fig. 5
Fig. 5. MUFA production and levels regulate sensitivity to SSI-4 by modulating the de novo fatty acid synthesis pathway.
A MOLM-13, MV-4-11, and OCI-AML3 were grown in medium supplemented with U-13C6-Glucose (2 g/L) and treated with SSI-4 (1 µM) or vehicle control for 24 h. Graphs represent the percentage of 13C-glucose incorporation in palmitate (C16:0), stearate (C18:0), palmitoleate (C16:1), and oleate (C18:1). B MUFA levels in sensitive (n = 4) vs resistant (n = 7) primary AML samples. C, E MOLM-13, MV-4-11, and OCI-AML3 were labeled with U-13C6-Glucose (2 g/L) and treated for 24 h with SSI-4 (1 µM) or vehicle control with or without the addition of oleate (100 µM) or palmitate (100 µM). Graphs represent the percentage of 13C-glucose incorporation in palmitate (C16:0) and oleate (C18:1) (D, F) MOLM-13, MV-4-11, and OCI-AML cells were treated for 72 h with SSI-4 (1 µM) with or without the addition of oleate (100 µM) or palmitate (100 µM). G Representative western blots (n = 3) of MOLM-13 cells treated for 24 h with SSI-4 (1 µM) or vehicle control with or without the addition of oleate (100 µM). H MOLM-13 cells were treated for 72 h with SSI-4 (1 µM) with or without the addition of FASN inhibitor Fasnall (20 µM) or MK-8722 (10 µM). Cell death induction was determined by Annexin-V expression. Data are mean ± SD. *p < 0.05, **p < 0.01, ***p < 0.001, ****p < 0.0001.
Fig. 6
Fig. 6. SSI-4 treatment induces both an increase in lipid peroxidation and activation of apoptotic machinery.
A Significantly enriched KEGG pathway signature in MV-4-11 cells treated with SSI-4 (1 µM) or vehicle control for 24 h. B Sensitive K562, MOLM-13, MV-4-11 and resistant OCI-AML3, THP-1, HL-60 and Kasumi-1 cell were treated for 24 h with SSI-4 (1 µM) or vehicle control. Lipid peroxidation was measured using Bodipy C11. C Lipid peroxidation determined using Bodipy C11 in the PDX model derived from patient sample AML5 and in the murine AML model iMLL-AF9 after oral treatment with SSI-4 (10 mg/kg). D Lipidomics analysis on MV-4-11 cells treated for 24 h with SSI-4 (1 µM) or vehicle control. The upper graph represents enrichment analysis per lipid groups of treated cells vs. control (Q1–Q3 with line at median value) with significant lipid groups marked in red. The lower graph represents significant differentially expressed individual lipids with upregulated lipids presented on the right-hand side and downregulated lipids on the left-hand side of the graph. Red bars: padj <0.05. E Rescue of lipid peroxidation induction in response to SSI-4 (1 µM, 24 h) using oleate (100 µM), as well as lipid peroxidation inhibitors ferrostatin-1 (5 µM) in MOLM-13 cells. F K562, MOLM-13, and MV-4-11 cells were treated for 72 h with SSI-4 (1 µM) or vehicle control with or without the addition of Ferrostatin-1 (5 µM). G MOLM-13 cells in early apoptosis (Annexin-V+/PI) after 72 h treatment with SSI-4 (1 µM). H Representative western blots (n = 3) of MOLM-13 and OCI-AML3 cells treated for 72 h with SSI-4 (1 µM) or vehicle control with or without the addition of oleate (100 µM) or palmitate (100 µM). I MOLM-13 and MV-4-11 cells were treated for 72 h with SSI-4 (1 µM) or vehicle control with or without the addition of Q-VD-OPh (50 µM). Cell death induction was determined by Annexin-V expression. Data are mean ± SD. *p < 0.05, **p < 0.01, ***p < 0.001, ****p < 0.0001.
Fig. 7
Fig. 7. Lipotoxicity increases DNA damage and sensitizes SSI-4 treated cells to DNA-damage-inducing chemotherapy both in vitro and in vivo.
A, B Representative western blots (n = 3) of MV-4-11 cells treated with SSI-4 (1 µM) or vehicle control with or without the addition of oleate (100 µM), palmitate (100 µM) or doxorubicin (1 µM) for 24 h. C MV-4-11 non-targeting (NT) gRNA, SCD gRNA 1, and SCD gRNA 2 were treated for 72 h with doxorubicin (1 µM). Cell death induction was determined by Annexin-V expression. D MV-4-11 and leukemic iMLL-AF9 cells were treated for 72 h with growing concentrations of SSI-4 and doxorubicin. Synergy was determined by the Bliss coefficient (ZIP Score > 10 indicates synergism). Viable cells were determined as Annexin-V-/Zombie-. E CD45.2+ leukemic iMLL-AF9 cells were transplanted into CD45.1+ NBSGW mice (n = 18). When leukemic burden in PB reached 20%, animals were treated for 7 days with 10 mg/kg SSI-4 or corresponding vehicle orally with or without conventional chemotherapy protocol. The dotted line represents the start of treatment. Kaplan–Meier curve represents the overall survival of animals treated with SSI-4 and corresponding vehicle with our without conventional chemotherapy. Data are mean ± SD. *p < 0.05, **p < 0.01, ***p < 0.001, ****p < 0.0001.

References

    1. DiNardo CD, Erba HP, Freeman SD, Wei AH. Acute myeloid leukaemia. Lancet. 2023;401:2073–86. - PubMed
    1. Yap TA, Daver N, Mahendra M, Zhang J, Kamiya-Matsuoka C, Meric-Bernstam F, et al. Complex I inhibitor of oxidative phosphorylation in advanced solid tumors and acute myeloid leukemia: phase I trials. Nat Med. 2023;29:115–26. - PMC - PubMed
    1. Ma MKF, Lau EYT, Leung DHW, Lo J, Ho NPY, Cheng LKW, et al. Stearoyl-CoA desaturase regulates sorafenib resistance via modulation of ER stress-induced differentiation. J Hepatol. 2017;67:979–90. - PubMed
    1. Eyme KM, Sammarco A, Jha R, Mnatsakanyan H, Pechdimaljian C, Carvalho L, et al. Targeting de novo lipid synthesis induces lipotoxicity and impairs DNA damage repair in glioblastoma mouse models. Sci Transl Med. 2023;15:eabq6288. - PMC - PubMed
    1. Peck B, Schug ZT, Zhang Q, Dankworth B, Jones DT, Smethurst E, et al. Inhibition of fatty acid desaturation is detrimental to cancer cell survival in metabolically compromised environments. Cancer Metab. 2016;4:6. - PMC - PubMed

MeSH terms

LinkOut - more resources