. 2024 Dec;19(12):1804-1812.
doi: 10.1038/s41565-024-01767-2. Epub 2024 Aug 26.

Continuous spectral and coupling-strength encoding with dual-gradient metasurfaces

Affiliations

Continuous spectral and coupling-strength encoding with dual-gradient metasurfaces

Andreas Aigner et al. Nat Nanotechnol. 2024 Dec.

Abstract

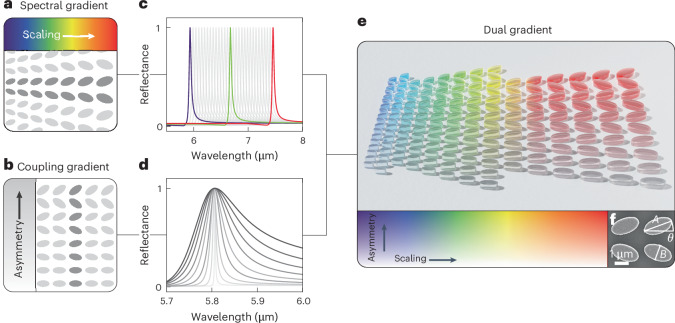
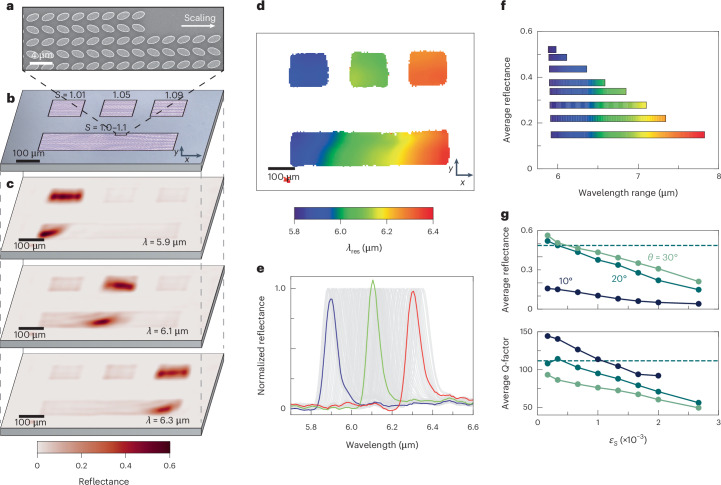
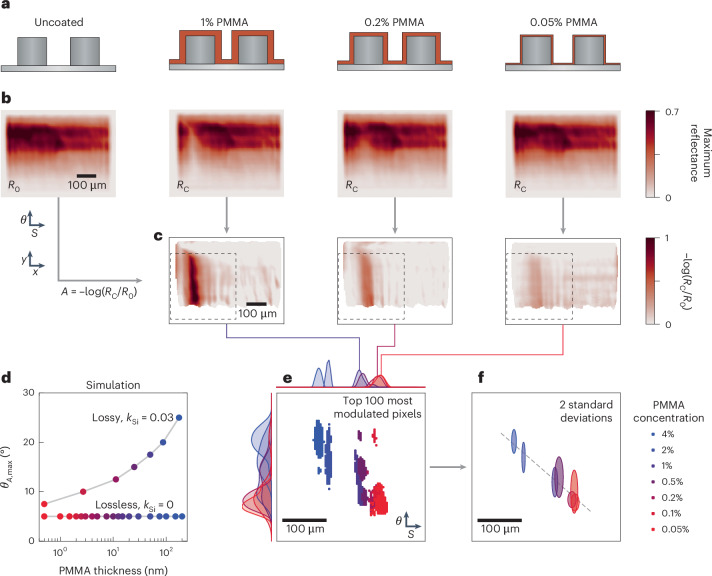
To control and enhance light-matter interactions at the nanoscale, two parameters are central: the spectral overlap between an optical cavity mode and the material's spectral features (for example, excitonic or molecular absorption lines), and the quality factor of the cavity. Controlling both parameters simultaneously would enable the investigation of systems with complex spectral features, such as multicomponent molecular mixtures or heterogeneous solid-state materials. So far, it has been possible only to sample a limited set of data points within this two-dimensional parameter space. Here we introduce a nanophotonic approach that can simultaneously and continuously encode the spectral and quality-factor parameter space within a compact spatial area. We use a dual-gradient metasurface design composed of a two-dimensional array of smoothly varying subwavelength nanoresonators, each supporting a unique mode based on symmetry-protected bound states in the continuum. This results in 27,500 distinct modes and a mode density approaching the theoretical upper limit for metasurfaces. By applying our platform to surface-enhanced molecular spectroscopy, we find that the optimal quality factor for maximum sensitivity depends on the amount of analyte, enabling effective molecular detection regardless of analyte concentration within a single dual-gradient metasurface. Our design provides a method to analyse the complete spectral and coupling-strength parameter space of complex material systems for applications such as photocatalysis, chemical sensing and entangled photon generation.


Conflict of interest statement

Competing interests: The authors declare no competing interests.

Figures

Fig. 1
Fig. 1. Concept of dual-gradient metasurfaces combining independent spectral and coupling gradients.
a, Schematic representation of a spectral-gradient metasurface composed of unit cells of tilted ellipse pairs. Identical resonators form chains along the vertical, with a gradual increase in scaling along the horizontal. b, Schematic representation of a coupling-gradient metasurface. The asymmetry (in the form of the tilting angle θ) varies along the vertical, altering the far-field coupling strength and the resonance Q-factor. c, Numerical reflectance spectra of BIC resonances with scaling factors ranging from 1.0 to 1.3, increasing incrementally by steps of 0.01. d, Numerical reflectance spectra with a constant scaling factor (S = 1), and θ varying from 0° (light grey) to 45° (black) in increments of 5°. Spectral alignment of the resonances is achieved by using an additional scaling factor, discussed in Fig. 3. e, Illustration of a dual-gradient metasurface that incorporates both a spectral gradient along the horizontal and a coupling gradient along the vertical, illustrated by a spectral gradient along the x axis and a saturation gradient along the y axis, respectively. f, SEM image of the final metasurfaces showing two unit cells. A and B represent the long and short axes of the ellipses, and θ is the tilt angle.
Fig. 2
Fig. 2. Spectral-gradient metasurface.
a, SEM image of a spectral gradient with the scaling along the x axis. b, Optical image of the three monospectral metasurfaces with scaling factors S = 1.01, 1.05 and 1.09 from left to right, and the spectral gradient with S = 1.0–1.1 (below). c, Reflectance snapshots of the metasurfaces shown in b, taken at wavelengths (λ) of 5.9, 6.1 and 6.3 µm. d, Colour-coded resonance wavelengths λres for each detector pixel. Non-resonant pixels are shown in white. e, Normalized reflectance spectra taken from the spectral gradient along the x axis, shown in grey. The coloured spectra correspond to the three monospectral metasurfaces, each normalized to the gradient’s maximum reflectance at their respective spectral position. A direct reflectance comparison of the monospectral metasurfaces with the gradient at the equivalent scaling position is shown in Supplementary Fig. 9. f, Average reflectance amplitude and wavelength range for gradients with θ = 20° of different gradient steepness. g, Average reflectance amplitude and Q-factor plotted against different scaling increments εS for gradients with θ = 10, 20 and 30°. The horizontal dashed line represents the values for the monospectral metasurfaces with θ = 20°.
Fig. 3
Fig. 3. Coupling-gradient metasurface.
a, Illustration of the coupling gradient oriented perpendicular to the excitation polarization, accompanied by SEM images of unit cells from the gradient’s start and end. b, Reflectance spectra from the gradients captured along the x axis. c, Q-factor map derived from temporal coupled mode theory for the coupling gradient. d, The associated resonance frequency map. e, Depiction of ellipse scaling ES dependent on θ for the coupling gradient (CG; black) and the spectrally aligned coupling gradient (grey). f, Illustration of the spectrally aligned gradient and SEM images of the gradient’s start and end. g, Reflectance spectra from the spectrally aligned coupling gradient, analogous to b. h, Reflectance amplitude comparison of the two gradients extracted from the temporal coupled mode theory fitted data. i, Q-factor map for the spectrally aligned coupling gradient. j, A comparison between both gradients taken along the dashed lines in c and i. k, Resonance wavelength map for the spectrally aligned gradient. l, A comparison of both gradients taken along the dashed lines in d and k.
Fig. 4
Fig. 4. Dual-gradient metasurfaces and resonance density.
a, Sketch of a dual-gradient metasurface with the spectral gradient along the x axis and the spectrally aligned coupling gradient along the y axis. b, Single-wavelength snapshot of the dual gradient with S = 0.95–1.25 and θ = 0–45° at 6.25 μm. c, Resonance wavelength map of the dual gradient showing continuous wavelength encoding along the x axis. d, Q-factor map of the dual gradient with decreasing values along the y axis. e, Illustrative comparison of distinct modes within conventional monospectral metasurfaces and a dual-gradient metasurface. In the monospectral metasurface, all unit cells are identical, resulting in a single supported resonance (Nm = 1). By contrast, each unit cell within the dual-gradient metasurface is unique, leading to Nm being equal to the total number of unit cells (Nunit cell). f, A log–log plot of Nm against the resonance density (ρm). Comparative works are marked with numbers: pixelated sensors [1] (ref. ), radial BICs [2] (ref. ), trapped rainbows [3] (ref. ) and spectral-gradient metasurfaces [4] (ref. ). Our work is highlighted with an asterisk (*), showcasing the spectral gradient and the coupling gradient at ρm = 2.9 × 10–2 and 2.7 × 10–2, respectively. The dual gradient is positioned at the top right, with ρm = 1.
Fig. 5
Fig. 5. Dual-gradient metasurfaces for molecular sensing.
a, Unit cell sketches of the dual gradient with varying thicknesses of an analyte coating (PMMA). b, Maximum reflectance maps of a dual gradient with S = 0.95–1.1 and θ = 0–45° for the different coating thicknesses following a. From left to right, the maps show the gradient with no PMMA coating, followed by layers created with 1%, 0.2% and 0.05% PMMA solutions. c, The absorbance signal for each pixel is calculated using –log(RC/R0). The absorbance due to the analyte’s vibrational fingerprint is evident within the left third of the dual gradient, with higher values corresponding to higher concentrations. d, Relationship between optimum sensing configuration and analyte concentration. The angle, θA,max, where the relative absorbance A = –log(RC/R0) is maximal, is plotted against the analyte layer thickness. For an initially lossless system with kSi = 0, θA,max remains at the lowest simulated angle of 5°. For kSi = 0.03, which reflects the losses observed in our experiments (Supplementary Fig. 10), θA,max increases with the amount of analyte (more in Supplementary Note 7). e, A zoomed-in section of the dual gradient, outlined by the dashed black boxes in c, presents the 100 pixels with the highest absorbance for seven different coating thicknesses. The range starts with thick layers (4%) represented in blue and ends with thin layers (0.05%) in red. The kernel density estimation of the pixel distributions is plotted along both the x and y axes. f, The same zoomed-in section with the highest modulated pixels depicted as ellipses. The dimensions of the ellipses are set by twice the standard deviation in the x and y directions and are centred at the mean value. In grey is the linear regression line.

References

    1. Meher, N. & Sivakumar, S. A review on quantum information processing in cavities. Eur. Phys. J. Plus137, 985 (2022).
    1. Oldenburg, S. J., Averitt, R. D., Westcott, S. L. & Halas, N. J. Nanoengineering of optical resonances. Chem. Phys. Lett.288, 243–247 (1998).
    1. Kivshar, Y. & Miroshnichenko, A. Meta-optics with Mie resonances. Opt. Photon. News28, 24–31 (2017).
    1. Atwater, H. A. & Polman, A. Plasmonics for improved photovoltaic devices. Nat. Mater.9, 205–213 (2010). - PubMed
    1. Ricci, F. et al. A chemical nanoreactor based on a levitated nanoparticle in vacuum. ACS Nano16, 8677–8683 (2022). - PubMed

LinkOut - more resources