Clinical response and pathway-specific correlates following TIGIT-LAG3 blockade in myeloma: the MyCheckpoint randomized clinical trial
- PMID: 39187595
- PMCID: PMC11875007
- DOI: 10.1038/s43018-024-00818-w
Clinical response and pathway-specific correlates following TIGIT-LAG3 blockade in myeloma: the MyCheckpoint randomized clinical trial
Abstract
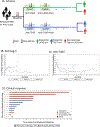
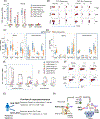
Persons with myeloma were randomized to receive an anti-TIGIT (T cell immunoreceptor) or anti-LAG3 (lymphocyte activation gene) antibody followed by combination with pomalidomide and dexamethasone ( NCT04150965 ). Primary and secondary endpoints were safety and efficacy, respectively. Therapy was well tolerated without dose-limiting toxicity. Durable clinical responses were observed in both the anti-TIGIT(three of six participants) and the anti-LAG3 (two of six participants) arms. Anti-LAG3 responders had higher naive cluster of differentiation 4 (CD4)-positive T cells and lower programmed cell death protein 1-positive effector T cells. Anti-TIGIT responders had higher CD226 expression, natural killer cell activation and lower CD112 expression. These data demonstrate the clinical activity of TIGIT-LAG3 blockade and identify pathway-specific response correlates in myeloma.
© 2024. The Author(s), under exclusive licence to Springer Nature America, Inc.
Conflict of interest statement
Conflicts of interest:
MVD: consulting and Advisory board-BMS, Lava Therapeutics and Sanofi.
RV: Research support: BMS, Takeda. Honoraria: Janssen, BMS, Sanofi, Karyopharm, Pfizer, GSK, Legend.
JLK: consulting-BMS, Sanofi, Abbvie, Incyte.
BP: Research funding: BMS. Advisory boards: Janssen and Abbvie.NCT
NB: Consulting and Advisory board - Janssen, Sanofi, Pfizer, Abbie, BMS; Speaker bureau - Janssen, BMS, Pfizer; Research support - Karyopharm, Amgen, BMS, Janssen.
HJC: Research support Genentech, Roche, BMS, Takeda.
HJC, KW and MM are employees of Multiple Myeloma Research Foundation.
AML: Advisory roles for Pfizer, Arcellx, Janssen. Research support-Pfizer, BMS. License/royalties-Caprion, inc.
Figures


References
Publication types
MeSH terms
Substances
Associated data
Grants and funding
- R01 AR077926/AR/NIAMS NIH HHS/United States
- UG3 CA290302/CA/NCI NIH HHS/United States
- SCOR/Leukemia and Lymphoma Society (Leukemia & Lymphoma Society)
- CA008748/U.S. Department of Health & Human Services | NIH | National Cancer Institute (NCI)
- CA197603/U.S. Department of Health & Human Services | NIH | National Cancer Institute (NCI)
- P30 CA008748/CA/NCI NIH HHS/United States
- P30 CA138292/CA/NCI NIH HHS/United States
- CA238471/U.S. Department of Health & Human Services | NIH | National Cancer Institute (NCI)
- CA138292/U.S. Department of Health & Human Services | NIH | National Cancer Institute (NCI)
- R01 CA289978/CA/NCI NIH HHS/United States
- R35 CA197603/CA/NCI NIH HHS/United States
- R01 CA238471/CA/NCI NIH HHS/United States
LinkOut - more resources
Full Text Sources
Medical
Research Materials

