. 2024 Nov;21(11):1266-1281.
doi: 10.1038/s41423-024-01209-y. Epub 2024 Aug 26.

Fatty acid metabolism constrains Th9 cell differentiation and antitumor immunity via the modulation of retinoic acid receptor signaling

Affiliations

Fatty acid metabolism constrains Th9 cell differentiation and antitumor immunity via the modulation of retinoic acid receptor signaling

Takahiro Nakajima et al. Cell Mol Immunol. 2024 Nov.

Erratum in

Abstract

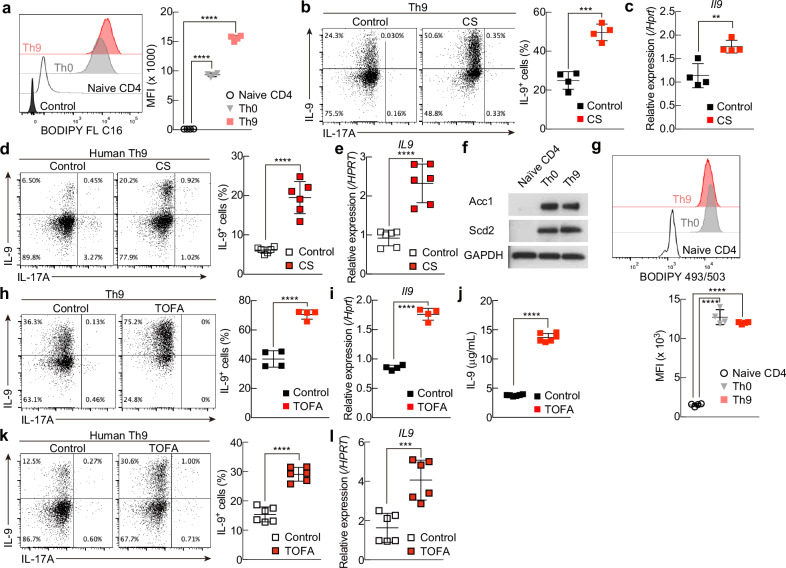
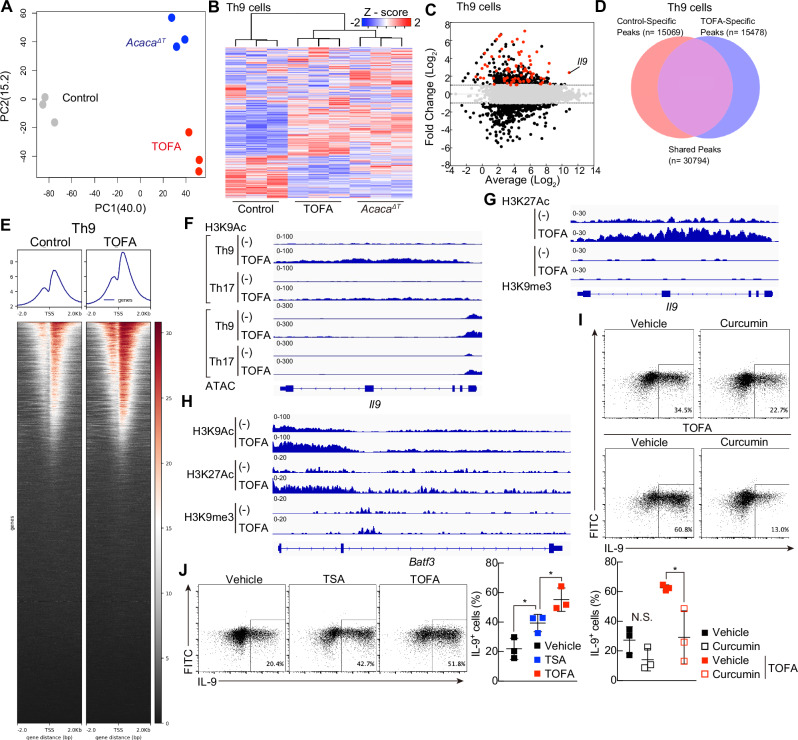
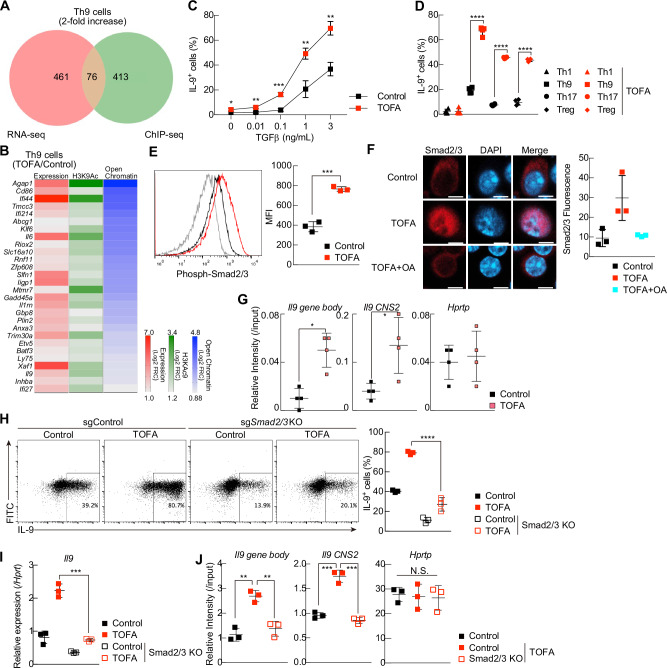
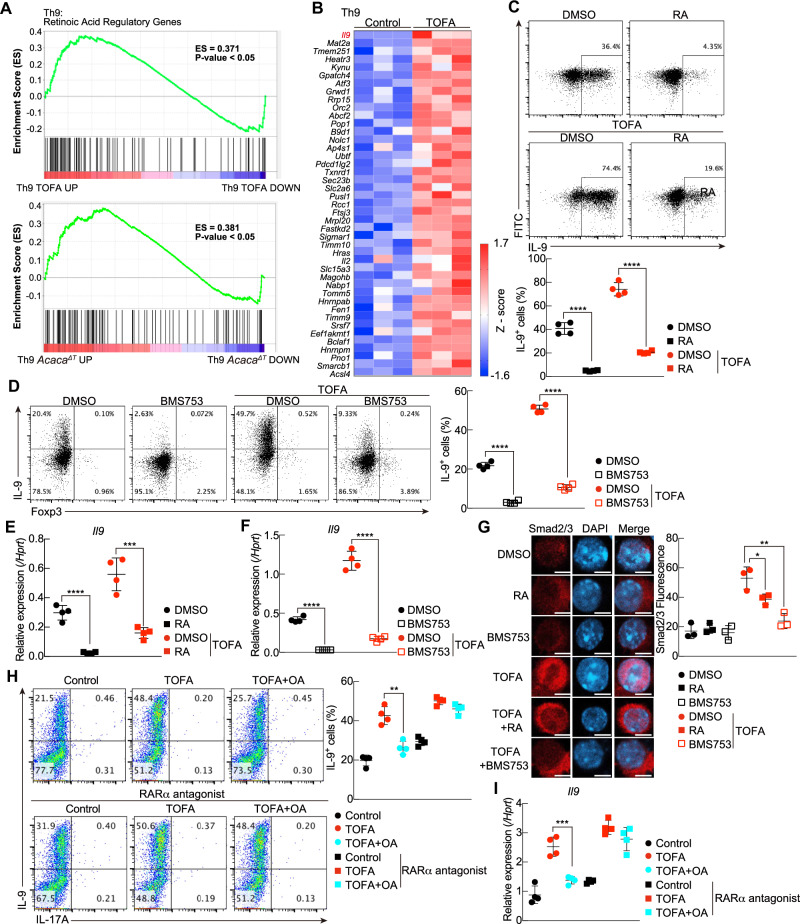
T helper 9 (Th9) cells are interleukin 9 (IL-9)-producing cells that have diverse functions ranging from antitumor immune responses to allergic inflammation. Th9 cells differentiate from naïve CD4+ T cells in the presence of IL-4 and transforming growth factor-beta (TGF-β); however, our understanding of the molecular basis of their differentiation remains incomplete. Previously, we reported that the differentiation of another subset of TGF-β-driven T helper cells, Th17 cells, is highly dependent on de novo lipid biosynthesis. On the basis of these findings, we hypothesized that lipid metabolism may also be important for Th9 cell differentiation. We therefore investigated the differentiation and function of mouse and human Th9 cells in vitro under conditions of pharmacologically or genetically induced deficiency of the intracellular fatty acid content and in vivo in mice genetically deficient in acetyl-CoA carboxylase 1 (ACC1), an important enzyme for fatty acid biosynthesis. Both the inhibition of de novo fatty acid biosynthesis and the deprivation of environmental lipids augmented differentiation and IL-9 production in mouse and human Th9 cells. Mechanistic studies revealed that the increase in Th9 cell differentiation was mediated by the retinoic acid receptor and the TGF-β-SMAD signaling pathways. Upon adoptive transfer, ACC1-inhibited Th9 cells suppressed tumor growth in murine models of melanoma and adenocarcinoma. Together, our findings highlight a novel role of fatty acid metabolism in controlling the differentiation and in vivo functions of Th9 cells.

Keywords: RARα; Th9 cell; anti-tumor effect; fatty acid; immunometabolism; omics analysis.


Conflict of interest statement

The authors declare no competing interests.

Figures

Fig. 1
Fig. 1
Depletion of environmental fatty acids and inhibition of de novo fatty acid biosynthesis increase IL-9 production by Th9 cells. A Representative plots of BODIPY FLC16 in CD4+ T cells, including naïve CD4+, Th0 and Th9 cells. B Representative intracellular staining profiles of IL-9 and IL-17A in Th9 cells cultured in serum from patients with CS. C Quantitative RT‒PCR analysis of Il9 in Th9 cells cultured as described in (B). D Representative intracellular staining profiles of IL-9 and IL-17A in human Th9 cells cultured in serum from patients with CS. E Quantitative RT‒PCR analysis of IL9 in human Th9 cells cultured as described in (D). F Western blot analysis of Acc1 and Scd2 in CD4+ T cells. G Representative plots of BODIPY 493/503 in CD4+ T cells, including naïve CD4+, Th0 and Th9 cells. H Representative intracellular staining profiles of IL-9 and IL-17A in Th9 cells treated with or without TOFA. I Quantitative RT‒PCR analysis of Il9 in Th9 cells cultured as described in (H). J IL-9 levels in the supernatants on day 3 were tested via ELISA. K Representative intracellular staining profiles of IL-9 and IL-17A in human Th9 cells treated with or without TOFA. l Quantitative RT‒PCR analysis of IL9 in human Th9 cells cultured as described in (K). n = 4 (AC), (GI); 6 (D, E), (JL) for each group, biologically independent samples are shown. More than three independent experiments were performed with similar results for (AL). Mean values with s.d. are shown for (AE) and (GI). An unpaired two-tailed Student’s t-test was applied for (AE) and (Gl). Statistical significance (P-value) is indicated as *P < 0.05; **P < 0.01; ***P < 0.001; ****P < 0.0001; N.S Not significant
Fig. 2
Fig. 2
Increased IL-9 production in de novo fatty acid biosynthesis-depleted Th9 cells is restored by supplementation with monounsaturated or saturated fatty acids. A Representative intracellular staining profiles of IL-9 and IL-17A in Th9 cells. The cells were collected from Acacafl/fl or AcacaΔT mice and cultured under Th9 conditions for 3 days in vitro. B Quantitative RT‒PCR analysis of Il9 in Th9 cells cultured as described in (A). C IL-9 levels in the supernatants on day 3 were tested via ELISA. D Dot plot depicting the ratio of changed lipids in CS serum to the control. E Pie chart showing the percentage of a total of 106 species of FAs incorporated into lipids, which were reduced in CS serum, as depicted in (D). Data are partitioned on the basis of the length and saturation of their fatty acyl side chains. Those carrying more than one fatty acid are further grouped according to least saturation or the longest carbon chain. SFA, saturated fatty acid; MUFA, monounsaturated fatty acid; PUFA, polyunsaturated fatty acid. F Heatmap depicting the altered lipid composition in control, AcacaΔT-treated and TOFA-treated Th9 cells. Three biological replicates of each group are shown. G Venn diagram depicting the number of decreased lipids in CS-treated, TOFA-treated and AcacaΔT Th9 cells compared with control cells. H The proportions of lipids that satisfy the following criteria are shown. Compared with those in control cells, lipids in CS-serum, TOFA-treated and AcacaΔT Th9 cells are commonly decreased, as shown in (G). Among the commonly decreased lipids, the lipids included specific fatty acids that were present in more than 10% of the lipids that were reduced in the CS serum, as shown in (E). I Representative intracellular staining profiles of IL-9 and IL-17A in Th9 cells treated with or without TOFA plus OA (50 mM) or PA (25 mM). J Quantitative RT‒PCR analysis of Il9 in Th9 cells cultured as described in (I). K Representative intracellular staining profiles of IL-9 and IL-17A in human Th9 cells treated with or without TOFA plus OA (50 mM) or PA (25 mM). l Quantitative RT‒PCR analysis of IL9 in human Th9 cells cultured as described in (K). M Representative intracellular staining profiles of IL-9 and IL-17A in Th9 cells treated with or without TOFA plus [PE (16:0/18:1)] (30 mM) or [PS (16:0/18:1)] (30 mM) in the presence of methyl beta cyclo dextrin (0.01 mM). N Quantitative RT‒PCR analysis of Il9 in Th9 cells cultured as described in (M); n = 3 (F, G H); 4 (A), (B), (D), (IN); and 6 (C) biologically independent samples from each group are shown. More than two independent experiments were performed with similar results for (AC) and (IN). Mean values with s.d. are shown for (AC) and (IN). An unpaired two-tailed Student’s t-test was applied for (AC) and (IN). Statistical significance (P-value) is indicated as *P < 0.05; **P < 0.01; ***P < 0.001; ****P < 0.0001; N.S. not significant
Fig. 3
Fig. 3
ACC1 represses the permissive chromatin landscape at the Il9 gene locus (A) PCA plot of gene expression profiles obtained via RNA sequencing in control, TOFA-treated or AcacaΔT Th9 cells. B A clustering heatmap depicting the genes in control, TOFA-treated or AcacaΔT Th9 cells. C MA plot analysis of RNA-seq data from control and TOFA-treated Th9 cells. The red dots indicate genes associated with retinoic acid-related genes. The set of genes whose expression increased more than 2-fold in RARα KO Th9 cells was defined from a previously published dataset (GSE123501). D Venn diagram showing overlaps and differences in peaks between control and TOFA-treated Th9 cells via ChIP-seq. E Average plots and heatmaps showing H3K9ac enrichment at the TSS in the ChIP-seq datasets. FH Representative Il9 or Batf3 gene tracks via RNA-seq and ChIP-seq (H3K9ac, H3K27ac, or H3K9me3) in Th9 or Th17 cells polarized in the presence of the vehicle control or TOFA. I Representative intracellular staining profiles of IL-9 in Th9 or TOFA-Th9 cells treated with or without curcumin (2.5 mM). J Representative intracellular staining profiles of IL-9 in Th9 cells treated with vehicle control, TSA (3 nM) or TOFA. n = 1 (D, E) and (FH); 3 (AC), (I, J) for each group, biologically independent samples are shown. Two biologically independent experiments were performed with (DH). More than three independent experiments were performed with similar results for (I, J). The mean values with s.d. are shown for (I, J). An unpaired two-tailed Student’s t-test was applied for (I, J). Statistical significance (P-value) is indicated as *P < 0.05; **P < 0.01; ***P < 0.001; ****P < 0.0001; N.S. not significant
Fig. 4
Fig. 4
Increased IL-9 production in TOFA-Th9 cells is dependent on the TGF-β–Smad2/3 pathway. A Venn diagram showing overlaps and differences between 2.0-fold increased genes (RNA-seq or ChIP-seq; H3K9ac) in TOFA-treated Th9 cells relative to control Th9 cells. B Commonly upregulated genes identified via RNA-seq and ChIP-seq, related to (A), are shown here. Left columns, expression; middle columns, histone acetylation; right columns, permissive chromatin landscape in the TOFA/WT ratio. C The graph shows IL-9 production in Th9 cells cultured with the indicated concentrations of TGF-β, as analyzed via FACS. D The graph shows IL-9 production in Th cell subsets cultured with or without TOFA as analyzed by FACS. E Intracellular staining of phospho-Smad2/3 in Th9 or TOFA-Th9 cells. F Immunofluorescence analyses were performed with anti-Smad2/3 antibodies and DAPI in TOFA-Th9 cells in the presence or absence of OA (50 mM) and in control Th9 cells. The scale bar represents 5 mm. The fluorescence intensity of anti-Smad2/3 in the nucleus was calculated via ImageJ software. G ChIP assays were performed with an anti-Smad2 antibody at the Il9 locus in Th9 cells. The intensities of these modifications relative to input DNA were determined via quantitative RT‒PCR analysis. H Representative intracellular staining profiles of IL-9 in control and TOFA Th9 cells treated with sgControl or sgSmad2/3. I Quantitative RT‒PCR analysis of Il9 in Th9 cells cultured as described in (H). J ChIP assays were performed with an anti-H3K9ac antibody at the Il9 locus in Th9 cells. The intensities of these modifications relative to input DNA were determined via quantitative RT‒PCR analysis. n = 3 (E, F, H, I, J); (C, D, G) for each group, biologically independent samples are shown. Two biologically independent experiments were performed with (A, B, J). More than three independent experiments were performed with similar results for (CJ). The mean values with s.d. are shown for (C, D), and (EJ). An unpaired two-tailed Student’s t test was applied for (CE) and (GJ). Statistical significance (P value) is indicated as *P < 0.05; **P < 0.01; ***P < 0.001; ****P < 0.0001; N.S. not significant
Fig. 5
Fig. 5
A lack of ACC1-mediated fatty acid biosynthesis increases IL-9 production via the inhibition of RA-RARα signaling. A Gene set enrichment analysis (GSEA) revealed decreased expression of genes encoding retinoic acid-related genes in Th9 cells upon treatment with TOFA (top) or AcacaΔT Th9 cells (bottom). B Heatmap depicting genes differentially expressed in the retinoic acid regulatory genes in control and TOFA-treated Th9 cells. C Representative intracellular staining profiles of IL-9 in control and TOFA-treated Th9 cells with or without RA (1 mM). D Representative intracellular staining profiles of IL-9 in control and TOFA Th9 cells with or without BMS753. E Quantitative RT‒PCR analysis of Il9 in Th9 cells cultured as described in (C). F Quantitative RT‒PCR analysis of Il9 in Th9 cells cultured as described in (E). G Immunofluorescence analyses were performed with anti-Smad2/3 antibodies and DAPI in TOFA-Th9 cells in the presence or absence of RA (1 mM) or BMS753 and in control Th9 cells. The scale bars represent 5 mm. The fluorescence intensity of anti-Smad2/3 in the nucleus was calculated via ImageJ software. H Representative intracellular staining profiles of IL-9 and IL-17A in control, TOFA and TOFA plus OA Th9 cells with or without the RARα antagonist. I Quantitative RT‒PCR analysis of Il9 in Th9 cells cultured as described in (H). n = 3 (A), (B); 4 (CF), (H, I) for each group, biologically independent samples are shown. More than three independent experiments were performed with similar results for (AI). The mean values with s.d. are shown for (CI). An unpaired two-tailed Student’s t-test was applied for (CF) and (H, I). Statistical significance (P-value) is indicated as *P < 0.05; **P < 0.01; ***P < 0.001; ****P < 0.0001; N.S. not significant
Fig. 6
Fig. 6
Compared with control Th9 cells, tumor-specific TOFA-Th9 or combination therapy with aPD-1 and TOFA-Th9 cells efficiently induced tumor rejection. A Tumor responses to OT-II Th9 cell transfer in the B16 tumor model are shown. B Tumor weights at the end of the experiment from (A). C The number of CD45+ cells per mg of tumor in (A). D The number of CD8+ T cells per mg of tumor in (A). E Tumor responses to OT-II Th9 cell transfer in the MC38 tumor model are shown. F Tumor weights at the end of the experiment from (E). G The number of CD45+ cells per mg of tumor in (E). H The number of CD8+ T cells per mg of tumor in (E). I Tumor responses to combination therapy consisting of OT-II Th9 cell transfer and an anti-PD-1 antibody in the B16 tumor model are shown. J Tumor weights at the end of the experiment from (I). K Tumor responses to OT-II Th9 cell transfer with or without anti-IL-9 antibody treatment in the B16 tumor model are shown. L Survival curves according to Th9-related genes are shown. PFS and OS were analyzed via the Kaplan‒Meier method and compared among the groups via the log-rank test. n = 4 (AD); 5 (EK) biologically independent samples from each group are shown. More than three independent experiments were performed with similar results for (AK). Mean values with s.d. are shown for (AK). Two-way ANOVA was applied for (A, E, I, K). An unpaired two-tailed Student’s t test was applied for (BD), (FH, J). Statistical significance (P-value) is indicated as *P < 0.05; **P < 0.01; ***P < 0.001; ****P < 0.0001; N.S. Not significant

References

    1. Kaplan MH. Th9 cells: differentiation and disease. Immunol Rev. 2013;252:104–15. 10.1111/imr.12028. - PMC - PubMed
    1. Li Y, Yu Q, Zhang Z, Wang J, Li S, Zhang J, Liu G. TH9 cell differentiation, transcriptional control and function in inflammation, autoimmune diseases and cancer. Oncotarget. 2016;7:71001–12. 10.18632/oncotarget.11681. - PMC - PubMed
    1. Xue G, Jin G, Fang J, Lu Y. IL-4 together with IL-1β induces antitumor Th9 cell differentiation in the absence of TGF-β signaling. Nat Commun. 2019;10:1376. 10.1038/s41467-019-09401-9. - PMC - PubMed
    1. Angkasekwinai P, Dong C. IL-9-producing T cells: potential players in allergy and cancer. Nat Rev Immunol. 2021;21:37–48. 10.1038/s41577-020-0396-0. - PubMed
    1. Xue G, Zheng N, Fang J, Jin G, Li X, Dotti G. et al. Adoptive cell therapy with tumor-specific Th9 cells induces viral mimicry to eliminate antigen-loss-variant tumor cells. Cancer Cell. 2021;39:1610–1622.e1619. 10.1016/j.ccell.2021.09.011. - PMC - PubMed