. 2024 Dec;30(12):3646-3657.
doi: 10.1038/s41591-024-03209-x. Epub 2024 Aug 26.

Brain clocks capture diversity and disparities in aging and dementia across geographically diverse populations

Sebastian Moguilner #  1   2   3 Sandra Baez #  4   5   6 Hernan Hernandez  1 Joaquín Migeot  1 Agustina Legaz  1   2 Raul Gonzalez-Gomez  1 Francesca R Farina  5   6   7 Pavel Prado  8 Jhosmary Cuadros  1   9   10 Enzo Tagliazucchi  1   11 Florencia Altschuler  2 Marcelo Adrián Maito  1   2 María E Godoy  1   2 Josephine Cruzat  1 Pedro A Valdes-Sosa  12   13   14 Francisco Lopera  15 John Fredy Ochoa-Gómez  15 Alfredis Gonzalez Hernandez  16 Jasmin Bonilla-Santos  17 Rodrigo A Gonzalez-Montealegre  18 Renato Anghinah  19   20 Luís E d'Almeida Manfrinati  19   20 Sol Fittipaldi  1   5   6 Vicente Medel  1 Daniela Olivares  1   21   22   23 Görsev G Yener  24   25   26 Javier Escudero  27 Claudio Babiloni  28   29 Robert Whelan  5   6   30 Bahar Güntekin  31   32   33 Harun Yırıkoğulları  31   32 Hernando Santamaria-Garcia  34   35 Alberto Fernández Lucas  36 David Huepe  21 Gaetano Di Caterina  37 Marcio Soto-Añari  38 Agustina Birba  1 Agustin Sainz-Ballesteros  1 Carlos Coronel-Oliveros  1   5   6   39 Amanuel Yigezu  7 Eduar Herrera  40 Daniel Abasolo  41 Kerry Kilborn  42 Nicolás Rubido  43 Ruaridh A Clark  44 Ruben Herzog  1   45 Deniz Yerlikaya  46 Kun Hu  47 Mario A Parra  48   49 Pablo Reyes  34   35 Adolfo M García  2   5   6   50 Diana L Matallana  34   35   51 José Alberto Avila-Funes  52 Andrea Slachevsky  53   54   55 María I Behrens  56   57   58   59 Nilton Custodio  60 Juan F Cardona  61 Pablo Barttfeld  62 Ignacio L Brusco  63 Martín A Bruno  64 Ana L Sosa Ortiz  65 Stefanie D Pina-Escudero  5   6   66 Leonel T Takada  67 Elisa Resende  68 Katherine L Possin  5   6   66 Maira Okada de Oliveira  5   6   67 Alejandro Lopez-Valdes  5   6   69   70   71 Brian Lawlor  5   6 Ian H Robertson  5   6   66 Kenneth S Kosik  72 Claudia Duran-Aniotz  1 Victor Valcour  5   6   66 Jennifer S Yokoyama  5   6   66 Bruce Miller  5   6   66 Agustin Ibanez  73   74   75   76
Affiliations

Brain clocks capture diversity and disparities in aging and dementia across geographically diverse populations

Sebastian Moguilner et al. Nat Med. 2024 Dec.

Erratum in

  • Author Correction: Brain clocks capture diversity and disparities in aging and dementia across geographically diverse populations.
    Moguilner S, Baez S, Hernandez H, Migeot J, Legaz A, Gonzalez-Gomez R, Farina FR, Prado P, Cuadros J, Tagliazucchi E, Altschuler F, Maito MA, Godoy ME, Cruzat J, Valdes-Sosa PA, Lopera F, Ochoa-Gómez JF, Hernandez AG, Bonilla-Santos J, Gonzalez-Montealegre RA, Anghinah R, d'Almeida Manfrinati LE, Fittipaldi S, Medel V, Olivares D, Yener GG, Escudero J, Babiloni C, Whelan R, Güntekin B, Yırıkoğulları H, Santamaria-Garcia H, Lucas AF, Huepe D, Di Caterina G, Soto-Añari M, Birba A, Sainz-Ballesteros A, Coronel-Oliveros C, Yigezu A, Herrera E, Abasolo D, Kilborn K, Rubido N, Clark RA, Herzog R, Yerlikaya D, Hu K, Parra MA, Reyes P, García AM, Matallana DL, Avila-Funes JA, Slachevsky A, Behrens MI, Custodio N, Cardona JF, Barttfeld P, Brusco IL, Bruno MA, Sosa Ortiz AL, Pina-Escudero SD, Takada LT, Resende E, Possin KL, de Oliveira MO, Lopez-Valdes A, Lawlor B, Robertson IH, Kosik KS, Duran-Aniotz C, Valcour V, Yokoyama JS, Miller B, Ibanez A. Moguilner S, et al. Nat Med. 2024 Dec;30(12):3779. doi: 10.1038/s41591-024-03294-y. Nat Med. 2024. PMID: 39284956 Free PMC article. No abstract available.

Abstract

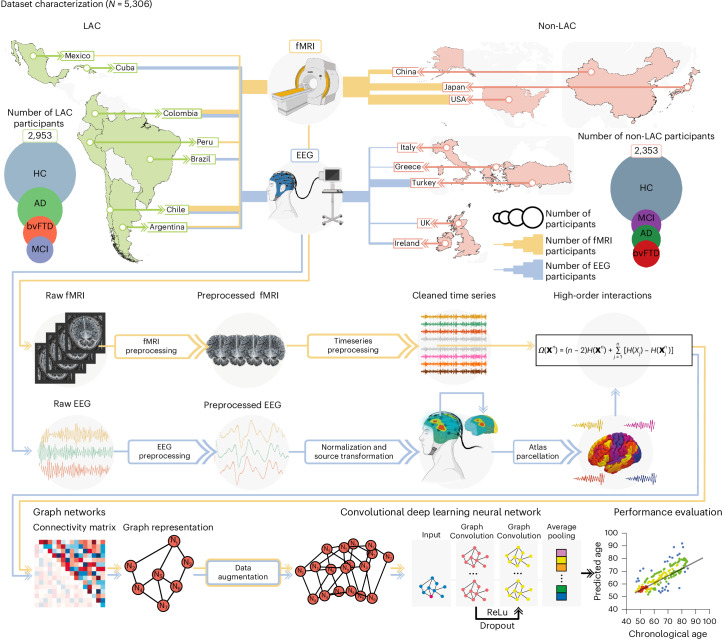
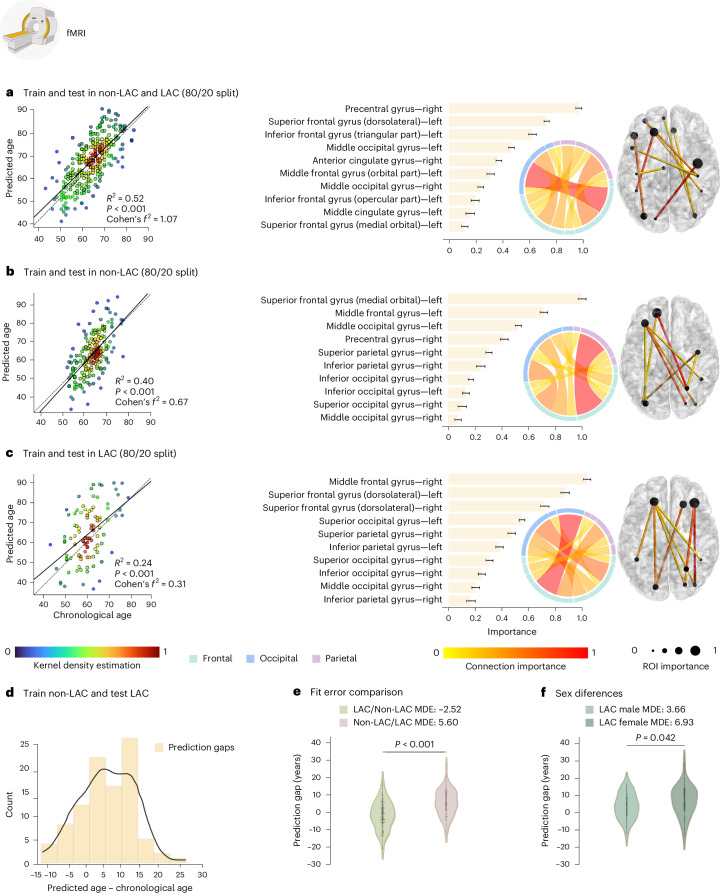
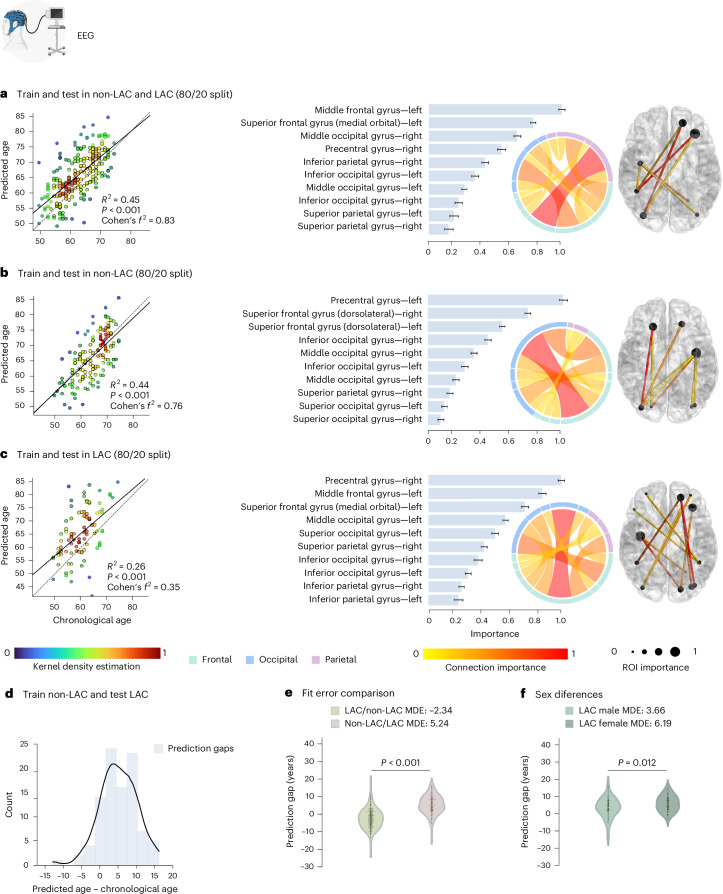
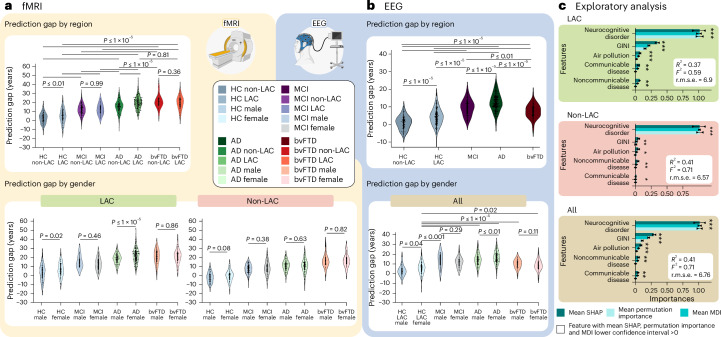
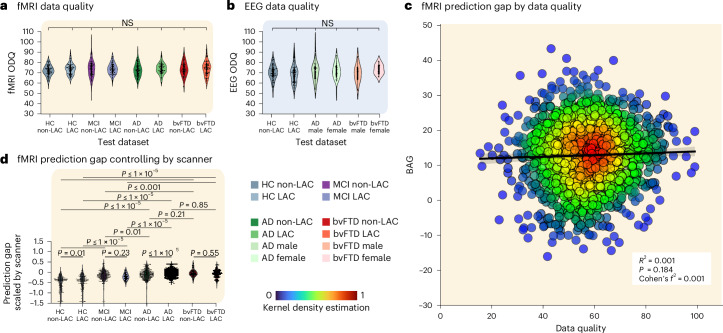
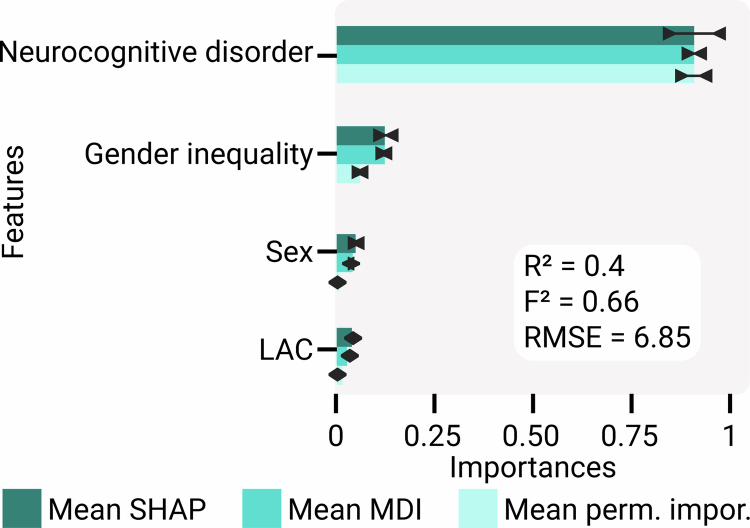
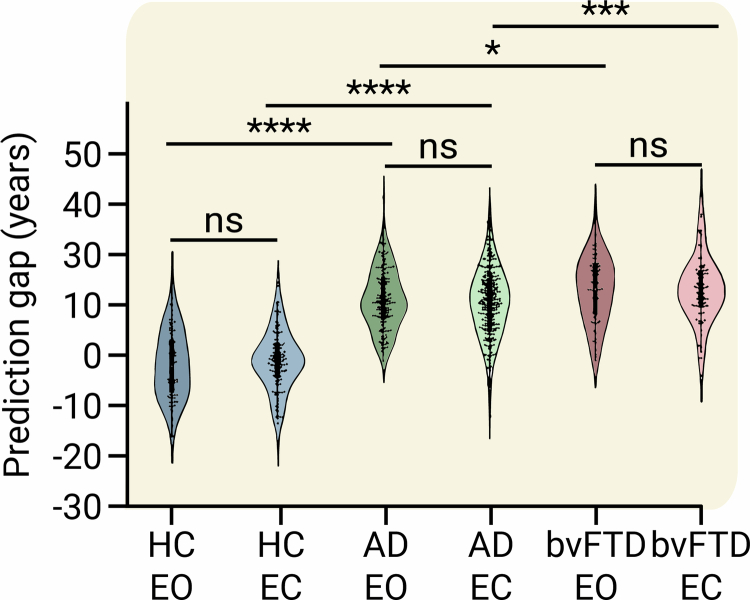
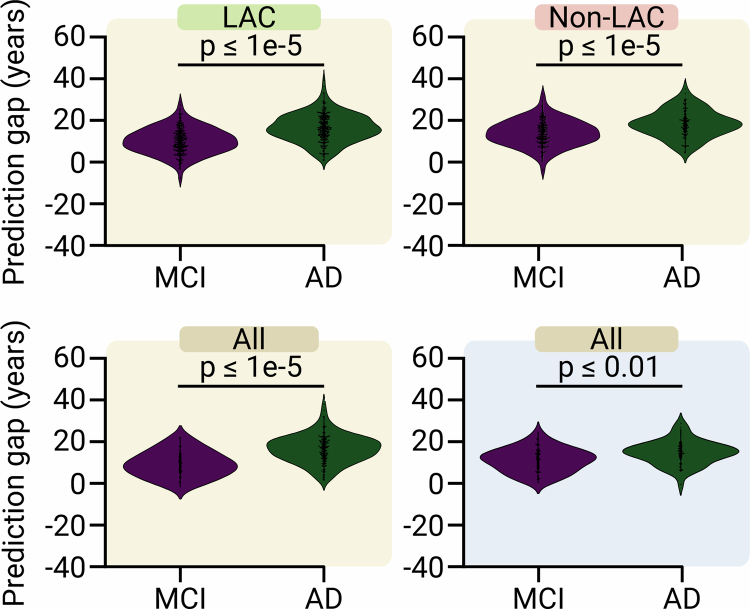
Brain clocks, which quantify discrepancies between brain age and chronological age, hold promise for understanding brain health and disease. However, the impact of diversity (including geographical, socioeconomic, sociodemographic, sex and neurodegeneration) on the brain-age gap is unknown. We analyzed datasets from 5,306 participants across 15 countries (7 Latin American and Caribbean countries (LAC) and 8 non-LAC countries). Based on higher-order interactions, we developed a brain-age gap deep learning architecture for functional magnetic resonance imaging (2,953) and electroencephalography (2,353). The datasets comprised healthy controls and individuals with mild cognitive impairment, Alzheimer disease and behavioral variant frontotemporal dementia. LAC models evidenced older brain ages (functional magnetic resonance imaging: mean directional error = 5.60, root mean square error (r.m.s.e.) = 11.91; electroencephalography: mean directional error = 5.34, r.m.s.e. = 9.82) associated with frontoposterior networks compared with non-LAC models. Structural socioeconomic inequality, pollution and health disparities were influential predictors of increased brain-age gaps, especially in LAC (R² = 0.37, F² = 0.59, r.m.s.e. = 6.9). An ascending brain-age gap from healthy controls to mild cognitive impairment to Alzheimer disease was found. In LAC, we observed larger brain-age gaps in females in control and Alzheimer disease groups compared with the respective males. The results were not explained by variations in signal quality, demographics or acquisition methods. These findings provide a quantitative framework capturing the diversity of accelerated brain aging.


Conflict of interest statement

Competing interests: The authors declare no competing interests.

Figures

Fig. 1
Fig. 1. Dataset characterization and analysis pipeline.
Datasets included LAC and non-LAC healthy controls (HC, total n = 3,509) and participants with Alzheimer disease (AD, total n = 828), bvFTD (total n = 463) and MCI (total n = 517). The fMRI dataset included 2,953 participants from LAC (Argentina, Chile, Colombia, Mexico and Peru) as well as non-LAC (the USA, China and Japan). The EEG dataset involved 2,353 participants from Argentina, Brazil, Chile, Colombia and Cuba (LAC) as well as Greece, Ireland, Italy, Turkey and the UK (non-LAC). The raw fMRI and EEG signals were preprocessed by filtering and artifact removal and the EEG signals were normalized to project them into source space. A parcellation using the automated anatomical labeling (AAL) atlas for both the fMRI and EEG signals was performed to build the nodes from which we calculated the high-order interactions using the Ω-information metric. A connectivity matrix was obtained for both modalities, which was later represented by graphs. Data augmentation was performed only in the testing dataset. The graphs were used as input for a graph convolutional deep learning network (architecture shown in the last row), with separate models for EEG and fMRI. Finally, age prediction was obtained, and the performance was measured by comparing the predicted versus the chronological ages. This figure was partially created with BioRender.com (fMRI and EEG devices).
Fig. 2
Fig. 2. fMRI training and testing the deep learning model in different datasets.
a, Ordinary least squares (OLS) regression comparing chronological age versus predicted age with the feature importance list for training (n = 1,155) and testing (n = 289) in the whole sample (P < 1 × 10−15). b, Regression comparing chronological age versus predicted age with the feature importance list for training (n = 773) and testing (n = 194) in the non-LAC dataset (P < 1 × 10−15). c, Regression comparing chronological age versus predicted age with the feature importance list for training (n = 381) and testing (n = 91) in the LAC dataset (P = 4.91 × 10−7). For a, b and c, the bars show the brain region feature importance list in descending order, with ring plots and glass brain representations of the most important network-edge connections. Feature importance (top 10) data are presented as mean values and 99% CI. The values for the features (mean, left limit, right limit) are: feature 1 = (0.975, 0.952, 0.999), feature 2 = (0.735, 0.715, 0.756), feature 3 = (0.627, 0.597, 0.656), feature 4 = (0.470, 0.449, 0.490), feature 5 = (0.375, 0.353, 0.397), feature 6 = (0.314, 0.285, 0.342), feature 7 = (0.239, 0.217, 0.262), feature 8 = (0.198, 0.169, 0.228), feature 9 = (0.161, 0.128, 0.193), feature 10 = (0.119, 0.093, 0.145) (a); feature 1 = (0.968, 0.937, 0.999), feature 2 = (0.736, 0.707, 0.764), feature 3 = (0.541, 0.518, 0.565), feature 4 = (0.434, 0.403, 0.464), feature 5 = (0.315, 0.290, 0.339), feature 6 = (0.253, 0.220, 0.286), feature 7 = (0.177, 0.156, 0.197), feature 8 = (0.140, 0.114, 0.166), feature 9 = (0.111, 0.078, 0.144), feature 10 = (0.079, 0.053, 0.106) (b); and feature 1 = (0.971, 0.944, 0.999), feature 2 = (0.847, 0.816, 0.878), feature 3 = (0.698, 0.667, 0.730), feature 4 = (0.533, 0.512, 0.555), feature 5 = (0.458, 0.430, 0.487), feature 6 = (0.371, 0.344, 0.399), feature 7 = (0.298, 0.272, 0.325), feature 8 = (0.242, 0.216, 0.269), feature 9 = (0.198, 0.169, 0.227), feature 10 = (0.163, 0.130, 0.196) (c). d, Histogram of the prediction error when training in non-LAC dataset (n = 967) and testing in LAC dataset (n = 477). e, Violin plot of the distribution and statistical comparison of training and testing with different regions using a two-sided permutation test without multiple comparisons (5,000 algorithm iterations) with a result of P < 1 × 10−15. Mean, first quartile (q1), third quartile (q3), whisker low, whisker high, minima and maxima values for violin plots are: LAC/non-LAC (−2.52, −7.74, 3.31, −22.52, 17.33, −22.52, 17.33); non-LAC/LAC (5.60, 0.85, 12.14, −12.82, 27.75, −12.82, 27.75). f, Violin plot of the distribution and statistical comparison of testing the models on females (n = 261) and males (n = 216) in LAC using a permutation test (5,000 iterations) with a result of P = 0.042. Mean, q1, q3, whisker low, whisker high, minima and maxima values for violin plots are: male (3.66, −1.83, 9.45, −12.49, 16.32, −12.49, 16.32); and female (6.93, 2.21, 12.78, −12.82, 27.75, −12.82, 27.75). ROI, region of interest. This figure was partially created with BioRender.com (fMRI device).
Fig. 3
Fig. 3. EEG training and testing the deep learning model in different samples.
a, OLS regression comparing chronological age versus predicted age with the feature importance list for training (n = 1,644) and testing (n = 411) in the whole sample (P < 1 × 10−15). b, Regression comparing chronological age versus predicted age with the feature importance list for training (n = 471) and testing (n = 118) in the non-LAC dataset (P < 1 × 10−15). c, Regression comparing chronological age versus predicted age with the feature importance list for training (n = 1,188) and testing (n = 298) in the LAC dataset (P = 3.51 × 10−7). For a, b and c, the bars show the brain region feature importance list in descending order, with ring plots and glass brain representations of the most important network-edge connections. Feature importance (top 10) data are presented as mean values and 99% CI. The values for the features (mean, left limit, right limit) are: feature 1 = (0.968, 0.946, 0.991), feature 2 = (0.759, 0.739, 0.779), feature 3 = (0.644, 0.617, 0.670), feature 4 = (0.531, 0.500, 0.561), feature 5 = (0.410, 0.384, 0.436), feature 6 = (0.336, 0.309, 0.363), feature 7 = (0.259, 0.239, 0.279), feature 8 = (0.218, 0.191, 0.245), feature 9 = (0.184, 0.150, 0.217), feature 10 = (0.146, 0.114, 0.177) (a); feature 1 = (0.967, 0.935, 0.999), feature 2 = (0.764, 0.741, 0.786), feature 3 = (0.569, 0.549, 0.590), feature 4 = (0.460, 0.435, 0.485), feature 5 = (0.354, 0.330, 0.377), feature 6 = (0.283, 0.256, 0.311), feature 7 = (0.216, 0.192, 0.241), feature 8 = (0.169, 0.145, 0.193), feature 9 = (0.129, 0.107, 0.150), feature 10 = (0.101, 0.077, 0.124) (b); feature 1 = (0.972, 0.949, 0.995), feature 2 = (0.833, 0.805, 0.860), feature 3 = (0.705, 0.677, 0.733), feature 4 = (0.564, 0.543, 0.584), feature 5 = (0.488, 0.463, 0.514), feature 6 = (0.408, 0.385, 0.431), feature 7 = (0.363, 0.334, 0.393), feature 8 = (0.292, 0.269, 0.314), feature 9 = (0.243, 0.222, 0.264), feature 10 = (0.221, 0.188, 0.254) (c). d, Histogram of the prediction error when training in non-LAC dataset (n = 569) and testing in LAC dataset (n = 1,486). e, Violin plot of the distribution and statistical comparison of training and testing with different regions using a two-sided permutation test without multiple comparisons (5,000 algorithm iterations) with a result of P < 1 × 10−15. Mean, q1, q3, whisker low, whisker high, minima and maxima values for violin plots are: LAC/non-LAC (−2.34, −6.07, 1.26, −13.25, 11.52, −20.08, 17.52); non-LAC/LAC (5.24, 1.95, 8.61, −5.24, 16.18, −12.73, 16.18). f, Violin plot of the distribution and statistical comparison of testing the models on females and males using a permutation test (5,000 iterations) with a result of P = 0.012. Mean, q1, q3, whisker low and whisker high values for violin plots are: male (3.66, 1.87, 7.83, −5.24, 16.18, −12.73, 16.18); female (6.19, 2.67, 9.39, −3.08, 15.52, −3.08, 15.52). This figure was partially created with BioRender.com (EEG device).
Fig. 4
Fig. 4. Groups, sex and macrosocial influences in brain-age gaps.
a,b, Violin plots for the distribution of prediction gaps for different groups and sex effects using (a) fMRI and (b) EEG datasets. Statistical comparisons were calculated using two-sided subsample permutation testing without multiple comparisons and with 5,000 algorithm iterations. c, Associations between macrosocial and disease disparity factors with brain-age gaps were assessed with a multi-method approach comprising SHAP values, feature importance (MDI) and permutation importance. Plots show the mean importance values for each method, along with their 99% CI, as well as the average R2 and Cohen’s f². *Features whose lower CI boundary does not cross zero. Shaded bars indicate significance across the three methods. We conducted a two-sided F-test to evaluate the overall significance of the regression models. The three models were significant: healthy controls LAC (R² = 0.37 (99% CI ±0.17), F² = 0.59 (99% CI ±0.21), r.m.s.e. = 6.9 (99% CI ±0.92), F = 138.78 (P < 1 × 10−15)); healthy controls non-LAC (R² = 0.41 (99% CI ±0.17), F² = 0.71 (99% CI ±0.21), r.m.s.e. = 6.57 (99% CI ±1.31), F = 135.91 (P < 1 × 10−15)) and total dataset (R² = 0.41 (99% CI ±0.12), F² = 0.71 (99% CI ±0.14), r.m.s.e. = 6.76 (99% CI ±0.89), F = 253.39 (P < 1 × 10−15)). The relevance of the features and their respective CI values are available in Supplementary Table 2. F, females; HC LAC, healthy controls from LAC; HC non-LAC, healthy controls from non-LAC; M, males. This figure was partially created with BioRender.com (fMRI and EEG devices).
Fig. 5
Fig. 5. Sensitivity analysis.
a, Violin plots for the distribution of data quality metrics of fMRI (healthy controls non-LAC, n = 967, MCI non-LAC n = 215, Alzheimer disease non-LAC n = 214, bvFTD non-LAC n = 190, HC LAC n = 477, MCI LAC n = 169, AD LAC n = 505, bvFTD LAC n = 216). b, Violin plots for the distribution of data quality metrics of EEG datasets (HC non-LAC n = 569, HC LAC n = 1486, MCI LAC n = 133, Alzheimer disease LAC n = 108, bvFTD LAC n = 57). Both a and b indicate null results between groups in terms of data quality. c, Linear regression effects of scanner type, evidencing that the fMRI data quality was not significantly associated with fMRI brain-age gaps differences (P = 0.184). d, fMRI brain-age gap differences across groups controlling for scanner differences. The statistical comparisons were calculated using two-sided subsample permutation testing with 5,000 iterations. NS, not significant; ODQ, overall data quality.
Extended Data Fig. 1
Extended Data Fig. 1. Associations of sex and gender inequality with brain-age gaps.
Multi-method approach comprising SHapley Additive exPlanations (SHAP) values, features and permutation importance. Plot shows the mean importance values for each method, along with their 99% confidence interval, as well as the average R-squared and Cohen’s f². Having a neurocognitive disorder, being female, and living in countries with larger gender inequality (particularly from LAC), were associated with higher brain age-gaps. The model was significant with R2 = 0.40 (99% CI ± 0.12), F2 = 0.66 (99% CI ± 0.14), RMSE = 6.85 (99% CI ± 0.82), F = 352.54, and p < 1e-15. We conducted a two-sided F-test to evaluate the overall significance of the regression model. The importance of the features and their respective confidence intervals can be found in Supplementary Table 1. LAC = Latin American and Caribbean countries.
Extended Data Fig. 2
Extended Data Fig. 2. Prediction gaps between fMRI datasets with either eyes open or eyes closed protocols.
No significant differences were observed between participants with open vs. closed eyes within the same groups (two-sided permutation test, without multiple comparisons, and with 5000 algorithm iterations). We included 124 healthy controls with closed eyes and 86 with open eyes, 269 Alzheimer’s disease participants with closed eyes and 164 with open eyes, and 88 behavioral variant frontotemporal dementia with closed eyes and 69 with open eyes. For HC eyes open vs AD eyes open p < 1e-15, for HC eyes closed vs AD eyes closed p < 1e-15, for AD eyes open vs bvFTD eyes open p = 0.026, for AD eyes closed vs bvFTD eyes closed p = 0.004. * p < 0.05, ** p < 0.01, *** p < 0.001. HC = healthy controls, AD = Alzheimer’s disease, bvFTD = behavioral variant frontotemporal dementia, EC = eyes closed, EO = eyes open.
Extended Data Fig. 3
Extended Data Fig. 3. Brain-age gaps between subsamples of mild cognitive impairment (MCI) and Alzheimer’s disease (AD) groups matched by chronological age.
Results were similar to those reported for the total MCI (n fMRI = 256, n EEG = 52) and AD (n fMRI = 254, n EEG = 52) datasets in Fig. 4a,b (two-sided permutation test, without multiple comparisons, and with 5000 algorithm iterations). For fMRI LAC p < 1e-5, for fMRI non-LAC p < 1e-5, for fMRI all p < 1e-5, for EEG all p values = 0.0024. fMRI LAC violin plots (Mean, q1, q3, whisker low, whisker high, minima, maxima): MCI = (10.550, 6.216, 14.748, −3.166, 26.203, −7.616, 29.185) and AD = (16.796, 12.591, 21.568, 1.133, 33.756, 1.133, 39.751). fMRI non-LAC: MCI = (10.518, 6.216, 14.565, −3.166, 26.203, −7.616, 29.185) and AD = (15.006, 11.076, 18.222, 1.133, 26.726, 1.133, 31.797). fMRI LAC: MCI = (10.702, 6.565, 15.222, −0.325, 23.516, −0.325, 23.516) and AD = (18.057, 13.681, 22.218, 2.916, 33.756, 2.916, 39.751). EEG all MCI = (11.813, 7.739, 15.804, 1.153, 24.775, 1.153, 24.775) and AD = (15.341, 12.727, 18.343, 6.751, 26.207, 0.348, 28.932). FMRI = functional magnetic imaging, EEG = electroencephalography, LAC = Latin American and Caribbean countries, HC = healthy controls, MCI = mild cognitive impairm)ent, AD = Alzheimer’s disease, bvFTD = behavioral variant frontotemporal dementia.

Update of

  • Brain clocks capture diversity and disparity in aging and dementia.
    Moguilner S, Baez S, Hernandez H, Migeot J, Legaz A, Gonzalez-Gomez R, Farina FR, Prado P, Cuadros J, Tagliazucchi E, Altschuler F, Maito MA, Godoy ME, Cruzat J, Valdes-Sosa PA, Lopera F, Ochoa-Gómez JF, Hernandez AG, Bonilla-Santos J, Gonzalez-Montealegre RA, Anghinah R, d'Almeida Manfrinati LE, Fittipaldi S, Medel V, Olivares D, Yener GG, Escudero J, Babiloni C, Whelan R, Güntekin B, Yırıkoğulları H, Santamaria-Garcia H, Lucas AF, Huepe D, Di Caterina G, Soto-Añari M, Birba A, Sainz-Ballesteros A, Coronel-Oliveros C, Yigezu A, Herrera E, Abasolo D, Kilborn K, Rubido N, Clark RA, Herzog R, Yerlikaya D, Hu K, Parra MA, Reyes P, García AM, Matallana DL, Avila-Funes JA, Slachevsky A, Behrens MI, Custodio N, Cardona JF, Barttfeld P, Brusco IL, Bruno MA, Sosa Ortiz AL, Pina-Escudero SD, Takada LT, Resende E, Possin KL, de Oliveira MO, Lopez-Valdes A, Lawlor B, Robertson IH, Kosik KS, Duran-Aniotz C, Valcour V, Yokoyama JS, Miller BL, Ibanez A. Moguilner S, et al. Res Sq [Preprint]. 2024 Jun 25:rs.3.rs-4150225. doi: 10.21203/rs.3.rs-4150225/v1. Res Sq. 2024. Update in: Nat Med. 2024 Dec;30(12):3646-3657. doi: 10.1038/s41591-024-03209-x. PMID: 38978575 Free PMC article. Updated. Preprint.

References

    1. Ibanez, A., Kringelback, M. & Deco, G. A synergetic turn in cognitive neuroscience of brain diseases. Trends Cogn. Sci.28, 319–338 (2024). - PMC - PubMed
    1. Tian, Y. E. et al. Heterogeneous aging across multiple organ systems and prediction of chronic disease and mortality. Nat. Med.29, 1221–1231 (2023). - PubMed
    1. Hou, Y. et al. Ageing as a risk factor for neurodegenerative disease. Nat. Rev. Neurol.15, 565–581 (2019). - PubMed
    1. Santamaria-Garcia, H. et al. Factors associated with healthy aging in Latin American populations. Nat. Med.29, 2248–2258 (2023). - PMC - PubMed
    1. Walters, H. Diverse factors shape healthy aging in Latin America. Nat. Aging3, 1175 (2023).

MeSH terms