. 2024 Oct;27(10):1880-1891.
doi: 10.1038/s41593-024-01737-w. Epub 2024 Aug 26.

Proteomic changes in Alzheimer's disease associated with progressive Aβ plaque and tau tangle pathologies

Affiliations

Proteomic changes in Alzheimer's disease associated with progressive Aβ plaque and tau tangle pathologies

Alexa Pichet Binette et al. Nat Neurosci. 2024 Oct.

Abstract

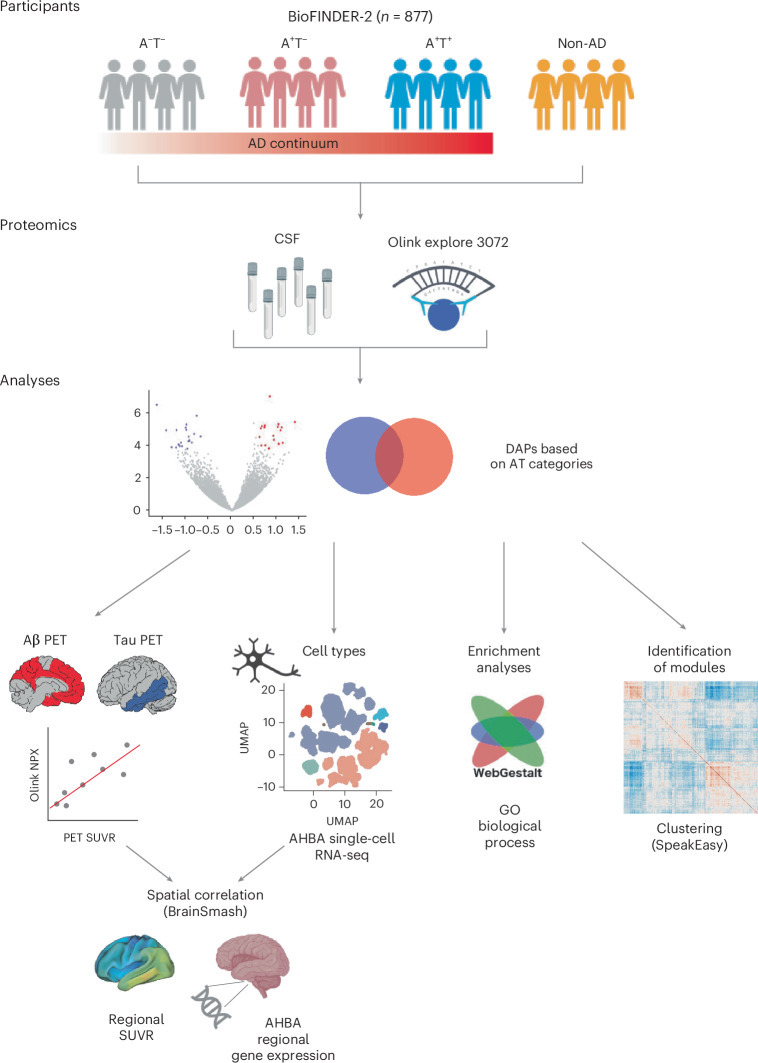
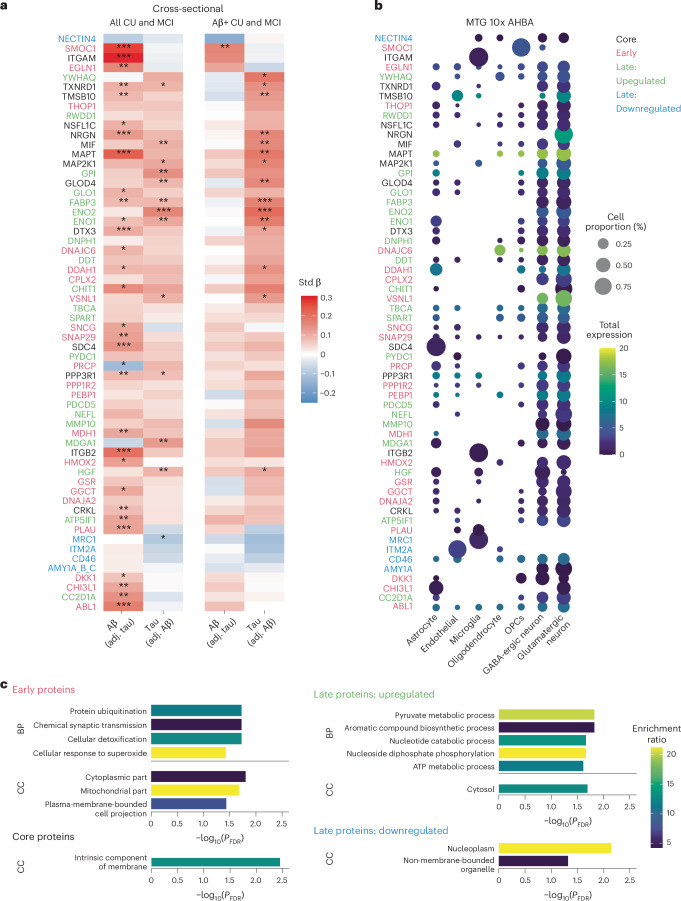
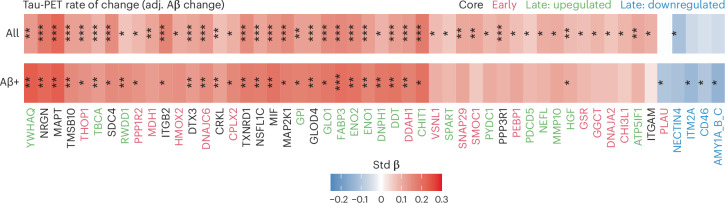
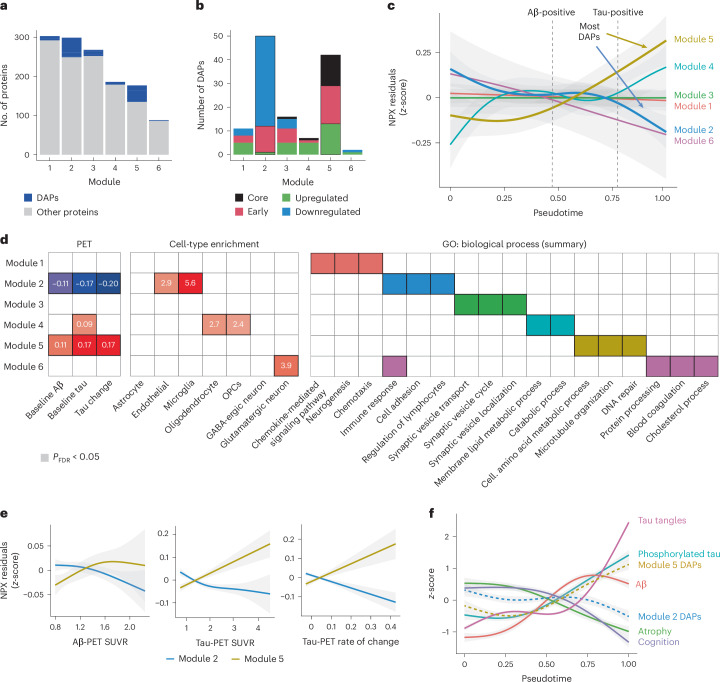
Proteomics can shed light on the dynamic and multifaceted alterations in neurodegenerative disorders like Alzheimer's disease (AD). Combining radioligands measuring β-amyloid (Aβ) plaques and tau tangles with cerebrospinal fluid proteomics, we uncover molecular events mirroring different stages of AD pathology in living humans. We found 127 differentially abundant proteins (DAPs) across the AD spectrum. The strongest Aβ-related proteins were mainly expressed in glial cells and included SMOC1 and ITGAM. A dozen proteins linked to ATP metabolism and preferentially expressed in neurons were independently associated with tau tangle load and tau accumulation. Only 20% of the DAPs were also altered in other neurodegenerative diseases, underscoring AD's distinct proteome. Two co-expression modules related, respectively, to protein metabolism and microglial immune response encompassed most DAPs, with opposing, staggered trajectories along the AD continuum. We unveil protein signatures associated with Aβ and tau proteinopathy in vivo, offering insights into complex neural responses and potential biomarkers and therapeutics targeting different disease stages.


Conflict of interest statement

O.H. has acquired research support (for the institution) from ADx, AVID Radiopharmaceuticals, Biogen, Eli Lilly, Eisai, Fujirebio, GE Healthcare, Pfizer and Roche. In the past 2 years, he has received consultancy/speaker fees from AC Immune, Amylyx, Alzpath, BioArctic, Biogen, Cerveau, Eisai, Eli Lilly, Fujirebio, Genentech, Merck, Novartis, Novo Nordisk, Roche, Sanofi and Siemens. S.P. has acquired research support (for the institution) from ki elements/ADDF. In the past 2 years, he has received consultancy/speaker fees from Bioartic, Biogen, Lilly and Roche. The remaining authors declare no competing interests.

Figures

Fig. 1
Fig. 1. Study design overview.
From all BioFINDER-2 participants with Olink proteomic data from CSF, we first assessed DAPs across the different A/T categories. From these DAPs, we then evaluated whether: (1) they were independently related to Aβ plaques or tau tangle pathology load (baseline PET) and rate of change (longitudinal PET); (2) the proteins’ regional gene expression in the brain matched the regional PET pattern; and (3) they were enriched in different cell types or biological processes using enrichment analyses. Last, we derived protein co-expression modules to investigate the overlap between such modules and the DAPs.
Fig. 2
Fig. 2. Differential protein abundance in CSF between AT comparisons.
a,b, Volcano plots depicting DAPs in different groups: AT (n = 352) versus A+T (n = 184) (a) and A+T versus A+T+ (n = 231) (b). Models included age, sex and mean overall protein level as covariates. The red line represents the threshold of PFDR < 0.01, above which we considered proteins for subsequent analyses. Only the top proteins are labeled for legibility on the volcano plots. c, Venn diagram summarizing the comparisons shown in a and b based on proteins significant at PFDR < 0.01 in the main cohort, BioFINDER-2. d, Volcano plots depicting DAPs in BioFINDER-1 (validation cohort, Olink proteomics) between A (n = 415) and A+ (n = 292) individuals, including age, sex and mean overall protein level as covariates. e, Volcano plots depicting DAPs in ADNI (validation cohort, SomaLogic proteomics) between A (n = 212) and A+ (n = 215), including age and sex as covariates. Some proteins appear twice given that different aptamers measured the same protein. A or A+ status was based on Aβ-PET. In d and e, the analysis was restricted to proteins that overlapped with those available in BioFINDER-2 (BF2). All standardized β values displayed come from two-sided linear regressions and all P values were adjusted for FDR.
Fig. 3
Fig. 3. Characterization of DAPs with PET, cell type and functional enrichment.
a, Standardized (Std) β coefficients from linear models relating AD fibrillar pathology (Aβ- and tau-PET SUVR both included as independent variables) to the CSF protein levels. Models included age, sex and mean overall protein level as covariates. Only proteins with significant associations are reported in the figure. b, Proportion of expression by cell type from single-cell transcriptomics data from the middle temporal gyrus for all proteins shown in a. To improve legibility, only average expressions >5% are displayed. c, Summary terms from functional enrichment analyses using GO databases from the different categories of proteins. For enrichment analyses the 1,331 Olink proteins were used as background. All linear regressions performed were two sided and P values were adjusted for FDR. *PFDR < 0.05, **PFDR < 0.01, ***PFDR < 0.001. adj., adjusted.
Fig. 4
Fig. 4. DAPs related to longitudinal tau-PET.
Standardized β coefficients from linear models relating accumulation of AD fibrillar pathology (Aβ- and tau-PET rate of change both included as independent variables) to the CSF protein levels. Models included age, sex and mean overall protein level as covariates. Only proteins with significant associations with tau-PET rate of change are displayed, because there were no associations with Aβ-PET rate of change. The top row included all CU and MCI participants and the bottom row only Aβ-positive CU and MCI participants (as in Fig. 3a). All linear regressions performed were two sided and P values were adjusted for the FDR. *PFDR < 0.05, **PFDR < 0.01, ***PFDR < 0.001.
Fig. 5
Fig. 5. Differentially expressed proteins in non-AD neurodegenerative diseases and trajectories of key proteins.
a,b, Volcano plots depicting DAPs in different groups: A+T+ (n = 231) versus non-AD neurodegenerative diseases (n = 110) (a) and AT (n = 352) versus non-AD neurodegenerative diseases (b). Models included age, sex and mean overall protein level as covariates. The red line represents the threshold of PFDR < 0.01, above which we considered proteins for subsequent analyses. c,d, Venn diagram summarizing the comparisons shown in a and b along with those based on the A/T categories in Fig. 2a,b based on proteins significant at PFDR < 0.01. The red text corresponds to ‘early’ proteins, the black to ‘core’ proteins and the blue to ‘late’ proteins as per categories defined in previous analyses. c, The DAPs highlighted are those related to AD. d, The DAPs highlighted are those at the intersections between AD and non-AD neurodegenerative disease. All standardized β values displayed come from two-sided linear regressions and all P values were adjusted for the FDR. e, Box plots of exemplary DAPs between the different A/T categories as well as non-AD neurodegenerative diseases. The values correspond to residual values after regressing out age, sex and mean overall protein level. In all box plots, the box limits represent the first and third quartiles and the whisker extends to 1.5× the interquartile range. The red dot represents the mean and the red line extends ±1 s.d. f, Depiction of steps and spectral embedding from which the inferred trajectory of AD pathology (pseudotime) was estimated. g, All proteins shown in f plotted against the pseudotime using GAMs. The first dashed line corresponds to Aβ positivity and the second to tau positivity. Error bands around the data correspond to the 95% confidence interval (CI).
Fig. 6
Fig. 6. Biological modules derived from protein co-expression.
a, Bar plots showing the number of proteins in each module derived based on protein co-expression. b, Bar plots showing the distribution of the DAPs in each protein co-expression module. c, Average protein level from each module plotted against the pseudotime using GAMs. d, Summary figure of associations with baseline Aβ- and tau-PET load as well as tau-PET rate of change, cell-type enrichment and summary terms from functional analyses of biological processes for each module. For simplicity, only significant results from two-sided regressions (PFDR < 0.05; P values were adjusted for the FDR) are displayed in colored cells. e, Average protein level from modules 2 and 5 (the two modules containing most DAPs) plotted against Aβ- and tau-PET load (baseline) and tau-PET rate of change (longitudinal) using GAMs. f, Key AD markers along with the average DAPs from modules 2 and 5 plotted against the pseudotime using GAMs. The tau tangles were measured from tau-PET SUVR in a temporal meta-ROI, Aβ and phosphorylated tau were measured, respectively, from Elecsys CSF Aβ40/Aβ42 and p-tau181, atrophy was measured from cortical thickness in the temporal lobe and cognition was measured from the MMSE total score. In all panels, error bands around the data correspond to the 95% CI.
Extended Data Fig. 1
Extended Data Fig. 1. Correlations between regional gene expression and PET patterns.
Differentially abundant proteins for which the regional gene expression (Allen Human Brain data) was related to either the regional tau- (a) or Aβ-PET (b) SUVR deposition. Only proteins significant after accounting for spatial autocorrelation and across two brain atlases (Desikan-Kiliany and Schaefer) are displayed. The only exception is MAPT (in gray), which was only significant in one atlas. CDH6 is in red as it is the only one with a negative correlation. Correlation coefficients and significance (two-sided test, no adjustment for multiple corrections) are shown from the Desikan-Kiliany atlas. See the Supplementary material for all detailed methods and results. * corresponds to p < 0.05, ** corresponds to p < 0.01.
Extended Data Fig. 2
Extended Data Fig. 2. Aβ and tau PET association in separate models.
a, b, Standardized beta coefficients from linear models relating AD fibrillar pathology at baseline (Aβ- and tau-PET SUVR included separately in different models) and over time (Aβ- and tau-PET rate of change included separately in different models) to the CSF protein levels of the 128 differentially expressed proteins. Models included age, sex, mean overall protein level as covariates. There was no significant associations with Aβ-PET rate of change, and thus those results are not displayed. Results in panel a included all CU and MCI participants. Results in panel b were restricted to Aβ-positive CU and MCI participants. All linear regressions performed were two-sided, and p-values were adjusted for false discovery rate. * corresponds to pFDR < 0.05, ** corresponds to pFDR < 0.01, *** corresponds to pFDR < 0.001 Aβ = beta-amyloid; CU = cognitively unimpaired; MCI = mild cognitive impairment.
Extended Data Fig. 3
Extended Data Fig. 3. Average gene expression levels across cell types in the Allen Brain dataset.
Proportion of gene expression by cell type from single-cell transcriptomics data from the middle temporal gyrus from the differentially expressed proteins that were not included in Fig. 3b. To improve legibility, only average expression above 5% are displayed. Transcriptomics data was downloaded from the reference donors of the Allen Brain Institute.
Extended Data Fig. 4
Extended Data Fig. 4. Average gene expression levels across cell types in the ROSMAP single nuclei data.
Proportion of gene expression by cell type from single-nuclei data from the dorsolateral prefrontal gyrus of 427 ROSMAP donors. The 128 DAPs are depicted on the y-axis. Average expression was calculated across the whole sample (left column for each cell type, ‘Whole’), only A− donors (middle column for each cell type, ‘Neg’) and only A+ donors (right column for each cell type, ‘Pos’). The A− or A+ status was defined based on the CERAD score (A− being No AD or Possible; A+ being Definite or Probable). Transcriptomics data was accessed from Mathys et al, Cell, 2023.
Extended Data Fig. 5
Extended Data Fig. 5. Cell-type enrichment analyses.
a, b, Cell-type enrichment analyses based on single-cell transcriptomics data from the middle temporal gyrus based on the different categories of differentially expressed proteins (a) and taking all proteins part of the different biological modules (b). Bootstrap enrichment tests were performed, and all p-values were adjusted for false discovery rate. * corresponds to pFDR < 0.05, ** corresponds to pFDR < 0.01.
Extended Data Fig. 6
Extended Data Fig. 6. SMOC1 characterization in postmortem human tissue.
a, Differential gene expression for SMOC1 (strongest protein associated with Aβ) across all cell types and with five measures of AD pathology was accessed from Mathys et al, Cell, 2023, based on single-nuclei data from 427 ROSMAP donors. Only associations (two-sided regressions) surviving correction for false discovery rate across all cell types are depicted. Amyloid plaque and tau tangle loads were quantified with immunohistochemistry (IHC) (AT8 antibody for tau) and averaged across 8 brain regions. Diffuse plaques, neuritic places and neurofibrillary were assessed with silver-stained slides in 5 brain regions. Overall there were higher SMOC1 levels with greater postmortem AD pathology predominantly in OPCs, and to some extent in astrocytes and some inhibitory neuronal subtypes, reflecting the cell types where this gene is mainly expressed. b,c Representative images of entorhinal cortex from a nondemented control (NC) (b) and an Alzheimer’s disease (AD) (c) patient stained against SMOC1 (red) and the nuclei marker DAPI (blue). d, Optical density (OD) area fraction of SMOC1 in entorhinal cortex in six NC and six AD patients. Each point represents the mean of the OD area fraction in six images captured from each case. The data was analyzed using 2-sided student t-test. Significant difference at ***p < 0.001. e-g, Example of double staining against SMOC1 (red) and Methoxy-04 staining plaques (blue). e, SMOC1 staining. f, Aβ plaques staining. g, Merged image of SMOC1 and plaques. SMOC1 were found in some (long arrow), but not all (short arrow) Methoxy-04 stained plaques, which were found in three out of six AD cases. Overall, we found higher SMOC1 levels in brain tissue from AD cases compared to controls, with SMOC1 localized in amyloid plaques. Scale bar in (b-c) = 10 μm and in (g) = 50μm.
Extended Data Fig. 7
Extended Data Fig. 7. Trajectories of established AD-related proteins.
a, Box plots of four key AD-related proteins part of the differentially expressed proteins between the different AT categories (A-T-: n = 352; A + T−: n = 184; A + T + : n = 231) and non-AD neurodegenerative diseases (n = 110). Values correspond to residual values after regressing out age, sex and mean overall protein level. In all box plots, the box limits represent the first and third quartile, and the whisker extends to 1.5 time the interquartile range. The red dot represents the mean and the red line extends ±1 standard deviation. b, Proteins shown in panel a plotted against the pseudotime using generalized additive models. Error bands around the data correspond to the 95% confidence interval.
Extended Data Fig. 8
Extended Data Fig. 8. Microglia states across the different protein modules.
a, Correspondence of different microglial states from human single-cell data from Olah et al, Nature Communications, 2020 (stacked barplots) across the different BioFINDER-2 Proteomic modules (x-axis). For simplicity, all homeostatic states have been grouped together, and clusters 5, 6 and 7 have also been grouped together due to their high similarity as described in Olah et al. b, c, The predominance of microglia-related proteins in Module 2 was also confirmed in comparing two other sets of microglia genes derived from human aged brains: Patrick et al, Translational Psychiatry, 2021 (b) and Olah et al, Nature Communications, 2018 (c). Number of microglial proteins identified from two previous publications (y-axis) across the different Olink modules (x-axis). The number of proteins overlapping between Olink data and each of the three microglia data is reported in the titles.

References

    1. Braak, H. & Braak, E. Neuropathological stageing of Alzheimer-related changes. Acta Neuropathol.82, 239–259 (1991). - PubMed
    1. Duyckaerts, C., Delatour, B. & Potier, M. C. Classification and basic pathology of Alzheimer disease. Acta Neuropathol.118, 5–36 (2009). - PubMed
    1. Jack, C. R. Jr. et al. Tracking pathophysiological processes in Alzheimer’s disease: an updated hypothetical model of dynamic biomarkers. Lancet Neurol.12, 207–216 (2013). - PMC - PubMed
    1. Bellenguez, C. et al. New insights into the genetic etiology of Alzheimer’s disease and related dementias. Nat. Genet.54, 412–436 (2022). - PMC - PubMed
    1. van der Kant, R., Goldstein, L. S. B. & Ossenkoppele, R. Amyloid-beta-independent regulators of tau pathology in Alzheimer disease. Nat. Rev. Neurosci.21, 21–35 (2020). - PubMed