. 2024 Sep;633(8030):710-717.
doi: 10.1038/s41586-024-07809-y. Epub 2024 Aug 26.

Birth of protein folds and functions in the virome

Affiliations

Birth of protein folds and functions in the virome

Jason Nomburg et al. Nature. 2024 Sep.

Erratum in

Abstract

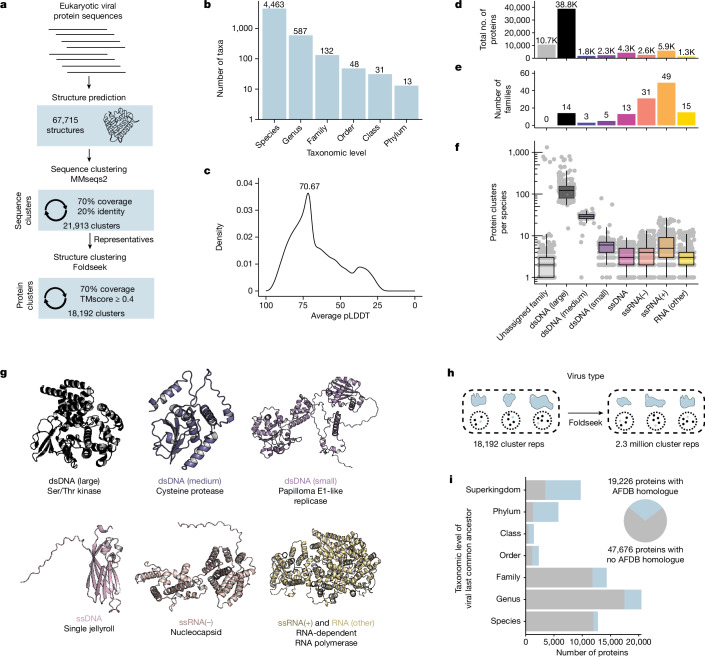
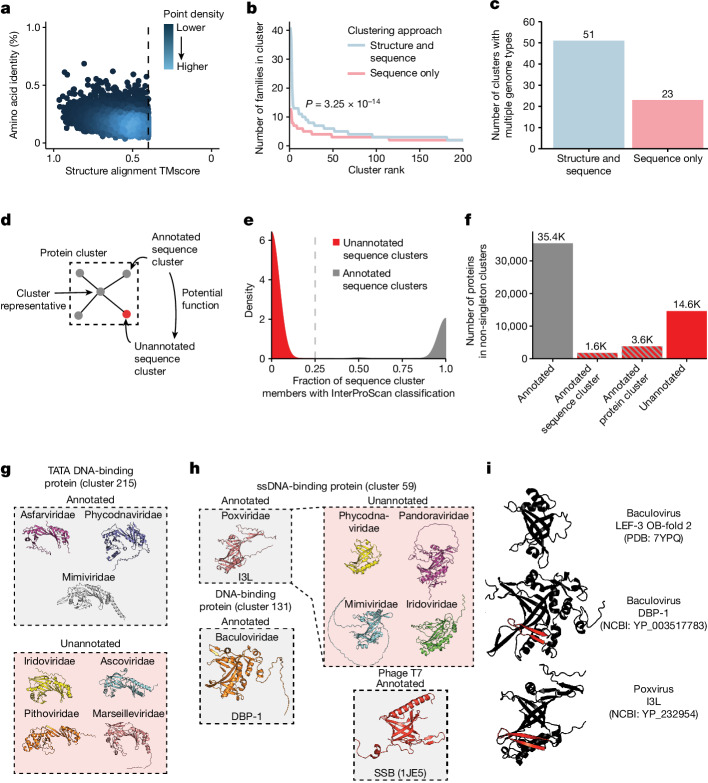
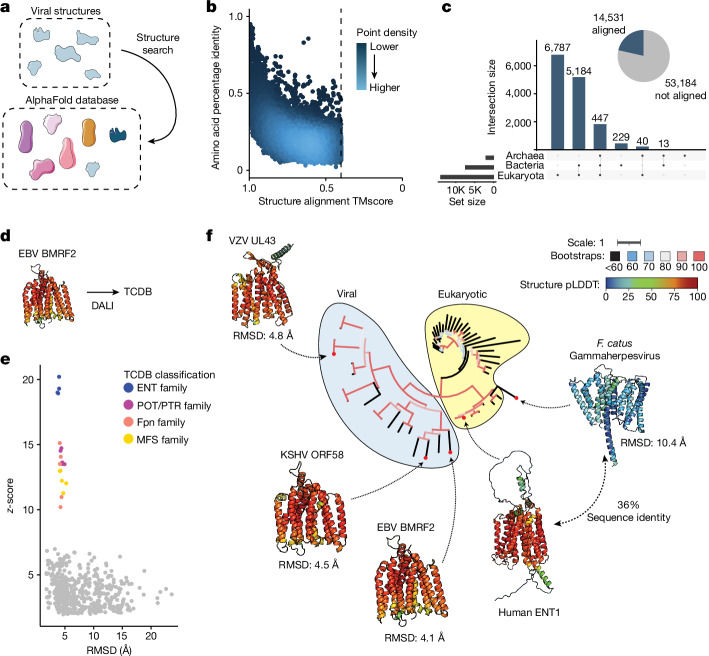
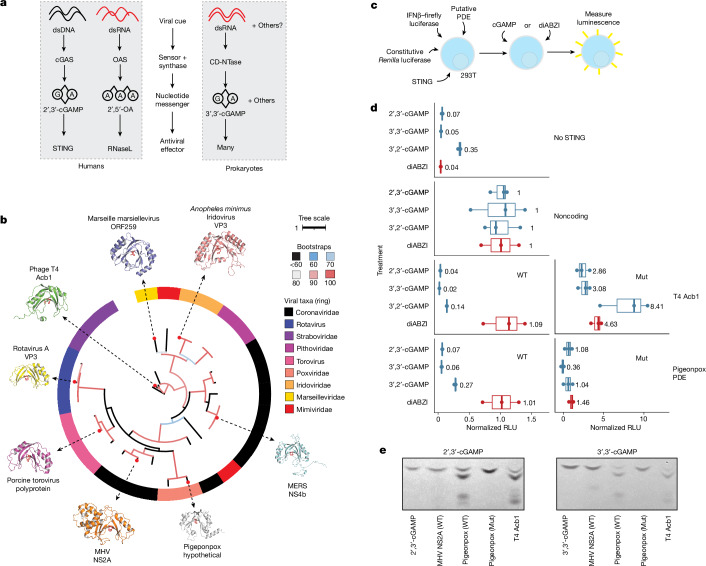
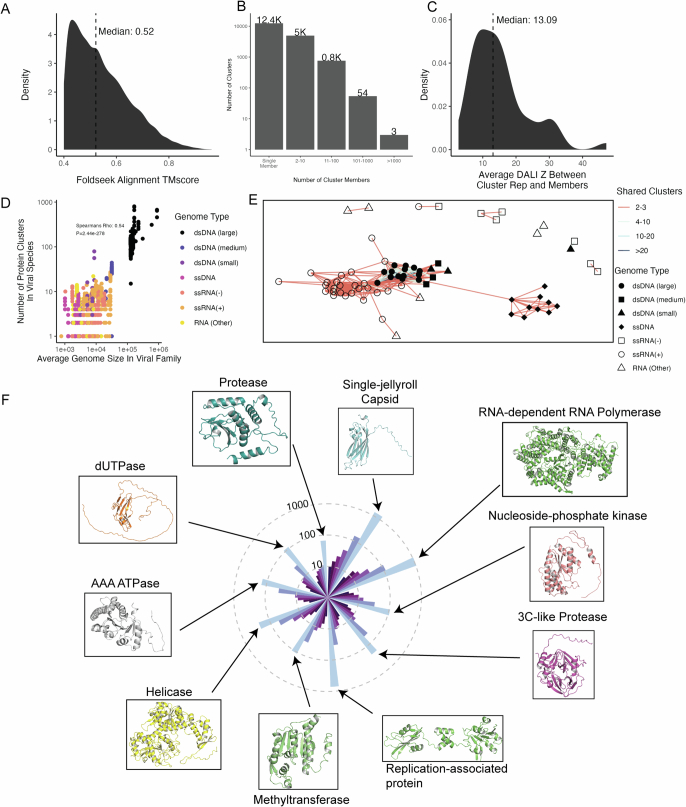
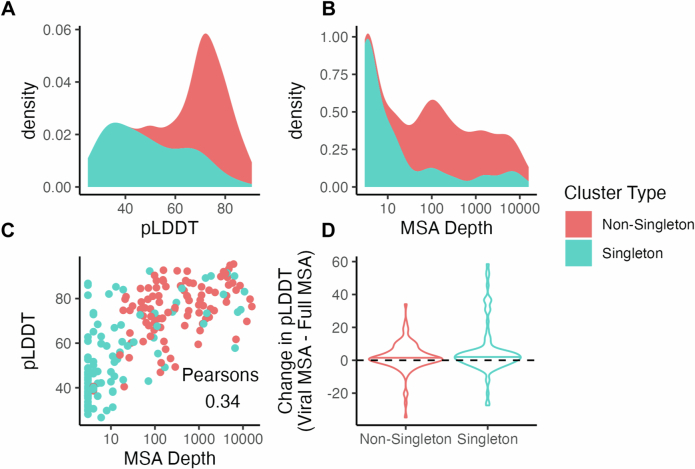
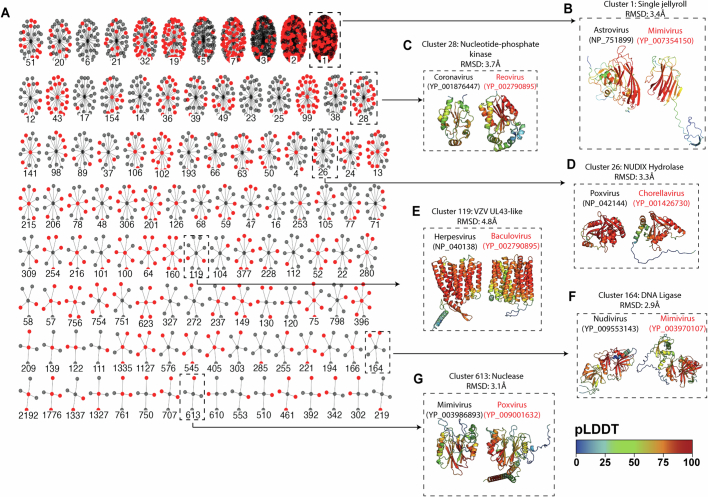
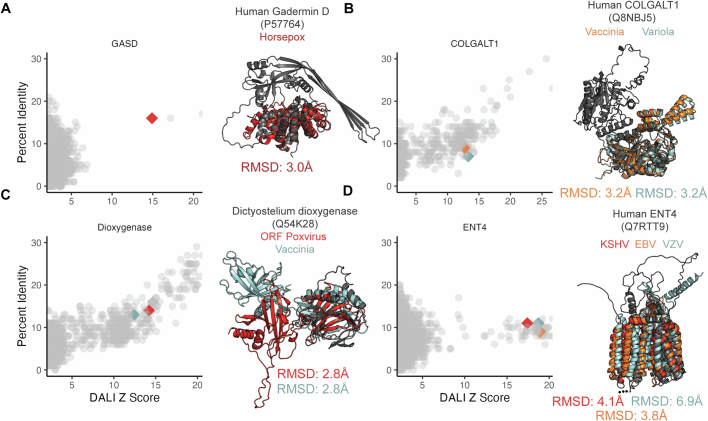
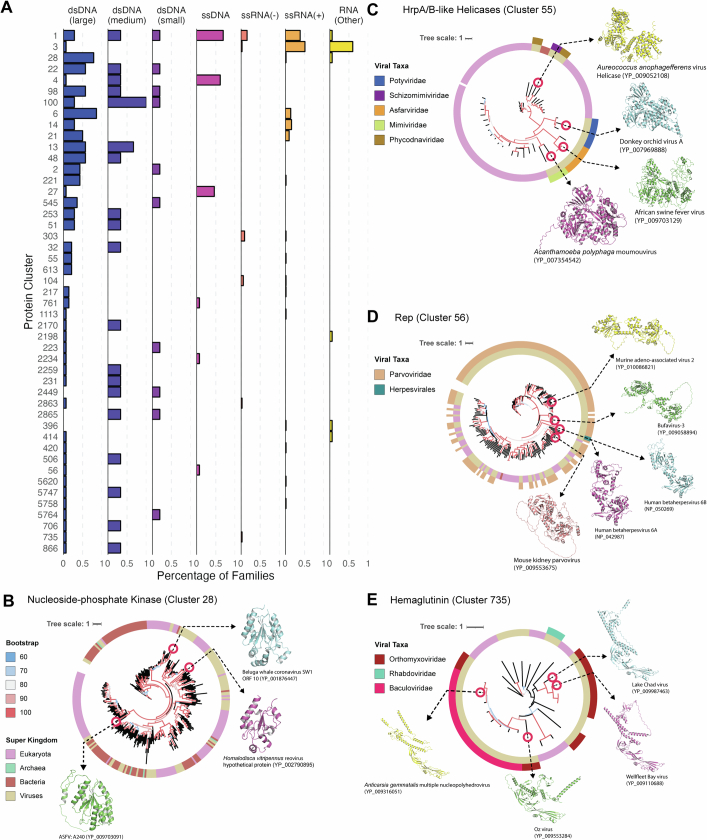
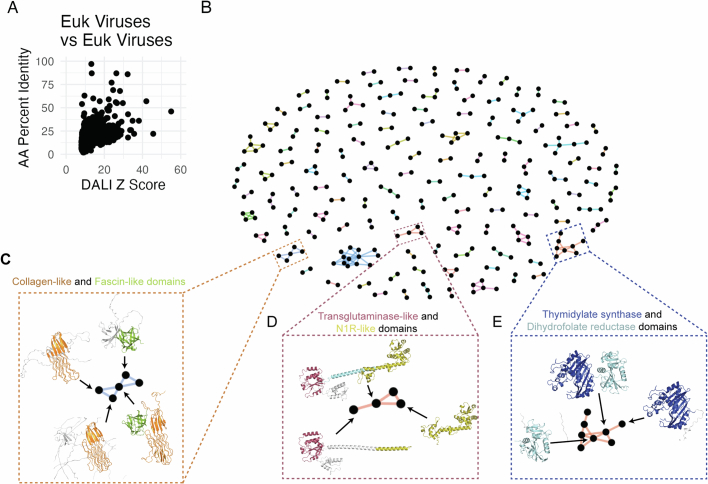
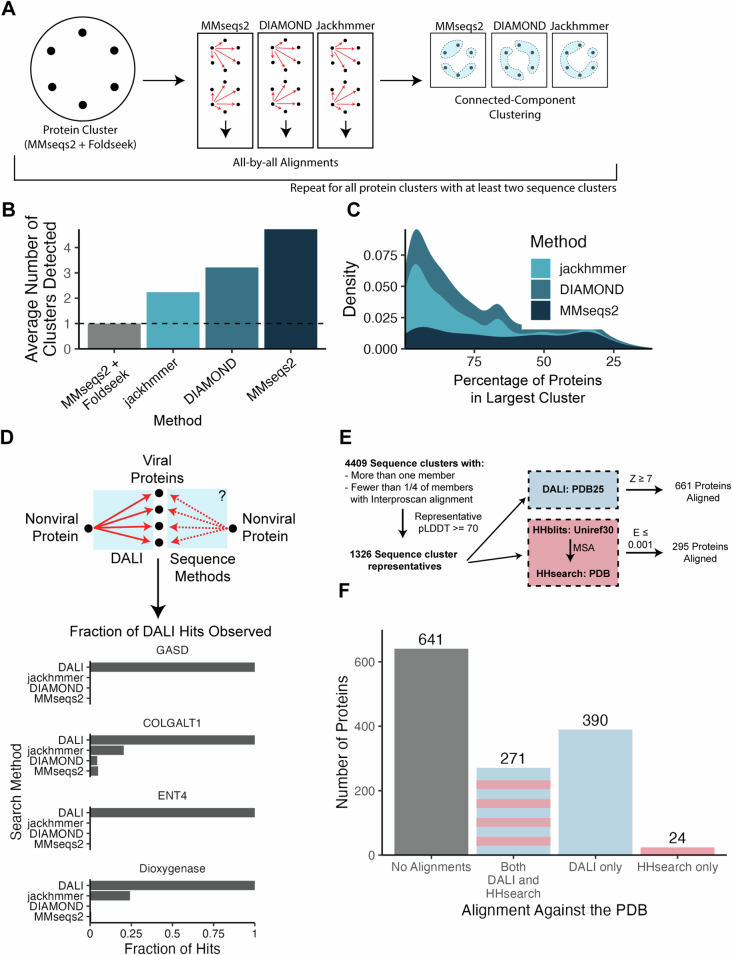
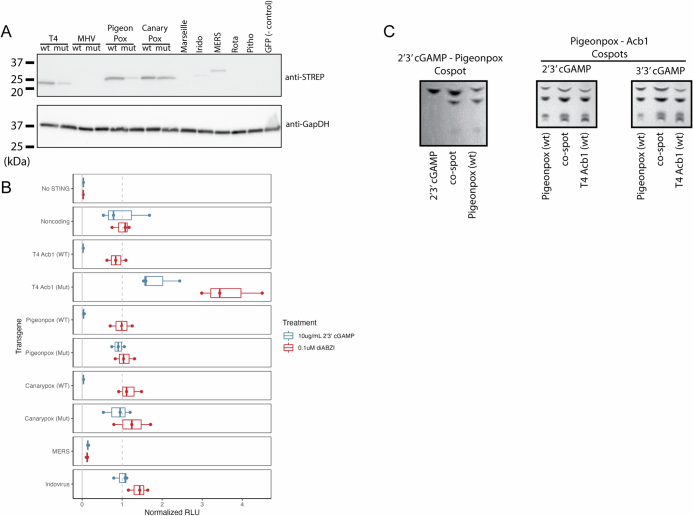
The rapid evolution of viruses generates proteins that are essential for infectivity and replication but with unknown functions, due to extreme sequence divergence1. Here, using a database of 67,715 newly predicted protein structures from 4,463 eukaryotic viral species, we found that 62% of viral proteins are structurally distinct and lack homologues in the AlphaFold database2,3. Among the remaining 38% of viral proteins, many have non-viral structural analogues that revealed surprising similarities between human pathogens and their eukaryotic hosts. Structural comparisons suggested putative functions for up to 25% of unannotated viral proteins, including those with roles in the evasion of innate immunity. In particular, RNA ligase T-like phosphodiesterases were found to resemble phage-encoded proteins that hydrolyse the host immune-activating cyclic dinucleotides 3',3'- and 2',3'-cyclic GMP-AMP (cGAMP). Experimental analysis showed that RNA ligase T homologues encoded by avian poxviruses similarly hydrolyse cGAMP, showing that RNA ligase T-mediated targeting of cGAMP is an evolutionarily conserved mechanism of immune evasion that is present in both bacteriophage and eukaryotic viruses. Together, the viral protein structural database and analyses presented here afford new opportunities to identify mechanisms of virus-host interactions that are common across the virome.


Conflict of interest statement

The Regents of the University of California have patents issued and pending for CRISPR technologies on which J.A.D. is an inventor. J.A.D. and J.N. are listed as inventors on a patent filing related to DNA-binding proteins characterized in this work. J.A.D. is a cofounder of Azalea Therapeutics, Caribou Biosciences, Editas Medicine, Evercrisp, Scribe Therapeutics, Intellia Therapeutics and Mammoth Biosciences. J.A.D. is a scientific advisory board member at Evercrisp, Caribou Biosciences, Intellia Therapeutics, Scribe Therapeutics, Mammoth Biosciences, The Column Group and Inari. She also is an advisor for Aditum Bio. J.A.D. is Chief Science Advisor to Sixth Street, a Director at Johnson & Johnson, Altos and Tempus, and has research projects sponsored by Apple Tree Partners. The other authors declare no competing interests.

Figures

Fig. 1
Fig. 1. The structural proteome of eukaryotic viruses.
a, Pipeline for protein clustering. Protein sequences from eukaryotic viruses were folded using ColabFold. Protein sequences were clustered to 70% coverage and 20% identity. The predicted structures of the representatives of each cluster were then aligned and clustered together with a requirement of 70% coverage across the structural alignment and a TMscore ≥0.4. This resulted in a final set of 18,192 clusters. b, Taxonomic distribution of the dataset. Each column indicates the number of taxa present. c, Distribution of the average pLDDT of all structures in the dataset. df, Viral families were classified by genome type, and the total number of proteins (d), viral families (e) and protein clusters per species (f) are indicated. In box plots, the centre line is the median, box edges delineate 25th and 75th percentiles, and whiskers extend to the highest or lowest point up to 1.5 times the inter-quartile range. g, Protein structures representing the protein cluster that is encoded by the highest number of viral families of each genome type. h, Foldseek was used to align a single representative protein from each viral protein cluster against 2.3 million clusters generated from the AlphaFold database. i, Left, taxonomic level of the last common ancestor of each viral protein cluster was determined. For example, if a protein cluster is encoded by viruses from different orders but the same class, they are placed in the class row. Blue indicates that proteins belong to a cluster with an analogue in the AlphaFold database (AFDB), whereas grey indicates that proteins belong to a cluster without an analogue in the AlphaFold database. Right, pie chart indicating the total number of proteins that belong to clusters whose representatives aligned to the AlphaFold database (blue) or did not align (grey).
Fig. 2
Fig. 2. Structural alignments link annotated and unannotated sequence clusters.
a, Structure and sequence similarity between protein cluster representatives. Each dot indicates a single alignment. b, Viral family diversity in clusters generated by structure and sequence or sequence alone. The top 200 clusters by number of members were plotted. The P value is from a two-sided Wilcoxon rank-sum test. c, The number of clusters that contain proteins from viruses with different genome types when using structure and sequence or sequence only. d, Structural similarity between InterProScan annotated and unannotated protein clusters has the potential to provide functional information. e, The percentage of sequence cluster members with an InterProScan classification is plotted against the density of sequence clusters with each percentage. Sequence clusters with fewer than 25% of members having InterProScan classifications were considered unannotated sequence clusters. f, Counts of proteins annotated by InterProScan or in a protein or sequence cluster with a protein annotated by InterProScan. g, Cluster 215 contains TATA DNA-binding proteins. NCBI Protein accessions: YP_009703143, YP_008052367, YP_003969792, YP_009021140, YP_009701471, YP_009000953 and YP_009094710. h, Cluster 59 contains a widespread family of ssDNA-binding proteins. NCBI Protein accessions: YP_232954, NP_048769, YP_008437003, YP_003970005, YP_009272775 and YP_003517783. These folds share an oligonucleotide fold with phage T7 single-stranded binding protein. i, I3L-like eukaryotic ssDNA-binding proteins contain a distinct N-terminal beta sheet that is absent in other OB-folds such as those present in baculovirus LEF-3.
Fig. 3
Fig. 3. Structural similarity across kingdoms of life reveals potential protein function.
a, Illustration of the approach. The database of viral protein predicted structures was aligned against the AlphaFold database of proteins from 48 organisms, including members of the bacterial, eukaryote and archaeal superkingdoms. b, The amino acid percentage identity and Foldeseek TMscore; each point indicates a single alignment. For viral proteins with more than five alignments, the top five alignments by TMscore are plotted. c, Right, pie chart indicating the number of viral proteins that do or do not have an alignment against the AlphaFold database. Left, UpSet plot indicating, for those viral proteins with alignments against the AlphaFold database, the number that align against members of each superkingdom. d, EBV BMRF2 (YP_001129455), which has a nucleoside transporter-like fold, was used as a query for a DALI search against the TCDB. e, Alignments between EBV BMRF2 and structures classified in the TCDB. Each dot indicates a single DALI alignment. Proteins with at least one alignment with z ≥ 10 are coloured. RMSD, root mean squared deviation as determined by DALI. f, A phylogenetic tree of eukaryotic and herpesvirus nucleoside transporters. The listed RMSD values were determined by DALI alignment between human ETN1 and each viral nucleoside transporter. The tree scale is substitutions per residue. Structures are coloured by pLDDT (red, higher; blue, lower). The tree is coloured according to bootstrap values. Accessions: F. Catus gammaherpesvirus, YP_009173937; VZV UL43, NP_040138; EBV BMRF2, YP_001129455; KSHV ORF58, YP_001129415; human ENT1, XP_011512643.
Fig. 4
Fig. 4. LigT-like PDEs are frequently used to subvert host immunity.
a, Some innate immune pathways in eukaryotes and prokaryotes rely on a viral synthase sensor that detects virus-associated molecular patterns such as dsDNA or dsRNA and generates a nucleotide second messenger that stimulates an antiviral effector. b, A phylogenetic tree showing the polyphyletic lineages of LigT-like PDEs. Shaded boxes indicate viral taxa. The red residues in each protein structure are the conserved catalytic histidines. Units are substitutions per residue. The tree is coloured according to bootstrap values. NCBI Protein accessions: YP_008798230, YP_002302228, YP_009021100, YP_003406995, NP_049750, YP_009047207, YP_009046269 and YP_009824980. c, HEK 293T cells were transfected with constructs encoding STING, firefly luciferase driven by an IFNB promoter, a constitutively expressed Renilla luciferase, and a transgene. After 5 h, cells were treated with 10 μg ml−1 cGAMP or 0.1 μM diABZI. Around 24 h after the first transfection, luminescence of the firefly and Renilla luciferases was measured. d, Pigeonpox PDE prevents STING activation by cGAMP isomers. On the x axis, luminescence in relative luminescence units (RLU) is normalized to the RLU from cells transfected with noncoding vector and treated with the same STING agonist. RLUs were initially normalized as firefly RLU/Renilla RLU. Mut indicates mutations of the catalytic histidines. In box plots, the centre line is the median, box edges delineate 25th and 75th percentiles, and whiskers extend to the highest or lowest point up to 1.5 times the inter-quartile range. Data are from one biological replicate and three wells per condition. e, 2′,3′-cGAMP or 3′,3′-cGAMP was incubated with indicated wild-type or catalytic histidine mutant PDE proteins. Degradation of each cGAMP isomer was visualized by TLC. Uncropped TLC images are presented in Supplementary Fig. 1. Source Data
Extended Data Fig. 1
Extended Data Fig. 1. Distribution of protein clusters across viral families.
A. Foldseek was used to align all virus sequence cluster representatives against one another, and alignments with a TMscore below 0.4 were removed. This plot shows the distribution of alignment TMscores, with the X axis indicating the TMscore and the Y axis indicating the density (or “proportion”) or alignments with each TMscore. B. The distribution of proteins amongst sequence clusters. The X axis indicates the size of each cluster, while the Y axis indicates the number of clusters of that size. C. For each protein cluster with at least 100 members, the cluster representative was aligned with DALI against all cluster members. Clusters that contained members with an average length of 150 residues or less were excluded, and members that did not align to the representative were assigned a Z score of 0. The distribution of average Z scores for each cluster is plotted, with the median cluster-averaged indicated. X axis indicates the DALI Z score for each cluster, while the Y axis indicates the density (or proportion) of clusters with each average DALI Z score. D. Relationship between the number of protein clusters encoded by a viral species (Y axis) and the average genome size of its family in nucleotides (X axis). Each dot is a viral species, and colors indicate the genome type. The spearman’s (two-sided) Rho is 0.54, with a P value < 2.2e-16, indicating a strong correlation. E. Each node represents a single viral family, with the shape and color indicating the genome type of that family. The color of edges between the nodes indicates the number of shared protein clusters between each pair of families. Only those family-family pairs with at least 2 shared protein clusters are plotted. F. Protein clusters were ordered by their phylogenetic diversity of their members (e.g. # phyla > # classes > # orders >… # species) and the top 10 clusters were plotted. Bars are colored based and ordered on decreasing taxonomic level, with phyla as dark blue on the far left and species as bright blue on the far right of each stack.
Extended Data Fig. 2
Extended Data Fig. 2. MSA generation against the full Colabfold MMseqs2 Database.
A. The protein representative for the top 100 protein clusters by size and from 100 random singleton clusters were selected, MSAs were generated against the full Colabfold MMSeqs2 database, and structures were predicted from this new MSA. The distribution of pLDDT values for structures from singleton (blue) or non-singleton (orange) clusters are plotted. The X axis indicates the pLDDT, while the Y axis indicates the density (or proportion) of proteins that have the indicated pLDDT value. B. The distribution of MSA depths is plotted for singleton (blue) and non-singleton (orange) clusters. The X axis indicates MSA depth and is log scale, while the Y axis indicates the density (or proportion) of proteins that have the indicated MSA depth. MSA depth is defined as the number of sequences in the MSA. C. For each protein, its pLDDT is plotted on the Y axis while its MSA depth is plotted on the X axis. Each dot is a protein, and the dots are colored according to whether they are from a singleton (blue) or non-singleton (orange) cluster. Pearsons (two-sided) correlation is 0.34 (95 percent confidence interval: 0.2137995, 0.4615760), P value 8.164e-07. D. For each of the 200 proteins studied, the average pLDDT of its structure created with the full Colabfold MSA is subtracted from its average pLDDT when folded with the viral MSA. This change is plotted on the Y axis, where a value above 0 indicates the viral MSA yielded a higher average pLDDT. The X axis indicates whether the proteins are from non-singleton or singleton clusters. The bars in each violin plot indicate the median of the plotted population.
Extended Data Fig. 3
Extended Data Fig. 3. Many unannotated proteins have structural similarity to annotated protein clusters.
A. Many protein clusters contain a mix of annotated and unannotated sequence clusters. Each “wheel” of nodes indicates a protein cluster, with individual nodes representing individual sequence clusters. Each sequence cluster node is colored based on if it is annotated (gray) or unannotated (red). All protein clusters with at least one annotated and one unannotated protein cluster are shown. Numbers below each wheel indicate the cluster ID. B-G. (Left) A network of sequence clusters that belong to each protein cluster, where nodes that are red are unannotated and those that are gray are annotated. The centroid is the protein cluster representative. (Right) Members of annotated and unannotated sequence clusters are highlighted, where the structure of an annotated protein (left) is compared to the structure of an unannotated protein (right). Proteins are colored based on pLDDT, with red indicating higher pLDDT and blue indicating lower pLDDT. The RMSD between the two structures is indicated.
Extended Data Fig. 4
Extended Data Fig. 4. Structural similarities between viral and non-viral proteins.
A-D. Specific non-viral hits from the Alphafold Foldseek search were aligned against the viral predicted structure database using DaliLite, and alignments against proteins from human pathogens were selected. (Left) The Y axis indicates the percentage amino acid identity, and the X axis indicates the Dali Z score. Each dot indicates a single alignment. Each point indicates an alignment, with the points corresponding to the proteins highlighted on the right as diamonds and colored consistently with their protein structures. (Right) The structure of the non-viral protein query is present in black. A superposition of selected protein clusters is shown, with the RMSD of each viral protein vs the non-viral protein indicated. Protein accessions are as follows: GASD: (Horsepox-ABH08278). COLGALT1: (Vaccinia-YP_232983; Variola-NP_042130). Dioxygenase: (ORF Poxvirus-NP_957891; Vaccinia-YP_232906). ENT4: (KSHV-YP_001129415; VZV-NP_040138; EBV-YP_401658).
Extended Data Fig. 5
Extended Data Fig. 5. Horizontal gene transfer drives the emergence of taxonomically-diverse protein clusters.
A. Protein clusters were ranked as follows: 1) by the number of genome types of viral species that encode cluster members, followed by 2) the number of viral families that encode cluster members. The top 50 protein clusters by this metric were included in the plot. Each row is a protein cluster (with the number indicating the protein cluster ID). The X axis indicates the percentage of viral families of each genome type that contain a viral species that encodes a member of the protein cluster. B. A polyphyletic protein cluster of a nucleotide-phosphate kinase fold. The ring indicates the Superkingdom of each member of the tree. The structures of individual members are highlighted. The scale bar indicates substitutions per site. C. A polyphyletic protein cluster of HrpA/B-like helicases. The inner ring indicates the Superkingdom of each member of the tree, with the same color key as panel B. The outer ring indicates the viral taxa (here, viral family) of relevant members of the tree. The structures of individual members are highlighted. The scale bar indicates substitutions per site. D. A monophyletic protein cluster of Rep-like proteins shows sequence similarity between Parvovirus Rep proteins and a Rep-like protein in HHV6A and HHV6B. The inner ring indicates the Superkingdom of each member of the tree, with the same color key as panel B. The outer ring indicates the viral taxa (here, viral family) of relevant members of the tree. The structures of individual members are highlighted. The scale bar indicates substitutions per site. E. A monophyletic protein cluster of Hemagglutinin-like proteins shows sequence similarity between a clade of orthomyxovirus and baculovirus hemagglutinins. The inner ring indicates the Superkingdom of each member of the tree, with the same color key as panel B. The outer ring indicates the viral taxa (here, viral family) of relevant members of the tree. The structures of individual members are highlighted. The scale bar indicates substitutions per site.
Extended Data Fig. 6
Extended Data Fig. 6. Shared domains across eukaryotic virus protein clusters.
A. All-by-all structural alignments of representative structures from the 5,770 protein clusters with more than one member. Each dot indicates a single alignment, with the Y axis indicating the fraction of amino acid identity and the X axis indicating DALI Z-score. B. Protein clusters tend to share protein domains. Each node indicates a protein cluster, and edges between protein clusters indicate there is a DALI alignment between them. Only alignments with a Z score of at least 15 are plotted. The boxes indicate cluster representatives highlighted in subsequent panels. C. Frequent reuse of structural/cytoskeleton-related domains. Protein clusters with collagen-like domains (orange) and fascin-like domains (green) are highlighted. D. Multiple combinations of domains with the same viral genus. Diverse combinations of transglutaminase-like domains (purple) and N1R-like domains (green) from entomopoxvirus proteins are highlighted. E. Frequent reuse of protein domains involved in metabolism. Various combinations of thymidylate synthase (dark blue) and dihydrofolate reductase (light blue) domains in protein clusters are highlighted.
Extended Data Fig. 7
Extended Data Fig. 7. Structure methods outperform sequence methods at identifying virus-virus and host-virus protein similarities.
A. Method for doing benchmarking. For all protein clusters with at least two sequence clusters, we conducted all-by-all alignments between members using MMseqs2, DIAMOND blastp, and jackhmmer. These alignments and subsequence clustering occur separately for each protein cluster. From these alignments, we conducted connected-component clustering using sat.py aln_cluster. B. This plot indicates the average number of clusters detected (on the Y axis) by each method (on the X axis) across all of the protein clusters that contain at least two sequence clusters. C. For each sequence method, the proportion of original protein cluster members that were included in the largest cluster is plotted across all original protein clusters. The X axis indicates the proportion of proteins in the largest cluster for the indicated sequence method (color), while the Y axis indicates the density (or proportion) of original protein clusters with that value. D. To compare the sensitivity of structure and sequence alignment at detecting similarities between virus and non-virus proteins, we conducted sequence alignments using MMseqs2, DIAMOND, and jackhmmer to align each non-viral query against the viral database. These plots then indicate, for each query, the fraction of DALI alignments that are likewise identified through each sequence method. E. We identified swell-folded sequence cluster representatives from clusters containing no more than ¼ of members with an Interproscan alignment. We aligned these 1,326 proteins against the PDB using structural search (with DALI) or sequence search (with HHblits and HHsearch, similar to HHpred webserver). This resulted in 661 alignments with DALI and 295 alignments with HHblits/HHsearch. F. This bar plot indicates, for each of the 1,326 proteins in the benchmark set, the number of proteins with no alignments against the PDB with either DALI or HHblits/HHsearch, alignments against the PDB with both DALI and HHblits/HHsearch, or alignment against the PDB with only DALI or HHblits/HHsearch.
Extended Data Fig. 8
Extended Data Fig. 8. Activity of viral PDEs against 2’3’ cGAMP.
A. Western blot of 293 T cells following transfection of each viral LigT-like PDE. Each LigT-like PDE contains two STEP2 tags, and were visualized using an anti-STREP antibody. This blot is representative of two independent experiments. For gel source data see Supplementary Fig. 1. B. This experiment was conducted as illustrated in Fig. 4c. The X axis indicates the relative RLU normalized to the Noncoding transgene condition for each STING agonist (either 2’3’ cGAMP or diABZI).”Mut” indicates the transgene contains mutations of both catalytic histidines. Boxplots indicate 25th, 50th, and 75th percentiles, while whiskers go to the highest or smallest point up to 1.5 * interquartile range. Plotted data are from one biological replicate and three wells per condition. C. Thin-layer chromatography of co-spots between different conditions. (Left) Co-spotting of 2’3’ cGAMP and the Pigeonpox/2’3’cGAMP reaction. (Middle) Co-spotting of the Pigeonpox (WT)/2’3’ cGAMP reaction and the Acb1 (WT)/2’3’ cGAMP reaction. (Right) Co-spotting of the Pigeonpox (WT)/3’3’ cGAMP reaction and the Acb1 (WT)/3’3’ cGAMP reaction. Source Data

References

    1. Paez-Espino, D. et al. Uncovering Earth’s virome. Nature536, 425–430 (2016). - PubMed
    1. Varadi, M. et al. AlphaFold protein structure database: massively expanding the structural coverage of protein-sequence space with high-accuracy models. Nucleic Acids Res.50, D439–D444 (2022). - PMC - PubMed
    1. Barrio-Hernandez, I. et al. Clustering predicted structures at the scale of the known protein universe. Nature622, 637–645 (2023). - PMC - PubMed
    1. Koonin, E. V. et al. Global organization and proposed megataxonomy of the virus world. Microbiol. Mol. Biol. Rev.10.1128/mmbr.00061-19 (2020). - PMC - PubMed
    1. Coulibaly, F. et al. The birnavirus crystal structure reveals structural relationships among icosahedral viruses. Cell120, 761–772 (2005). - PubMed

MeSH terms

Substances