

Expression of miR-155 in monocytes of people with migraine: association with phenotype, disease severity and inflammatory profile
- PMID: 39187749
- PMCID: PMC11348581
- DOI: 10.1186/s10194-024-01842-y
Expression of miR-155 in monocytes of people with migraine: association with phenotype, disease severity and inflammatory profile
Erratum in
-
Correction: Expression of miR‑155 in monocytes of people with migraine: association with phenotype, disease severity and inflammatory profile.J Headache Pain. 2024 Oct 15;25(1):179. doi: 10.1186/s10194-024-01881-5. J Headache Pain. 2024. PMID: 39407118 Free PMC article. No abstract available.
Abstract
Background: miR-155 is involved in the generation and maintenance of inflammation and pain, endothelial function and immune system homeostasis, all functions that are relevant for migraine. The present study aims to assess the levels of miR-155 in migraine subtypes (episodic and chronic) in comparison to age- and sex-matched healthy controls.
Methods: This is a cross-sectional, controlled, study involving three study groups: I) episodic migraine (n = 52, EM), II) chronic migraine with medication overuse (n = 44, CM-MO), and III) healthy controls (n = 32, HCs). We assessed the interictal gene expression levels of miR-155, IL-1β, TNF-α, and IL-10 in peripheral blood monocytes using rtPCR. The monocytic differentiation toward the M1 (pro-inflammatory) or M2 (anti-inflammatory) phenotypes was assessed in circulating monocytes with flow cytometry analysis and cell sorting.
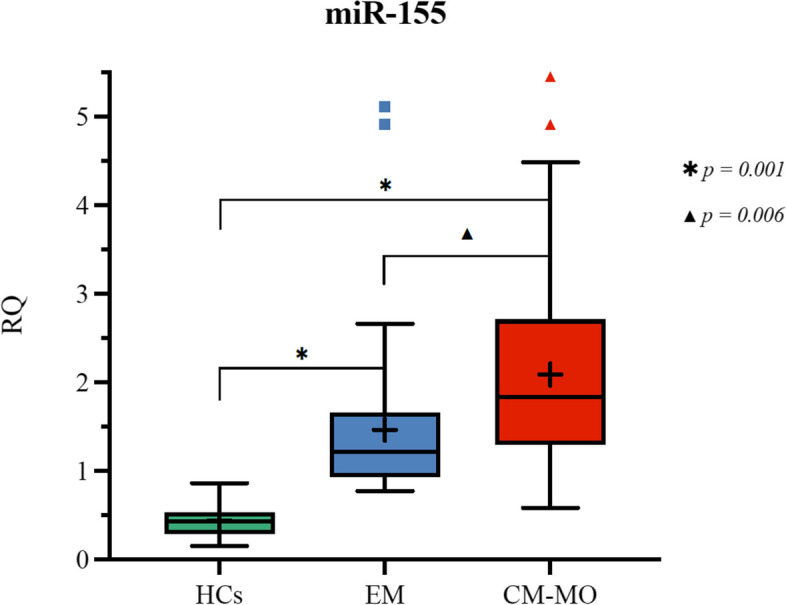
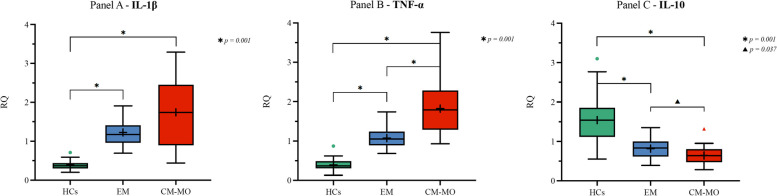
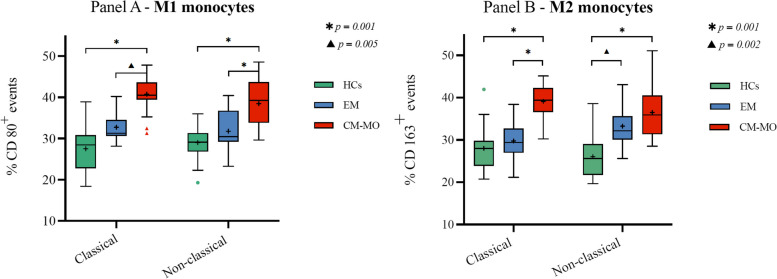
Results: miR-155 gene expression was higher in CM-MO group (2.68 ± 2.47 Relative Quantification - RQ) when compared to EM group (1.46 ± 0.85 RQ, p = 0.006) and HCs (0.44 ± 0.18 RQ, p = 0.001). In addition, miR-155 gene expression was higher in EM group when compared to HCs (p = 0.001). A multivariate analysis confirmed the difference between EM and CM-MO groups after correction for age, sex, smoking habit, preventive treatment, aura, presence of psychiatric or other pain conditions. We found higher gene expression of IL-1β, TNF-α, and lower gene expression of IL-10 in migraine participants when compared to HCs (p = 0.001 for all comparisons). TNF-α and IL-10 genes alterations were more prominent in CM-MO when compared to EM participants (p = 0.001). miR-155 positively correlated with IL-1β (p = 0.001) and TNF-α (p = 0.001) expression levels. Finally, in people with CM-MO, we described an up-regulated percentage of events in both M1 and M2 monocytic profiles.
Conclusions: Our study shows for the first time a specific profile of activation of miR-155 gene expression levels in monocytes of selected migraine subpopulations, more pronounced in subjects with CM-MO. Interestingly, mir-155 expression correlated with markers of activation of the inflammatory and immune systems. The CM-MO subpopulation showed a peculiar increase of both pro-inflammatory and anti-inflammatory monocytes which worths further investigation.
Trial registration: www.
Clinicaltrials: gov . (NCT05891808).
Keywords: Epigenetics; MiR-155; Migraine pathophysiology; Migraine spectrum; Monocytes differentiation; Neuroinflammation; microRNAs.
© 2024. The Author(s).
Conflict of interest statement
The authors declare no competing interests.
Figures

References
-
- Gallardo VJ, Vila-Pueyo M, Pozo-Rosich P (2023) The impact of epigenetic mechanisms in migraine: Current knowledge and future directions. Cephalalgia 43:1–12. 10.1177/03331024221145916 - PubMed
-
- Ahmad L, Demartini C, Corrado M et al (2021) Expression of Selected microRNAs in Migraine: A New Class of Possible Biomarkers of Disease? Processes 9:2199. 10.3390/pr9122199
-
- Bagga S, Pasquinelli AE (2006) Identification and analysis of microRNAs. Genet Eng 27. 10.1007/0-387-25856-6_1 - PubMed
-
- Bartel DP (2004) MicroRNAs: genomics, biogenesis, mechanism, and function. Cell 116:281–297. 10.1016/S0092-8674(04)00045-5 - PubMed
MeSH terms
Substances
Associated data
Grants and funding
- Ricerca Corrente - RC2022-2024/Ministero della Salute
- Ricerca Corrente - RC2022-2024/Ministero della Salute
- Ricerca Corrente - RC2022-2024/Ministero della Salute
- Ricerca Corrente - RC2022-2024/Ministero della Salute
- Ricerca Corrente - RC2022-2024/Ministero della Salute
- Ricerca Corrente - RC2022-2024/Ministero della Salute
- Ricerca Corrente - RC2022-2024/Ministero della Salute
- Ricerca Corrente - RC2022-2024/Ministero della Salute
- Ricerca Corrente - RC2022-2024/Ministero della Salute
- Ricerca Corrente - RC2022-2024/Ministero della Salute
- Ricerca Corrente - RC2022-2024/Ministero della Salute
- Ricerca Corrente - RC2022-2024/Ministero della Salute
- Ricerca Corrente - RC2022-2024/Ministero della Salute
- Ricerca Corrente - RC2022-2024/Ministero della Salute
- Ricerca Corrente - RC2022-2024/Ministero della Salute
- Ricerca Corrente - RC2022-2024/Ministero della Salute
- Ricerca Corrente - RC2022-2024/Ministero della Salute
- Ricerca Corrente - RC2022-2024/Ministero della Salute
- Ricerca Corrente - RC2022-2024/Ministero della Salute
- Ricerca Corrente - RC2022-2024/Ministero della Salute
- Ricerca Corrente - RC2022-2024/Ministero della Salute
LinkOut - more resources
Full Text Sources
Medical
Miscellaneous
