. 2024 Aug 6:41:440-454.
doi: 10.1016/j.bioactmat.2024.07.036. eCollection 2024 Nov.

Augmenting osteoporotic bone regeneration through a hydrogel-based rejuvenating microenvironment

Affiliations

Augmenting osteoporotic bone regeneration through a hydrogel-based rejuvenating microenvironment

Xiaoting Zhang et al. Bioact Mater. .

Abstract

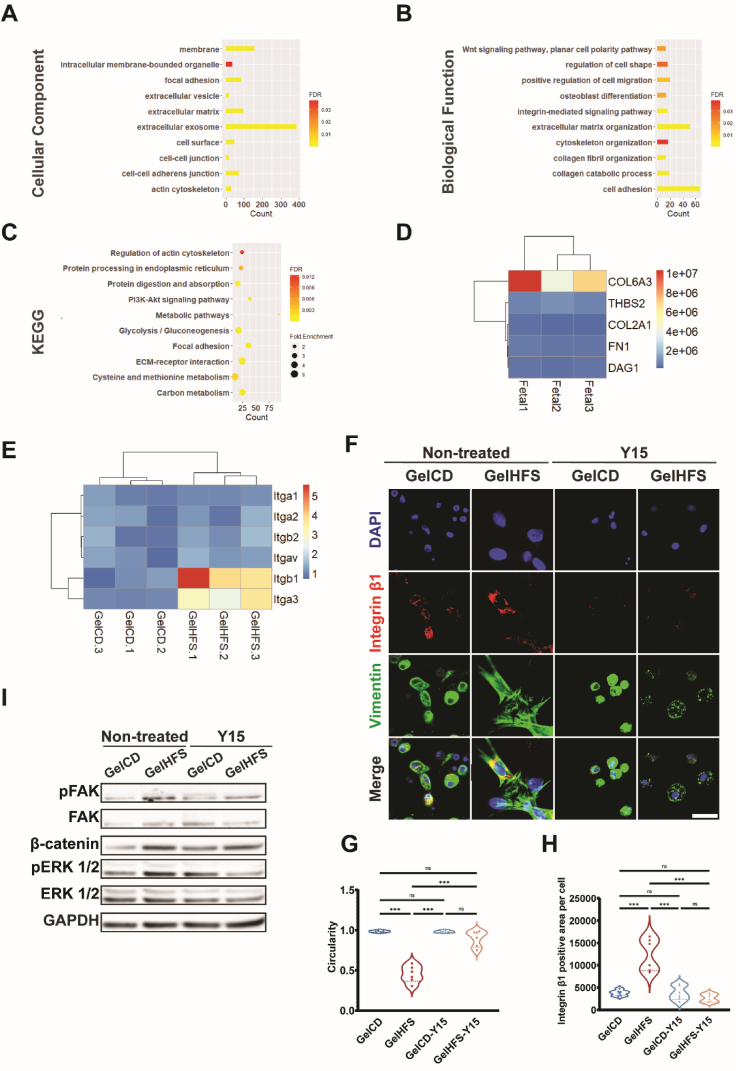
Osteoporotic bone defects pose a significant challenge for bone regeneration as they exhibit impaired healing capacity and delayed healing period. To address this issue, this study introduces a hydrogel that creates a rejuvenating microenvironment, thereby facilitating efficient bone repair during the initial two weeks following bone defect surgery. The hydrogel, named GelHFS, was created through host-guest polymerization of gelatin and acrylated β-cyclodextrin. Incorporation of the human fetal mesenchymal stem cell secretome (HFS) formed GelHFS hydrogel aimed at mimicking a rejuvenated stem cell niche. Our results demonstrated that GelHFS hydrogel promotes cell stellate spreading and osteogenic differentiation via integrin β1-induced focal adhesion pathway. Implantation of GelHFS hydrogel in an osteoporotic bone defect rat model recruited endogenous integrin β1-expressing cells and enhanced new bone formation and bone strength. Our findings reveal that GelHFS hydrogel provides a rejuvenating niche for endogenous MSCs and enhances bone regeneration in osteoporotic bone defect. These findings highlight the potential of GelHFS hydrogel as an effective therapeutic strategy for addressing challenging bone healing such as osteoporotic bone regeneration.

Keywords: Bone regeneration; Focal adhesion pathway; Osteoporotic bone defects; Rejuvenating microenvironment; Secretome.


Conflict of interest statement

The authors have no conflicts of interest to disclose in relation to this article.

Figures

Image 1
Graphical abstract
Fig. 1
Fig. 1
Formation and properties of GelCD and GelHFS hydrogels. (A) Schematic illustration of the formation of GelCD and GelHFS hydrogels. Left panel (blue dashed line) shows GelCD hydrogel formation involving gelatin and Ac-β-CD under UV light with I2959 initiator, resulting in a network through reversible host-guest complexation. Right panel (red dashed line) depicts GelHFS hydrogel formation, which includes GelCD and HFS (consists of ECM and EVs), followed by photocrosslinking under UV light with I2959, leading to a more complex hydrogel network. (B) SEM images demonstrate the microstructure of GelCD and GelHFS hydrogels. The green and yellow rectangles in the GelHFS image correspond to the magnified images. Red arrows indicate aggregated EVs while yellow arrowhead indicates ECM. The scale bars in the images are 300 μm, 40 μm, 2 μm, and 4 μm from left to right, respectively. (C) Represent frequency sweep curve of GelCD and GelHFS with various HFS concentrations. (D) The swelling ratio of GelCD and GelHFS with various HFS concentrations. Data are presented as mean values ± SD, n = 3 independent hydrogels per group, ***P < 0.001, ns indicates no statistical difference (one-way ANOVA with Tukey's HSD). (E) Representative live/dead staining images of rat MSCs encapsulated within hydrogels after 1 and 7 days of culture. Scale bar = 100 μm. GelHFS-L: GelCD hydrogel with a low concentration of HFS incorporated, GelHFS-M: GelCD hydrogel with a medium concentration of HFS incorporated, GelHFS-H: GelCD hydrogel with a high concentration of HFS incorporated.
Fig. 2
Fig. 2
GelHFS hydrogel presents conducive biological properties. (A) Representative images show rat MSCs encapsulated in GelCD and GelHFS hydrogels on culture day 2, stained for vimentin (green) and nuclei (blue). The scale bar is 100 μm. (B&C) The circularity and area of the rat MSCs encapsulated within the GelCD and GelHFS hydrogels, respectively. Circularity values range from 0 (highly elongated) to 1 (perfectly circular). Data are presented as mean values ± SD, n = 10 cells per group, ***P < 0.001 (two-tailed Student's t-test). (D) Confocal images demonstrate the 3D distribution of DAPI-stained rat MSC nuclei within GelCD and GelHFS hydrogels after 24 h of in vitro culture. (E) Invasion distance of DAPI-stained rat MSCs nuclei clusters within the GelCD and GelHFS hydrogels. The scanning depth for (D) was 400 μm. (F) Timeline of ectopic bone formation assay. Rat MSCs encapsulated in GelCD and GelHFS were cultured in osteogenic induction medium for 7 days before subcutaneous implantation in nude mice. After 4 weeks post-implantation, samples were harvested for analysis. (G) Immunofluorescence staining against OCN (red) and Col I (green) of rat MSCs-laden GelCD and GelHFS after 4 weeks of subcutaneous implantation in nude mice. Nuclei were stained with DAPI. Scale bar = 100 μm. Overview: the morphology of rat MSCs encapsulated hydrogels after 4 weeks of implantation in nude mice. Scale bar = 1 mm. (H&I) Quantification of integrin β1 and Col I intensity in (G). Analysis was performed using ImageJ software. Data are presented as mean values ± SD, with n = 3 independent hydrogels per group. *P < 0.05, **P < 0.01 (two-tailed Student's t-test).
Fig. 3
Fig. 3
GelHFS hydrogel potentially activated integrin β1 induced focal adhesion pathway. (A) GO annotation (cellular component) of HFS proteins. (B) GO annotation (biological function) of HFS proteins. (C) KEGG enrichment of HFS proteins. (D) Heatmap of Top 5 HFS proteins which annotated into extracellular matrix GO term in (A). (E) The gene expression levels of integrin subunits Itga1, Itga2, Itga3, Itgav, Itgb1, and Itgb2 were measured by qPCR in rat MSCs-laden GelCD and GelHFS after 2 days of culture. The data represents the relative expression levels normalized to GAPDH and expressed as fold change compared to the expression levels in rat MSCs-laden GelCD. (F) Cell spreading in GelCD and GelHFS hydrogels after 2 days of culture with or without treatment with FAK inhibitor Y15. Representative images show integrin β1 (red), vimentin (green) and nuclei (blue) staining. Scale bar = 15 μm. (G) The circularity of rat MSCs in (F) was quantified using ImageJ software. Circularity values range from 0 (highly elongated) to 1 (perfectly circular). Data are presented as mean values ± SD, with n = 6 cells per group. ***P < 0.001, ns indicates no statistical difference (one-way ANOVA with Tukey's HSD). (H) Quantification of positive area of integrin β1 in (F) was performed using ImageJ software. Data are presented as mean values ± SD, with n = 6 cells per group. ***P < 0.001, ns indicates no statistical difference (one-way ANOVA with Tukey's HSD). (I) The protein expression levels of pFAK, total FAK, β-catenin, pERK1/2, ERK1/2, and GAPDH were analyzed in rat MSCs encapsulated in GelCD and GelHFS in the absence or presence of FAK inhibitor Y15. Protein expression was quantified by Western blotting.
Fig. 4
Fig. 4
GelHFS hydrogel promotes osteoporotic bone regeneration. (A) Timeline of bone defect surgery. Female rats underwent ovariectomy to induce an osteoporotic condition for 12 weeks. Afterward, they underwent defect surgery on the distal femur with or without hydrogel implantation. Samples were harvested 2- and 8-weeks post-implantation for analysis. (B) Three-dimensional reconstructed mineralized tissue in the defect tunnels of distal femurs at 2 and 8 weeks after implantation. The scanning resolution is 17.5 μm at 70 kV, 114 μA. Scale bar = 1 mm (C ∼ E) Quantitative data of micro-CT analysis. Quantitative analysis of the BMD (C). Thresholds of 158–1000 were used to represent total mineralized tissue (D), and thresholds of 211–1000 were used to represent mineralized tissue undergoing remodeling process (E). Data are presented as mean values ± SD, with n ≥ 6 rats per group per timepoint. ns indicates no statistical difference, *P < 0.05, **P < 0.01, ***P < 0.001 (one-way ANOVA with Tukey's HSD). (F&G) Biomechanical properties of distal femur at 8 weeks post-implantation. The stiffness (F) and ultimate load (G) were measured using a mechanical testing machine. Data are presented as mean values ± SD, with n = 4. *P < 0.05 (two-tailed Student's t-test). (H) Goldner's trichrome staining of the defect site in the distal femur of OVX rats, n = 4 per group. The red dashed area indicates the remaining hydrogels within the defect site. M: materials. WB: woven bone. LB: lamellar bone. FT: fibrous tissue. Scale bar = 500 μm for overviewed images and 50 μm for magnified images.
Fig. 5
Fig. 5
GelHFS hydrogel recruits endogenous cells into the defect site to promote bone regeneration. (A) Timeline of fluorescence labeling for (B). Female rats underwent defect surgery on the distal femur and were implanted with hydrogels. Calcein and xylenol were injected at day 4 and 10 post-implantation, respectively. Samples were harvested at 2 weeks post-implantation for analysis. (B) Representative calcein/xylenol fluorescence microscopic images and Von Kossa staining images for assessment of bone formation at 2 weeks after hydrogel implantation. Scale bar = 200 μm. (C) Representative IHC images of defect site at 2 weeks post implantation. Integrin β1, OCN and Col Ⅰ were stained on adjacent sections 5 μm apart. The yellow rectangles in the overview images correspond to the magnified images. NB: new bone. FT: fibrous tissue. M: materials. Scale bar = 500 μm for overview and 50 μm for magnification. (D) Quantification of positive area in (B) analyzed by ImageJ software. Data are presented as mean values ± SD, with n = 3. *P < 0.05, and ns indicating no statistical difference (two-tailed Student's t-test). (E ∼ G) Quantification of integrin β1, OCN and Col I intensity in (C) was performed using ImageJ software. Data are presented as mean values ± SD, with n = 4. *P < 0.05, ***P < 0.001 (two-tailed Student's t-test).
Fig. 6
Fig. 6
GelHFS hydrogel exhibits faster degradation in osteoporotic bone. (A) Weight loss of GelCD and GelHFS hydrogels in vitro over time. Data are presented as mean values ± SD, with n = 3. P > 0.05 (two-tailed Student's t-test). (B) Changes in fluorescence of hydrogels implanted in nude mice, as measured by in vivo imaging system. Data are presented as mean values ± SD, with n = 3. P > 0.05 (two-tailed Student's t-test). (C) Representative in vivo fluorescence intensity images of hydrogels. (D) Residual hydrogels at the defect site of rats at 2 weeks post hydrogel implantation, as visualized by blue color. White color indicates mineralized tissue. Scale bar = 1 mm. (E) Percentage of scaffold volume (SV) to total volume (TV) in (D), quantified by micro-CT analysis. Data are presented as mean values ± SD, with n = 6. ***P < 0.001 (two-tailed Student's t-test). (F) Representative IHC images of defect site at 2 weeks post implantation. MMP2 and MMP13 were stained on adjacent sections 5 μm apart. The yellow rectangles in the overview images correspond to the magnified images. NB: new bone. FT: fibrous tissue. M: materials. Scale bar = 500 μm for overview and 50 μm for magnification. (G&H) Quantification of MMP2 and MMP13 intensity in (F) was performed using ImageJ software. Data are presented as mean values ± SD, with n = 4. **P < 0.01, ***P < 0.001 (two-tailed Student's t-test).
Fig. 7
Fig. 7
GelHFS hydrogel creates a rejuvenating stem cell niche and enhances osteoporotic bone regeneration via activating integrin mediated focal adhesion pathway.

References

    1. Féron J.-M., Mauprivez R. Fracture repair: general aspects and influence of osteoporosis and anti-osteoporosis treatment. Injury. 2016;47:S10–S14. - PubMed
    1. Yaacobi E., Sanchez D., Maniar H., Horwitz D.S. Surgical treatment of osteoporotic fractures: an update on the principles of management. Injury. 2017;48(Suppl 7):S34–s40. - PubMed
    1. von Rüden C., Augat P. Failure of fracture fixation in osteoporotic bone. Injury. 2016;47(Suppl 2):S3–s10. - PubMed
    1. Cortet B. Bone repair in osteoporotic bone: postmenopausal and cortisone-induced osteoporosis. Osteoporos. Int. 2011;22(6):2007–2010. - PubMed
    1. Cheung W.H., Miclau T., Chow S.K.-H., Yang F.F., Alt V. Fracture healing in osteoporotic bone. Injury. 2016;47:S21–S26. - PubMed

LinkOut - more resources