. 2024 Jul 26:8:100217.
doi: 10.1016/j.bioflm.2024.100217. eCollection 2024 Dec.

A cyanobacterial sigma factor F controls biofilm-promoting genes through intra- and intercellular pathways

Affiliations

A cyanobacterial sigma factor F controls biofilm-promoting genes through intra- and intercellular pathways

Shiran Suban et al. Biofilm. .

Abstract

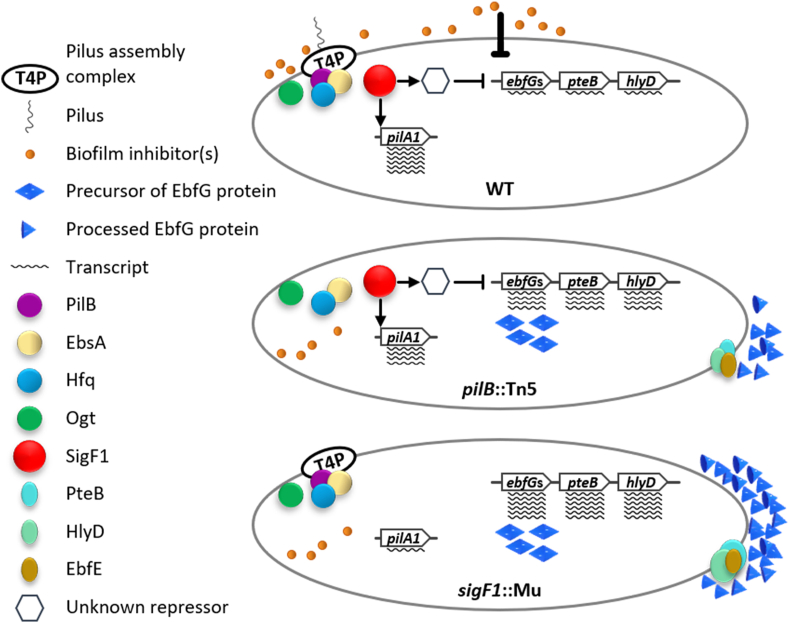
Cyanobacteria frequently constitute integral components of microbial communities known as phototrophic biofilms, which are widespread in various environments. Moreover, assemblages of these organisms, which serve as an expression platform, simplify harvesting the biomass, thereby holding significant industrial relevance. Previous studies of the model cyanobacterium Synechococcus elongatus PCC 7942 revealed that its planktonic growth habit results from a biofilm-suppression mechanism that depends on an extracellular inhibitor, an observation that opens the door to investigating cyanobacterial intercellular communication. Here, we demonstrate that the RNA polymerase sigma factor SigF1, is required for this biofilm-suppression mechanism whereas the S. elongatus paralog SigF2 is not involved in biofilm regulation. Comprehensive transcriptome analyses identified distinct regulons under the control of each of these sigma factors. sigF1 inactivation substantially lowers transcription of genes that code for the primary pilus subunit and consequently prevents pilus assembly. Moreover, additional data demonstrate absence of the biofilm inhibitor from conditioned medium of the sigF1 mutant, further validating involvement of the pilus assembly complex in secretion of the biofilm inhibitor. Consequently, expression is significantly upregulated for the ebfG-operon that encodes matrix components and the genes that encode the corresponding secretion system, which are repressed by the biofilm inhibitor in the wild type. Thus, this study uncovers a basic regulatory component of cyanobacterial intercellular communication, a field that is in its infancy. Elevated expression of biofilm-promoting genes in a sigF1 mutant supports an additional layer of regulation by SigF1 that operates via an intracellular mechanism.


Conflict of interest statement

The authors declare that they have no known competing financial interests or personal relationships that could have appeared to influence the work reported in this paper.

Figures

Fig. 1
Fig. 1
Expression of genes that enable biofilm formation is governed by extracellular inhibitor(s). PilB – assembly ATPase of the type IV pilus (T4P) assembly complex. EbsA – essential for biofilm suppression protein A. Hfq – homolog of RNA chaperone. Ogt – glycosyltransferase that glycosylates the pilus subunit PilA. The ebfG-operon encodes four secreted proteins that enable biofilm formation and are characterized by a double Glycine secretion motif.
Fig. 2
Fig. 2
SigF1 is essential for the biofilm self-suppression mechanism. A. Genomic region of genes that encode homologs of sigmaF factors of S. elongatus: synpcc7942_1510 and synpcc7942_1784. R2, R3 and R4 indicate particular domains of the SigF proteins. The asterisk denotes the insertion site of the Mu transposon in sigF1. NaeI and BstXI sites were used to construct the deletion mutant of sigF2. Arrows denote the primers used to PCR-amplify a DNA fragment for complementation. synpcc7942_1511, synpcc7942_1783 and synpcc7942_1785 encode proteins defined as hypothetical, whereas synpcc7942_1509 encodes trmU (tRNA (5-methylaminomethyl-2-thiouridylate)-methyltransferase). B. Image of sigF1::Mu biofilm obtained with confocal fluorescence microscopy. Imaging is based on autofluorescence (excitation at 630 nm and emission at 641–657 nm). The color scale represents biofilm depth. C. Assessment of biofilm development by measurement of the percentage of chlorophyll in suspended cells. Robust biofilm development is manifested by a low percentage of chlorophyll in the planktonic fraction (suspended cells). Strains analyzed: WT; the biofilm-forming strains in which pilB and sigF1 were inactivated (pilB::Tn5 and sigF1::Mu, respectively); sigF1::Mu complemented with SigF1 (sigF1::Mu/sigF1) and a deletion mutant of sigF2sigF2). Data represent averages and standard deviations from 3 independent biological repetitions (with 3 technical repeats in each). Asterisks denote significance (t-test, two tails, two-sample assuming unequal variances. *p < 0.001; **p < 5 E−5). (For interpretation of the references to color in this figure legend, the reader is referred to the Web version of this article.)
Fig. 3
Fig. 3
Conditioned medium from WT culture inhibits biofilm formation by sigF1::Mu. A. Cultures of sigF1::Mu and pilB::Tn5 in fresh medium (FM) and in WT conditioned medium (CM). Growth tubes were photographed before (upper panels) and after (lower panels) planktonic cells were decanted. In FM mutant cells adhere to the growth vessel. B. Percentage of chlorophyll in suspended cells served to quantify biofilm formation.
Fig. 4
Fig. 4
Summary of transcriptome analyses of WT, pilB::Tn5, sigF1::Mu and ΔsigF2. Venn diagrams summarize differentially expressed genes (DEGs) that were up- or downregulated in the mutants relative to WT (fold change ≥2; adjusted p < 0.05). Tables indicate protein-encoding genes exhibiting the highest fold change for sigF1::Mu compared to WT (fold change >10; adjusted p < 0.05), which are also differentially expressed in pilB::Tn5 but not in ΔsigF2. For complete data set see Supplementary dataset 1. A and B. Upregulated genes in mutants compared to WT in day 1 or day 4, respectively. C and D. Downregulated genes in mutants compared to WT in day 1 or day 4, respectively.
Fig. 5
Fig. 5
Transmission electron microscopy (TEM) analyses of WT, sigF1::Mu and ΔsigF2. A, C and D. Cell images. B. Detached cell pili observed in WT culture. Arrows indicate pili whereas the arrowhead indicates a non-piliated ΔsigF2 cell. Scale bar shown in A is relevant to all panels.
Fig. 6
Fig. 6
Examination of expression of the ebfG-operon using reporter strains and flow cytometry. A and C. Number of cells as a function of fluorescence in WT, pilB::Tn5, sigF1::Mu and ΔsigF2 strains bearing a reporter construct (P-ebfG::YFP). Analyses were performed on 2-day (A) and 6-day (C) old cultures. In A the cognate negative control strains are also included. Data shown are from a single representative experiment out of the three biological replicates. Dashed line in A indicates cutoff for calculating YFP positive cells (data summary in B). Additional cutoff (dashed line in C) served for calculating YFP positive mutant-reporter cells relative to 6-day old WT-reporter (see Table for averages and standard deviations from three biological replicates). B. Percentage of YFP-positive cells in pilB::Tn5, sigF1::Mu and ΔsigF2 reporter cultures relative to 2-day old WT-reporter cells. Averages and standard deviations from three biological replicates are presented. Asterisks denote significant changes between WT- and mutant-reporter strains of same culture age (one-way ANOVA with Dunnett's post-hoc test. *p < 0.05; ***p < 0.001).
Fig. 7
Fig. 7
Exoproteome analyses reveal substantially higher level of EbfG proteins in sigF1::Mu than in pilB::Tn5. A. Table summarizing enrichment of EbfG proteins in mutant exoproteomes. Venn diagrams summarizing more (B) and less (C) abundant proteins in the exoproteomes of sigF1::Mu and pilB::Tn5 compared to WT (fold change >2; false discovery rate (FDR) < 0.1).
Fig. 8
Fig. 8
Dual repression pathways by SigF1 in biofilm regulation. SigF1 regulates transcription of biofilm-promoting genes via an intracellular mechanism (thin T-bar) as well as intercellular pathway (thick T-bar). See text for further details.

References

    1. Srivastava A., Summers M.L., Sobotka R. Cyanobacterial sigma factors: current and future applications for biotechnological advances. Biotechnol Adv. 2020;40 - PubMed
    1. Gruber T.M., Gross C.A. Multiple sigma subunits and the partitioning of bacterial transcription space. Annu Rev Microbiol. 2003;57:441–466. - PubMed
    1. Feklistov A., Sharon B.D., Darst S.A., Gross C.A. Bacterial sigma factors: a historical, structural, and genomic perspective. Annu Rev Microbiol. 2014;68:357–376. - PubMed
    1. Helmann J.D. Where to begin? Sigma factors and the selectivity of transcription initiation in bacteria. Mol Microbiol. 2019;112(2):335–347. - PMC - PubMed
    1. Paget M.S. Bacterial sigma factors and anti-sigma factors: structure, function and distribution. Biomolecules. 2015;5(3):1245–1265. - PMC - PubMed