. 2024 Jul 26:23:101677.
doi: 10.1016/j.fochx.2024.101677. eCollection 2024 Oct 30.

Characterizing the flavor profiles of Linjiangsi broad bean (Vicia faba L.) paste using bionic sensory and multivariate statistics analyses based on ripening time and fermentation environment

Affiliations

Characterizing the flavor profiles of Linjiangsi broad bean (Vicia faba L.) paste using bionic sensory and multivariate statistics analyses based on ripening time and fermentation environment

Chunyuan Ping et al. Food Chem X. .

Abstract

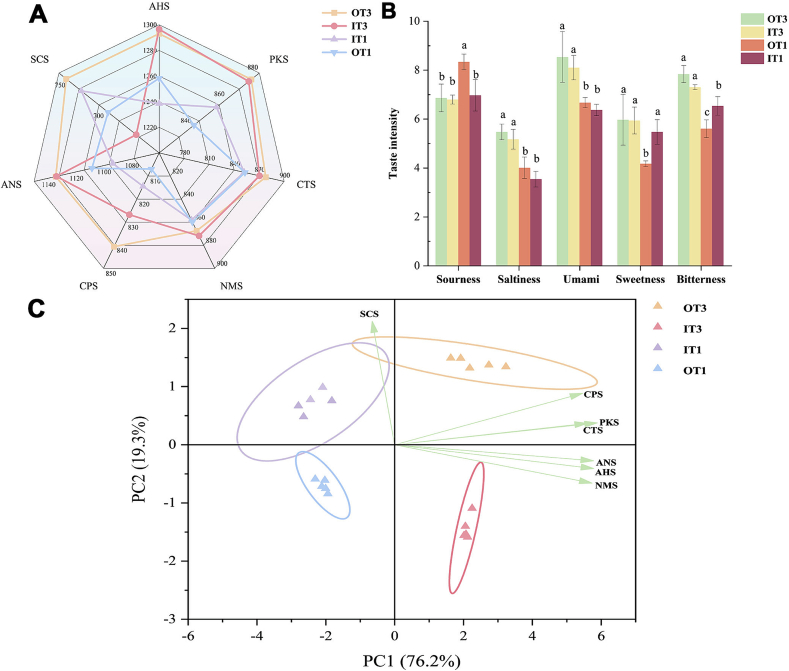
The flavor profile of Linjiangsi broad bean paste (LBBP) is significantly influenced by fermentation environment and ripening time. This study aims to investigate the flavor of outdoor-treated (OT) and indoor-treated (IT) LBBP. Gas chromatography-mass spectrometry, electronic-nose, and electronic-tongue, combined with multivariate statistical analyses, were employed to identify the characteristic flavor profiles of OT and IT LBBP in ripening periods of one and three years. Overall, 95 volatile organic compounds (VOCs) were identified. Relative odor activity values and multivariate statistical analysis indicated that nine VOCs were responsible for the flavor differences. The most abundant VOCs in OT were aldehydes, providing caramel and nutty flavors, whereas the most abundant compounds in IT were esters, contributing fruity flavors to LBBP. Notably, three years of ripening significantly intensified the characteristic flavors of both OT and IT. These findings may elucidate the ripening time and fermentation environment effect on LBBP characteristic flavor profiles.

Keywords: Bionic senses; HS-GC–MS; Linjiangsi broad bean paste; Volatile organic compounds.


Conflict of interest statement

The authors declare that they have no known competing financial interests or personal relationships that could have appeared influence the work reported in this paper.

Figures

Unlabelled Image
Graphical abstract
Fig. 1
Fig. 1
Sensory socres of Linjiangsi Broad Bean after various reheating methods. Note: OT1, and OT3 represent ripening of 1 year and 3 years in outdoor environment respectively. IT1, and IT3 were represents ripening 1 year and 3 years in indoor environment respectively.
Fig. 2
Fig. 2
Analysis of E-tongue in different fermentation conditions of Linjiangsi Broad Bean. Note: (a) The radar chart of the E- tongue, (b) Taste intensity value by E-tongue (c) The PCA chart of the E-tongue.
Fig. 3
Fig. 3
Analysis of E-nose in different fermentation conditions of Linjiangsi Broad Bean. Note: (a) The radar chart of the E- tongue, (b) The PCA chart of the E-nose.
Fig. 4
Fig. 4
Analysis of volatile organic compounds of Linjiangsi Broad Bean in different fermentation conditions. Note: (A) The number of VOCs of Linjiangsi Broad Bean in different fermentation conditions, (B) The concentrtion of VOCs of Linjiangsi Broad Bean in different fermentation conditions.
Fig. 5
Fig. 5
The cluster heat map of ROAV of Linjiangsi Broad Bean in different fermentation conditions. Note: OT1, and OT3 represent ripening of 1 year and 3 years in outdoor environment; IT1, and IT3 were represents ripening 1 year and 3 years in indoor environment.
Fig. 6
Fig. 6
OPLS-DA model of volatile compounds from different reheating methods. Note: (a) Scores plot by OPLS-DA, R2X = 0.953, R2Y = 0.987, Q2 = 0.978; (b) Inner relation plot by PLS-DA; (c) VIP scores. Red corresponds to compounds with VIP > 1, and pink represents compounds with VIP < 1. (d) cross-validation plot for the PLS-DA model with 200 calculations in a permutation test: R2 = (0.0, 0.168), Q2 = (0.0, −0.799). (For interpretation of the references to color in this figure legend, the reader is referred to the web version of this article.)
Fig. 7
Fig. 7
Analysis of the correlation between sensory properties and volatile organic compounds.

References

    1. Azarbad M.H., Jeleń H. Determination of hexanal—An indicator of lipid oxidation by static headspace gas chromatography (SHS-GC) in fat-rich food matrices. Food Analytical Methods. 2014;8(7):1727–1733. doi: 10.1007/s12161-014-0043-0. - DOI
    1. Baldwin E.A., Bai J., Plotto A., Dea S. Electronic noses and tongues: Applications for the food and pharmaceutical industries. Sensors. 2011;11(5):4744–4766. doi: 10.3390/s110504744. - DOI - PMC - PubMed
    1. Barba C., Beno N., Guichard E., Thomas-Danguin T. Selecting odorant compounds to enhance sweet flavor perception by gas chromatography/olfactometry-associated taste (GC/O-AT) Food Chemistry. 2018;257:172–181. doi: 10.1016/j.foodchem.2018.02.152. - DOI - PubMed
    1. Bi J., Ping C., Chen Z., Yang Z., Li B., Gao Y., Zhang Y., He H. Evaluating the influence of high-temperature sterilization and pasteurization on volatile organic compounds in tomato stewed beef brisket: An analysis using gas chromatography-ion mobility spectrometry and multivariate statistical visualization. International Journal of Gastronomy and Food Science. 2024;100939 doi: 10.1016/j.ijgfs.2024.100939. - DOI
    1. Bleicher J., Ebner E.E., Bak K.H. Formation and analysis of volatile and odor compounds in meat—A review. Molecules. 2022;27(19):6703. doi: 10.3390/molecules27196703. - DOI - PMC - PubMed

LinkOut - more resources