

Intracranial pressure-flow relationships in traumatic brain injury patients expose gaps in the tenets of models and pressure-oriented management
- PMID: 39189028
- PMCID: PMC11345185
- DOI: 10.3389/fphys.2024.1381127
Intracranial pressure-flow relationships in traumatic brain injury patients expose gaps in the tenets of models and pressure-oriented management
Abstract
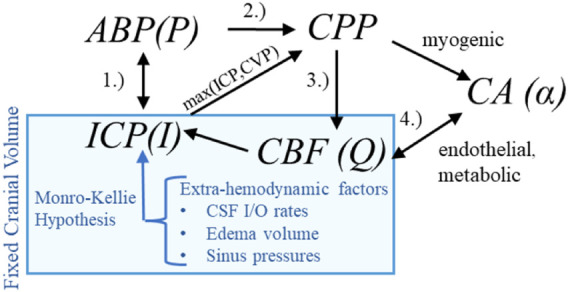
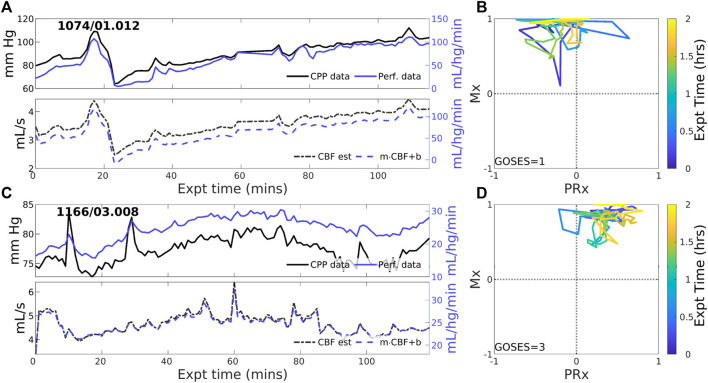
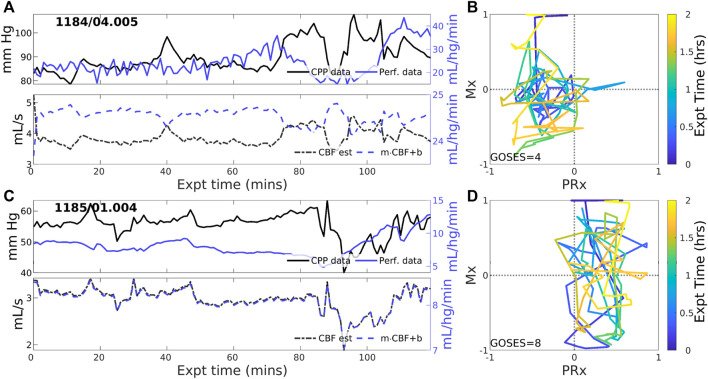
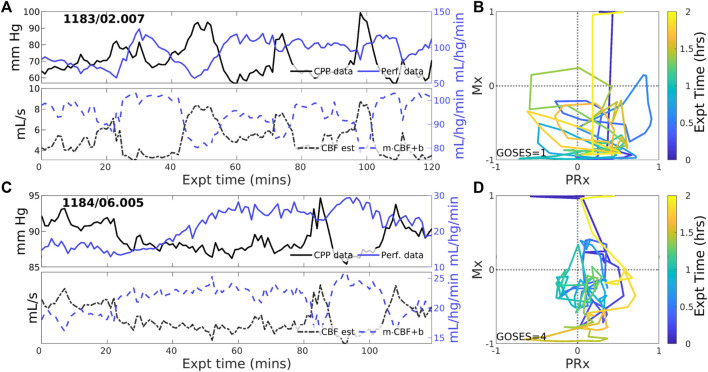
Background: The protocols and therapeutic guidance established for treating traumatic brain injury (TBI) in neurointensive care focus on managing cerebral blood flow (CBF) and brain tissue oxygenation based on pressure signals. The decision support process relies on assumed relationships between cerebral perfusion pressure (CPP) and blood flow, pressure-flow relationships (PFRs), and shares this framework of assumptions with mathematical intracranial hemodynamics models. These foundational assumptions are difficult to verify, and their violation can impact clinical decision-making and model validity. Methods: A hypothesis- and model-driven method for verifying and understanding the foundational intracranial hemodynamic PFRs is developed and applied to a novel multi-modality monitoring dataset. Results: Model analysis of joint observations of CPP and CBF validates the standard PFR when autoregulatory processes are impaired as well as unmodelable cases dominated by autoregulation. However, it also identifies a dynamical regime -or behavior pattern-where the PFR assumptions are wrong in a precise, data-inferable way due to negative CPP-CBF coordination over long timescales. This regime is of both clinical and research interest: its dynamics are modelable under modified assumptions while its causal direction and mechanistic pathway remain unclear. Conclusion: Motivated by the understanding of mathematical physiology, the validity of the standard PFR can be assessed a) directly by analyzing pressure reactivity and mean flow indices (PRx and Mx) or b) indirectly through the relationship between CBF and other clinical observables. This approach could potentially help to personalize TBI care by considering intracranial pressure and CPP in relation to other data, particularly CBF. The analysis suggests a threshold using clinical indices of autoregulation jointly generalizes independently set indicators to assess CA functionality. These results support the use of increasingly data-rich environments to develop more robust hybrid physiological-machine learning models.
Keywords: Hagen-Poiseuille flow; Intracranial hemodynamics; cerebral autoregulation; neurocritical care; traumatic brain injury.
Copyright © 2024 Stroh, Foreman, Bennett, Briggs, Park and Albers.
Conflict of interest statement
The authors declare that the research was conducted in the absence of any commercial or financial relationships that could be construed as a potential conflict of interest. The author(s) declared that they were an editorial board member of Frontiers, at the time of submission. This had no impact on the peer review process and the final decision.
Figures

Update of
-
Intracranial pressure-flow relationships in traumatic brain injury patients expose gaps in the tenets of models and pressure-oriented management.medRxiv [Preprint]. 2024 Jan 18:2024.01.17.24301445. doi: 10.1101/2024.01.17.24301445. medRxiv. 2024. Update in: Front Physiol. 2024 Aug 12;15:1381127. doi: 10.3389/fphys.2024.1381127. PMID: 38293069 Free PMC article. Updated. Preprint.
Similar articles
-
Intracranial pressure-flow relationships in traumatic brain injury patients expose gaps in the tenets of models and pressure-oriented management.medRxiv [Preprint]. 2024 Jan 18:2024.01.17.24301445. doi: 10.1101/2024.01.17.24301445. medRxiv. 2024. Update in: Front Physiol. 2024 Aug 12;15:1381127. doi: 10.3389/fphys.2024.1381127. PMID: 38293069 Free PMC article. Updated. Preprint.
-
Pressure autoregulation monitoring and cerebral perfusion pressure target recommendation in patients with severe traumatic brain injury based on minute-by-minute monitoring data.J Neurosurg. 2014 Jun;120(6):1451-7. doi: 10.3171/2014.3.JNS131500. Epub 2014 Apr 18. J Neurosurg. 2014. PMID: 24745709
-
Novel index for predicting mortality during the first 24 hours after traumatic brain injury.J Neurosurg. 2018 Dec 21;131(6):1887-1895. doi: 10.3171/2018.7.JNS18995. Print 2019 Dec 1. J Neurosurg. 2018. PMID: 30579283
-
Monitoring of cerebral blood flow autoregulation: physiologic basis, measurement, and clinical implications.Br J Anaesth. 2024 Jun;132(6):1260-1273. doi: 10.1016/j.bja.2024.01.043. Epub 2024 Mar 12. Br J Anaesth. 2024. PMID: 38471987 Review.
-
Beyond intracranial pressure: monitoring cerebral perfusion and autoregulation in severe traumatic brain injury.Curr Opin Crit Care. 2023 Apr 1;29(2):85-88. doi: 10.1097/MCC.0000000000001026. Epub 2023 Feb 9. Curr Opin Crit Care. 2023. PMID: 36762674 Review.
References
Grants and funding
LinkOut - more resources
Full Text Sources