

Detection of cancer-associated cachexia in lung cancer patients using whole-body [18F]FDG-PET/CT imaging: A multi-centre study
- PMID: 39189415
- PMCID: PMC11634466
- DOI: 10.1002/jcsm.13571
Detection of cancer-associated cachexia in lung cancer patients using whole-body [18F]FDG-PET/CT imaging: A multi-centre study
Abstract
Background: Cancer-associated cachexia (CAC) is a metabolic syndrome contributing to therapy resistance and mortality in lung cancer patients (LCP). CAC is typically defined using clinical non-imaging criteria. Given the metabolic underpinnings of CAC and the ability of [18F]fluoro-2-deoxy-D-glucose (FDG)-positron emission tomography (PET)/computer tomography (CT) to provide quantitative information on glucose turnover, we evaluate the usefulness of whole-body (WB) PET/CT imaging, as part of the standard diagnostic workup of LCP, to provide additional information on the onset or presence of CAC.
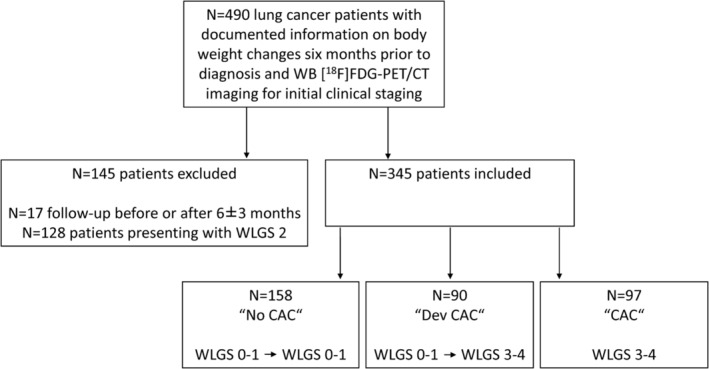
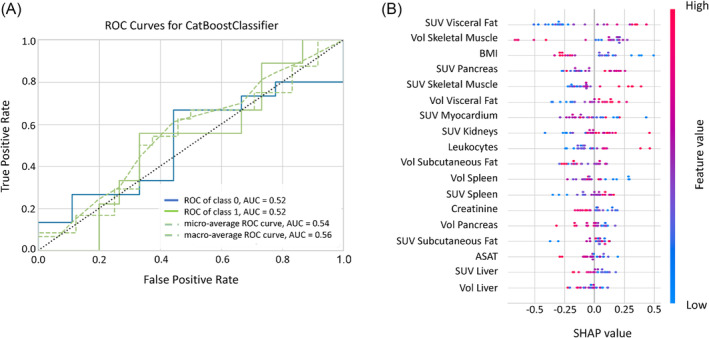
Methods: This multi-centre study included 345 LCP who underwent WB [18F]FDG-PET/CT imaging for initial clinical staging. A weight loss grading system (WLGS) adjusted to body mass index was used to classify LCP into 'No CAC' (WLGS-0/1 at baseline prior treatment and at first follow-up: N = 158, 51F/107M), 'Dev CAC' (WLGS-0/1 at baseline and WLGS-3/4 at follow-up: N = 90, 34F/56M), and 'CAC' (WLGS-3/4 at baseline: N = 97, 31F/66M). For each CAC category, mean standardized uptake values (SUV) normalized to aorta uptake (<SUVaorta>) and CT-defined volumes were extracted for abdominal and visceral organs, muscles, and adipose-tissue using automated image segmentation of baseline [18F]FDG-PET/CT images. Imaging and non-imaging parameters from laboratory tests were compared statistically. A machine-learning (ML) model was then trained to classify LCP as 'No CAC', 'Dev CAC', and 'CAC' based on their imaging parameters. SHapley Additive exPlanations (SHAP) analysis was employed to identify the key factors contributing to CAC development for each patient.
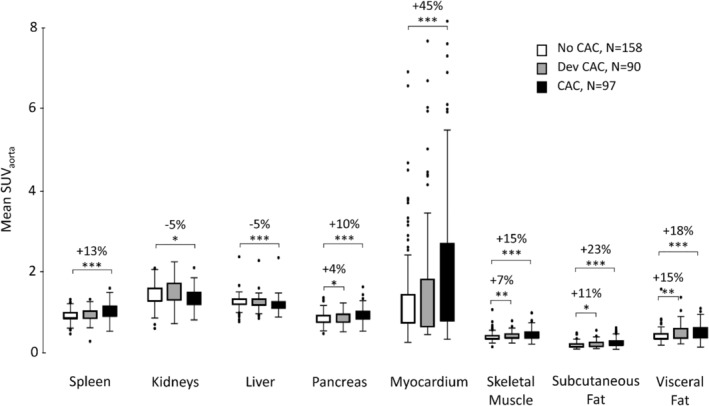
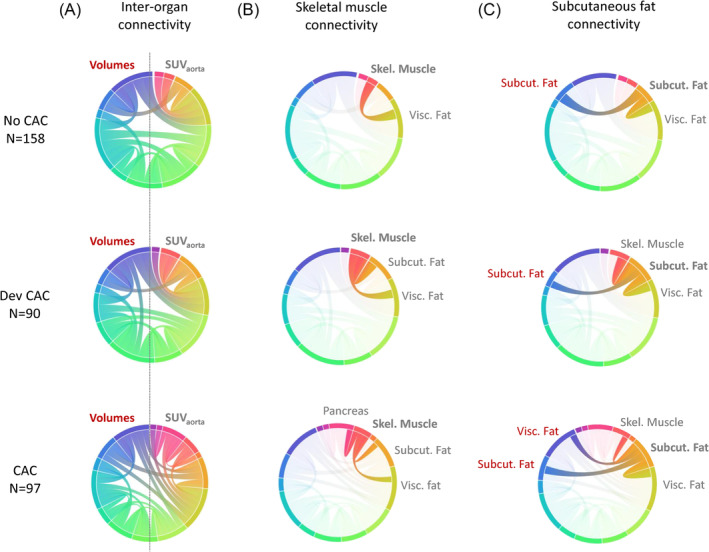
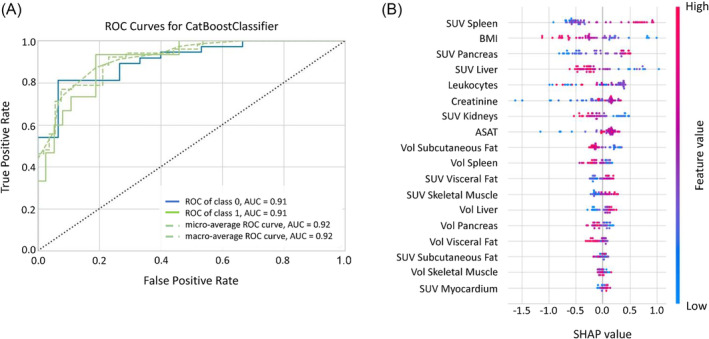
Results: The three CAC categories displayed multi-organ differences in <SUVaorta>. In all target organs, <SUVaorta> was higher in the 'CAC' cohort compared with 'No CAC' (P < 0.01), except for liver and kidneys, where <SUVaorta> in 'CAC' was reduced by 5%. The 'Dev CAC' cohort displayed a small but significant increase in <SUVaorta> of pancreas (+4%), skeletal-muscle (+7%), subcutaneous adipose-tissue (+11%), and visceral adipose-tissue (+15%). In 'CAC' patients, a strong negative Spearman correlation (ρ = -0.8) was identified between <SUVaorta> and volumes of adipose-tissue. The machine-learning model identified 'CAC' at baseline with 81% of accuracy, highlighting <SUVaorta> of spleen, pancreas, liver, and adipose-tissue as most relevant features. The model performance was suboptimal (54%) when classifying 'Dev CAC' versus 'No CAC'.
Conclusions: WB [18F]FDG-PET/CT imaging reveals groupwise differences in the multi-organ metabolism of LCP with and without CAC, thus highlighting systemic metabolic aberrations symptomatic of cachectic patients. Based on a retrospective cohort, our ML model identified patients with CAC with good accuracy. However, its performance in patients developing CAC was suboptimal. A prospective, multi-centre study has been initiated to address the limitations of the present retrospective analysis.
Keywords: Cachexia; Lung cancer; Metabolism; PET/CT; [18F]Fluoro‐2‐deoxy‐D‐glucose.
© 2024 The Author(s). Journal of Cachexia, Sarcopenia and Muscle published by Wiley Periodicals LLC.
Conflict of interest statement
Daria Ferrara, Elisabetta M. Abenavoli, Thomas Beyer, Stefan Gruenert, Marcus Hacker, Swen Hesse, Lukas Hofmann, Smilla Pusitz, Michael Rullmann, Osama Sabri, Peter Sandøe, Roberto Sciagrà, Lalith Kumar Shiyam Sundar, Anke Tönjes, Hubert Wirtz, Josef Yu, and Armin Frille declare that they have no conflict of interest.
Figures
References
Publication types
MeSH terms
Substances
Grants and funding
LinkOut - more resources
Full Text Sources
Medical
