. 2024 Aug;13(16):e70111.
doi: 10.1002/cam4.70111.

Claudin and transmembrane receptor protein gene expressions are reversely correlated in peritumoral brain edema

Affiliations

Claudin and transmembrane receptor protein gene expressions are reversely correlated in peritumoral brain edema

Anwar Abuelrub et al. Cancer Med. 2024 Aug.

Abstract

Introduction: Peritumoral brain edema (PTBE) has been widely reported with many brain tumors, especially with glioma. Since the blood-brain barrier (BBB) is essential for maintaining minimal permeability, any alteration in the interaction of BBB components, specifically in astrocytes and tight junctions (TJ), can result in disrupting the homeostasis of the BBB and making it severely leaky, which subsequently generates edema.

Objective: This study aimed to evaluate the functional gliovascular unit of the BBB by examining changes in the expression of claudin (CLDN) genes and the expression of transient receptor potential (TRP) membrane channels, additionally to define the correlation between their expressions. The evaluation was conducted using in vitro spheroid swelling models and tumor samples from glioma patients with PTBE.

Results: The results of the spheroid model showed that the genes TRPC3, TRPC4, TRPC5, and TRPV1 were upregulated in glioma cells either wild-type isocitrate dehydrogenase 1 (IDH1) or the IDH1 R132H mutant, with or without NaCl treatment. Furthermore, TRP genes appeared to adversely correlate with the up regulation of CLDN1, CLDN3, and CLDN5 genes. Besides, the upregulation of TRPC1 and TRPC4 in IDH1mt-R132H glioma cells. On the other hand, the correlation analysis revealed different correlations between different proteins in PTBE. CLDN1 exhibits a slight positive correlation with CLDN3. Similarly, TRPV1 displays a slight positive correlation with TRPC1. In contrast, TRPC4 shows a slight negative correlation with TRPC5. On the other hand, TRPC3 demonstrates a slight positive correlation with TRPC5, while the non-PTBE analysis highlights a moderate positive correlation between CLDN1 and TRPM4 while CLDN3 exhibits a moderate negative correlation with TRPC4. Additionally, CLDN5 demonstrates a slight negative correlation with TRPC4 but a moderate positive correlation with TRPC3. Furthermore, TRPC1 have a slight negative correlation with TRPV1, TRPC3 exhibiting a slight positive correlation with TRPC4, and TRPV1 showing a slight negative correlation with TRPC5.

Conclusion: As a conclusion, the current study provided evidence of a slight negative correlation between TRPs and CLDN gene expression in PTBE patients and confirmatory results with some of the genes in cell model of edema.

Keywords: IDH; blood–brain barrier; claudin; glioma; peritumoral brain edema; transient receptor proteins.


Conflict of interest statement

The authors declare no conflict of interest.

Figures

FIGURE 1
FIGURE 1
Schematic overview of the study workflow for a 3D spheroid model of the blood–brain barrier.
FIGURE 2
FIGURE 2
(A) The viability investigation of transfected cells with hypotonic treatment showed no significant change in their values, which validates the co‐cultured spheroids as a model for the blood–brain barrier (BBB) in vitro. The effect of subjecting a spheroid model to hypotonic salt concentration (0.002%) denotes a relative gain of extracellular fluids, leading to a significant increase in the diameter of the cell size of spheroids. (B) Disparities in the diameter of cells between the control group (NaCl‐free) ~250 μm (C) and the treated groups with 0.002% NaCl ~750 μm (D) error bars indicate the standard deviation (n = 3).
FIGURE 3
FIGURE 3
(A) A noticeable increase in CLDN1 expression has been observed in transfected IDH1wt spheroids (*p 0.0472) in the absence of 0.002% NaCl. (B) A major increase in the expression of CLDN3 in the absence of 0.002% NaCl in transfected spheroids (IDH1wt *p 0.0470, IDH1mt‐R132H *p 0.0473, IDH1mt‐R132H + IDH Inh‐R132H *p 0.0481). (C) The expression of CLDN5 greatly increased in the absence of 0.002% NaCl (IDH1wt *p 0.0216, and IDH1mt‐R132H + IDH Inh‐R132H *p 0.0384). (D) In the absence of 0.002% NaCl, TRPC1 expression significantly increased (IDH1mt‐R132H *p 0.0240). (E) TRPC3 expression significantly increased in the presence of 0.002% NaCl (IDH1wt *p 0.0338 and IDH1mt‐R132H + IDH Inh‐R132H *p 0.298). (F) Both IDH1wt (0.002% NaCl) and IDH1mt‐R132H (NaCl‐free) TRPC4 expression widely increased (*p 0.0293, *p 0.0294). (G) In the presence of 0.002% NaCl, the expression of TRPC5 increases in the IDH1mt‐R132H + IDH Inh‐R132H *p 0.0211. (H) In the presence of 0.002% NaCl, there is a notable increase in the expression of TRPV1 (IDH1wt *p 0.0277, and IDH1mt‐R132H + IDH Inh‐R132H *p 0.0211). (I) TRPM4 gene expression did not significantly change under any condition. Error bars indicate the standard deviation (n = 3).
FIGURE 4
FIGURE 4
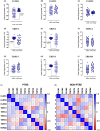
We analyzed six gap junction paracellular pathway‐responsible genes and three transcellular membrane genes in 60 glioma patients. CLDN and TRP have regulatory roles in PTBE in gliomas. Evaluating the expressions of these genes by quantitative RT‐PCR evidenced a marked variation in CLDN1 mRNA levels; in Peritumoral brain edema (PTBE) patients, the expression was significantly higher than patients with no PTBE (****p < 0.0001) (A), while the expression of TRPC1, TRPC3, and TRPV1 was significantly lower in PTBE patients compared to non‐PTBE patients (****p < 0.0001) (D, E, H). On the other hand, no gene expression differences in (B, C, F, G and I) were observed between PTBE and non‐PTBE pateints; conversely, (J) the heatmap of PTBE patients showed a positive correlation between TRP family genes specifically (TRPC1, TRPC3, TRPC4, TRPV1, TRPM4); (K) the non‐PTBE heatmap showed a positive correlation between the CLDN gene family, besides TRPC4 and TRPC5.
FIGURE 5
FIGURE 5
The BBB reversibly expresses claudin (CLDN) and transient receptor channels in astrocytes and endothelial cells in gliovascular units, which significantly increases permeability in cases of peritumoral brain edema. Where the absence and low expression of CLDN in TJ and increased transient receptor channel expression in astrocytes result in excess paracellular and intracellular movement of solutes, nanoparticles, and fluid accumulation.

References

    1. Wu C‐X, Lin G‐S, Lin Z‐X, Zhang J‐D, Liu S‐Y, Zhou C‐F. Peritumoral edema shown by MRI predicts poor clinical outcome in glioblastoma. World J Surg Oncol. 2015;13:97. doi:10.1186/s12957-015-0496-7 - DOI - PMC - PubMed
    1. Wang X, Liu X, Chen Y, et al. Histopathological findings in the peritumoral edema area of human glioma. Histol Histopathol. 2015;30(9):1101‐1109. doi:10.14670/HH-11-607 - DOI - PubMed
    1. Liang HT, Mizumoto M, Ishikawa E, et al. Peritumoral edema status of glioblastoma identifies patients reaching long‐term disease control with specific progression patterns after tumor resection and high‐dose proton boost. J Cancer Res Clin Oncol. 2021;147(12):3503‐3516. doi:10.1007/s00432-021-03765-6 - DOI - PMC - PubMed
    1. Wu Y, Peng Z, Wang H, Xiang W. Identifying the hub genes of glioma peritumoral brain edema using bioinformatical methods. Brain Sci. 2022;12(6):805. doi:10.3390/brainsci12060805 - DOI - PMC - PubMed
    1. Ishihara H, Kubota H, Lindberg RLP, et al. Endothelial cell barrier impairment induced by glioblastomas and transforming growth factor Β2 involves matrix metalloproteinases and tight junction proteins. J Neuropathol Exp Neurol. 2008;67(5):435‐448. - PubMed

MeSH terms