. 2024 Aug;11(32):e2309988.
doi: 10.1002/advs.202309988. Epub 2024 Jun 21.

mRNA-Lipid Nanoparticle-Mediated Restoration of PTPN14 Exhibits Antitumor Effects by Overcoming Anoikis Resistance in Triple-Negative Breast Cancer

Affiliations

mRNA-Lipid Nanoparticle-Mediated Restoration of PTPN14 Exhibits Antitumor Effects by Overcoming Anoikis Resistance in Triple-Negative Breast Cancer

Wei Li et al. Adv Sci (Weinh). 2024 Aug.

Abstract

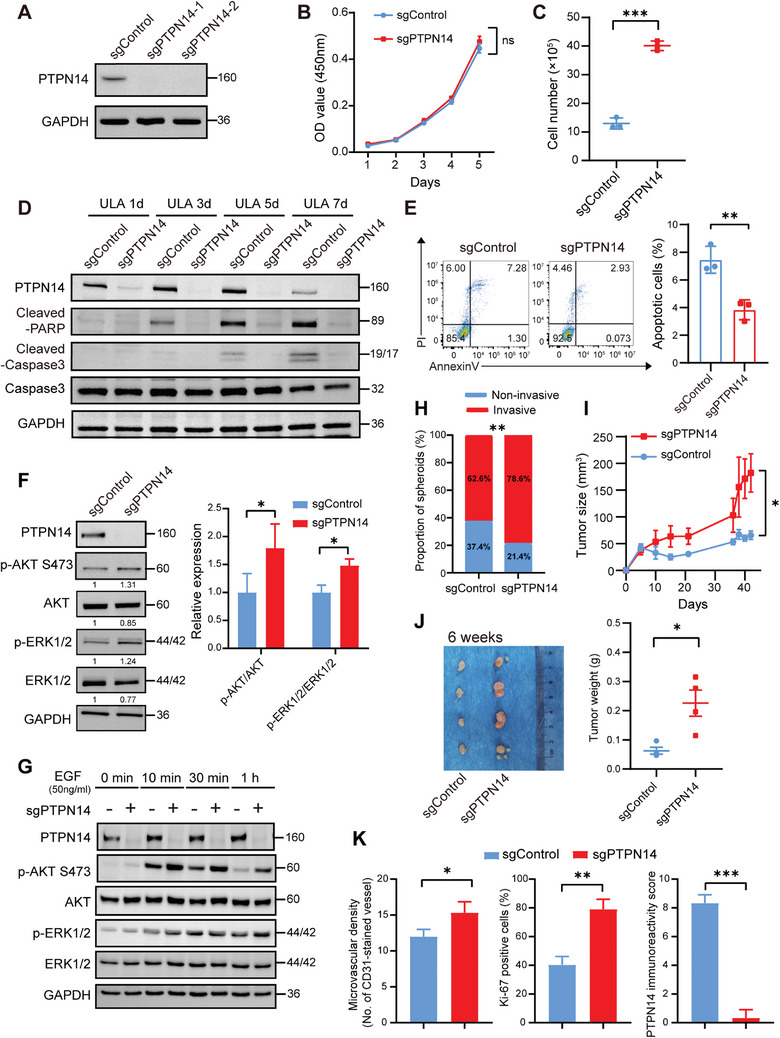
Triple-negative breast cancer (TNBC) poses a challenging prognosis due to early metastasis driven by anoikis resistance. Identifying crucial regulators to overcome this resistance is vital for improving patient outcomes. In this study, a genome-wide CRISPR/Cas9 knockout screen in TNBC cells has identified tyrosine-protein phosphatase nonreceptor type 14 (PTPN14) as a key regulator of anoikis resistance. PTPN14 expression has shown a progressive decrease from normal breast tissue to metastatic tumors. Overexpressing PTPN14 has induced anoikis and inhibited cell proliferation in TNBC cells, while normal human breast cells are unaffected. Mechanistically, PTPN14 is identified as a key factor in dephosphorylating breast cancer antiestrogen resistance 3, a novel substrate, leading to the subsequent inhibition of PI3K/AKT and ERK signaling pathways. Local delivery of in vitro transcribed PTPN14 mRNA encapsulated by lipid nanoparticles in a TNBC mouse model has effectively inhibited tumor growth and metastasis, prolonging survival. The study underscores PTPN14 as a potential therapeutic target for metastatic TNBC, with the therapeutic strategy based on mRNA expression of PTPN14 demonstrating clinical application prospects in alleviating the burden of both primary tumors and metastatic disease.

Keywords: PTPN14; anoikis resistance; cancer therapy; mRNA therapeutics; triple‐negative breast cancer.


Conflict of interest statement

The authors declare no conflict of interest.

Figures

Figure 1
Figure 1
A pooled genome‐wide CRISPR screen in a TNBC anoikis model. A) Genes related to anoikis resistance identified through a genome‐wide CRISPR/Cas9 positive selection screen were ranked based on MAGeCK analysis results, with the top ten genes listed. B) The overlap of the indicated datasets. C) PTPN14, APOLD1, FGL2, and LDLRAD2 mRNA expression levels in 113 breast cancer adjacent samples and 115 TNBC samples from TCGA database. Student's t‐test, *** p < 0.001. D) The mRNA expression levels of PTPN14, APOLD1, FGL2, and LDLRAD2 were assessed in 13 primary breast tumor samples and seven distant metastasis tumor samples from dataset GSE191230 obtained from the GEO database. Student's t‐test, * p < 0.05, ** p < 0.01. E) Representative IHC images (above) and semiquantitative evaluation of PTPN14 IHC expression (below) in paired primary tumors and metastatic tumors (n = 53), and normal breast tissue (n = 11). Dunn's multiple comparisons test following Kruskal–Wallis test, *** p < 0.001. Scale bar: 100 µm. (F) OS (n = 201, low expression: 140; high expression: 61) and RFS (n = 417, low expression: 234; high expression: 183) were summarized in the high and low PTPN14 expression groups by using Kaplan–Meier survival curves in TNBC. Log‐rank test, with p < 0.05 indicating statistical significance.
Figure 2
Figure 2
PTPN14 knockout promoted anoikis resistance and in vivo tumorigenicity in TNBC cells. A) Validation of PTPN14 knockout in MDA‐MB‐231 cells through Western Blotting. Three independent experiments were performed. B) Cell proliferation of the control and PTPN14‐KO MDA‐MB‐231 cells in monolayer adherent culture was assessed every 24 h for 5 days using the CCK‐8 assay (n = 3). Student's t‐test, with p < 0.05 indicating statistical significance. C) The counts of living cells for both control MDA‐MB‐231 cells and PTPN14‐KO MDA‐MB‐231 cells were determined after culturing under ULA conditions for 7 days (n = 3). Student's t‐test, *** p < 0.001. D) Assessing the expression levels of apoptotic proteins in control MDA‐MB‐231 cells and PTPN14‐KO MDA‐MB‐231 cells after culturing under ULA conditions for 1 day, 3 days, 5 days, and 7 days. Three independent experiments were performed. E) After culturing for 3 days under ULA conditions, cell apoptosis was measured by flow cytometry in both control MDA‐MB‐231 cells and PTPN14‐KO MDA‐MB‐231 cells. Left, representative flow cytometry result plots; right, statistical summaries of the results from three independent experiments. Student's t‐test, ** p < 0.01. F) Western Blot analysis was performed to assess the phosphorylation of AKT and ERK in PTPN14‐KO MDA‐MB‐231 cells after 12 h of culture under ULA condition (left), along with statistical summaries of the results from three independent experiments (right). Student's t‐test, * p < 0.05. G) PTPN14‐KO and control MDA‐MB‐231 cells were serum‐starved for 24 h and stimulated with EGF for the indicated time, and Western Blot analysis was performed to assess their AKT and ERK phosphorylation. Three independent experiments were performed. H) Quantification of two types of clonal spheroids in the 3D invasion analysis of control and PTPN14‐KO MDA‐MB‐231 cells (n = 3). Student's t‐test, ** p < 0.01. I) The tumor growth curves of the sgControl group and the sgPTPN14 group (n = 4). Student's t‐test, * p < 0.05, error bars represent the SEM. J) After 6 weeks, the tumors formed by control MDA‐MB‐231 cells and PTPN14‐KO MDA‐MB‐231 cells were excised, photographed (left) and weighed (right) (n = 4). Student's t‐test, * p < 0.05, error bars represent the SEM. K) Quantification of CD31, Ki‐67, and PTPN14 IHC staining results of two groups of tumor sections (n = 3). Student's t‐test, * p < 0.05, ** p < 0.01, *** p < 0.001.
Figure 3
Figure 3
PTPN14 overexpression induced anoikis and suppressed in vivo tumorigenicity and pulmonary metastasis in TNBC cells. A) Validation of PTPN14 overexpression in MDA‐MB‐231 cells through Western Blotting. Three independent experiments were performed. B) Cell proliferation of the control and PTPN14‐OE MDA‐MB‐231 cells in monolayer adherent culture was assessed every 24 h for 5 days using the CCK‐8 assay (n = 3). Student's t‐test, *** p < 0.001. C) The counts of living cells for both control MDA‐MB‐231 cells and PTPN14‐OE MDA‐MB‐231 cells were determined after culturing under ULA conditions for 7 days (n = 3). Student's t‐test, *** p < 0.001. D) Assessing the expression levels of apoptotic proteins in control MDA‐MB‐231 cells and PTPN14‐OE MDA‐MB‐231 cells after culturing under ULA conditions for 1, 2, and 3 days. Three independent experiments were performed. (E) Western Blot analysis was performed to assess the phosphorylation of AKT and ERK in PTPN14‐OE MDA‐MB‐231 cells after 12 h of culture under ULA condition (above), along with statistical summaries of the results from three independent experiments (below). Student's t‐test, * p < 0.05. F) PTPN14‐OE and control MDA‐MB‐231 cells were serum‐starved for 24 h and stimulated with EGF for the indicated time, and Western Blot analysis was performed to assess their AKT and ERK phosphorylation. Three independent experiments were performed. G) Quantification of two types of clonal spheroids in the 3D invasion analysis of control and PTPN14‐OE MDA‐MB‐231 cells (n = 3). Student's t‐test, ** p < 0.01. (H) The tumor growth curves of the control group and the PTPN14‐HA group (n = 4). Student's t‐test, *** p < 0.001, error bars represent the SEM. I) After 9 weeks, the tumors formed by control MDA‐MB‐231 cells and PTPN14‐OE MDA‐MB‐231 cells were excised, photographed (left), and weighed (right) (n = 4). Student's t‐test, *** p < 0.001, error bars represent the SEM. J) Quantification of CD31, Ki‐67, and PTPN14 IHC staining results of two groups of tumor sections (n = 3). Student's t‐test, * p < 0.05, ** p < 0.01, *** p < 0.001. K) Quantification of bioluminescence intensity of ex vivo lung imaging (n = 6). Student's t‐test, *** p < 0.001. L) Representative images of H&E staining in lung tissue sections from two groups of mice (left), along with counting and statistical analysis of tumor metastatic sites (right) (n = 6). The black arrow indicates the metastatic site. Scale bar: 100 µm. Student's t‐test, *** p < 0.001, error bars represent the SEM.
Figure 4
Figure 4
BCAR3 was identified as a substrate of PTPN14. A) The results of IP‐MS, following CompPASS analysis, yielded high‐confidence candidate PTPN14‐interacting proteins. B) Exogenous IP‐Western Blot analysis validated the interaction of PTPN14 and BCAR3. Three independent experiments were performed. C) Endogenous IP‐Western Blot analysis validated the interaction of PTPN14 and BCAR3. D) BCAR3 was knockdown in control or PTPN14‐KO MDA‐MB‐231 cells and cell viability under ULA conditions was assessed every 24 h for 5 days using the CCK8 assay (left); validation of protein expression levels in each cell group through Western Blotting (right). Three independent experiments were performed. E) After the knockdown of BCAR3 in PTPN14‐KO MDA‐MB‐231 cells, the phosphorylation levels of AKT and ERK were assessed. Three independent experiments were performed. F) Tyrosine phosphorylated protein IP‐Western Blot analysis was conducted in both control MDA‐MB‐231 cells and PTPN14‐KO MDA‐MB‐231 cells. Three independent experiments were performed. G) Tyrosine phosphorylated protein IP‐Western Blot analysis was conducted in both PTPN14‐HA MDA‐MB‐231 cells and PTPN14‐D1079A‐HA MDA‐MB‐231 cells.
Figure 5
Figure 5
Expression of PTPN14 mRNA in vitro. A) Validation of PTPN14 overexpression in MCF10A cells through Western Blotting. Three independent experiments were performed. B) Cell proliferation of the control and PTPN14‐OE MCF10A cells in monolayer adherent culture were assessed every 24 h for 5 days using the CCK‐8 assay (n = 3). Student's t‐test, with p < 0.05 indicating statistical significance. C) Representative images of colony formation assays in the control and PTPN14‐OE MCF10A cells (left), along with statistical summaries of the results from three independent experiments (right). Student's t‐test, with p < 0.05 indicating statistical significance. D) Western Blot analysis compared the expression level of PTPN14 in HC11 cells and 4T1 cells. Three independent experiments were performed. E) After transfection of HEK293T cells with PTPN14 mRNA and EGFP mRNA separately for 24 h, the expression of PTPN14 was assessed by Western Blot. Three independent experiments were performed. F) Cryo‐TEM images of PTPN14 mRNA‐LNPs. G) Particle size distribution and PDI of LNPs. d.nm, diameter (nm).
Figure 6
Figure 6
Effects of PTPN14 mRNA‐LNPs on the growth and metastasis of 4T1 tumors. A) The workflow diagram of a therapeutic experiment involving PTPN14 mRNA‐LNPs in the 4T1 tumor model. B) In vivo imaging of mice from each group on the 7th and 25th days post‐4T1 tumor inoculation (left), along with the corresponding quantification of bioluminescence intensity (right) (n = 6). Tukey's multiple comparisons test following one‐way ANOVA, ** p < 0.01, error bars represent the SEM. C) The growth curves of tumors in response to different treatments (n = 6). Tukey's multiple comparisons test following one‐way ANOVA, * p < 0.05, *** p < 0.001, error bars represent the SEM. D) On the 27th day post‐4T1 tumor inoculation, the orthotopic tumors were surgically excised, photographed (left), and weighed (right) (n = 6). Tukey's multiple comparisons test following one‐way ANOVA, * p < 0.05, *** p < 0.001, error bars represent the SEM. E) Quantification of CD31 and Ki‐67 IHC staining results of three groups of tumor sections (n = 3). Tukey's multiple comparisons test following one‐way ANOVA, * p < 0.05, ** p < 0.01. F) In vivo imaging of mice from each group on the 42nd day post‐4T1 tumor inoculation. G) Quantification of bioluminescence intensity of total tumor burden for each group from days 29–75 post‐4T1 tumor inoculation. Error bars represent the SEM. H) Survival curves. Log‐rank [Mantel–Cox] test, * p < 0.05.

References

    1. Sung H., Ferlay J., Siegel R. L., Laversanne M., Soerjomataram I., Jemal A., Bray F., CA Cancer J. Clin. 2021, 71, 209. - PubMed
    1. a) Lin N. U., Vanderplas A., Hughes M. E., Theriault R. L., Edge S. B., Wong Y. N., Blayney D. W., Niland J. C., Winer E. P., Weeks J. C., Cancer 2012, 118, 5463; - PMC - PubMed
    2. b) Prat A., Lluch A., Albanell J., Barry W. T., Fan C., Chacon J. I., Parker J. S., Calvo L., Plazaola A., Arcusa A., Segui‐Palmer M. A., Burgues O., Ribelles N., Rodriguez‐Lescure A., Guerrero A., Ruiz‐Borrego M., Munarriz B., Lopez J. A., Adamo B., Cheang M. C., Li Y., Hu Z., Gulley M. L., Vidal M. J., Pitcher B. N., Liu M. C., Citron M. L., Ellis M. J., Mardis E., Vickery T., et al., Br. J. Cancer 2014, 111, 1532; - PMC - PubMed
    3. c) Borri F., Granaglia A., Semin. Cancer Biol. 2021, 72, 136. - PubMed
    1. Gilmore A. P., Cell Death Differ. 2005, 2, 1473. - PubMed
    1. Dai Y., Zhang X., Ou Y., Zou L., Zhang D., Yang Q., Qin Y., Du X., Li W., Yuan Z., Xiao Z., Wen Q., Cell. Commun. Signal 2023, 21, 190. - PMC - PubMed
    1. a) Marcotte R., Sayad A., Brown K. R., Sanchez‐Garcia F., Reimand J., Haider M., Virtanen C., Bradner J. E., Bader G. D., Mills G. B., Pe'er D., Moffat J., Neel B. G., Cell 2016, 164, 293; - PMC - PubMed
    2. b) Tsherniak A., Vazquez F., Montgomery P. G., Weir B. A., Kryukov G., Cowley G. S., Gill S., Harrington W. F., Pantel S., Krill‐Burger J. M., Meyers R. M., Ali L., Goodale A., Lee Y., Jiang G., Hsiao J., Gerath W. F. J., Howell S., Merkel E., Ghandi M., Garraway L. A., Root D. E., Golub T. R., Boehm J. S., Hahn W. C., Cell 2017, 170, 564. - PMC - PubMed

LinkOut - more resources