

Automated Pain Spots Recognition Algorithm Provided by a Web Service-Based Platform: Instrument Validation Study
- PMID: 39189897
- PMCID: PMC11370187
- DOI: 10.2196/53119
Automated Pain Spots Recognition Algorithm Provided by a Web Service-Based Platform: Instrument Validation Study
Abstract
Background: Understanding the causes and mechanisms underlying musculoskeletal pain is crucial for developing effective treatments and improving patient outcomes. Self-report measures, such as the Pain Drawing Scale, involve individuals rating their level of pain on a scale. In this technique, individuals color the area where they experience pain, and the resulting picture is rated based on the depicted pain intensity. Analyzing pain drawings (PDs) typically involves measuring the size of the pain region. There are several studies focusing on assessing the clinical use of PDs, and now, with the introduction of digital PDs, the usability and reliability of these platforms need validation. Comparative studies between traditional and digital PDs have shown good agreement and reliability. The evolution of PD acquisition over the last 2 decades mirrors the commercialization of digital technologies. However, the pen-on-paper approach seems to be more accepted by patients, but there is currently no standardized method for scanning PDs.
Objective: The objective of this study was to evaluate the accuracy of PD analysis performed by a web platform using various digital scanners. The primary goal was to demonstrate that simple and affordable mobile devices can be used to acquire PDs without losing important information.
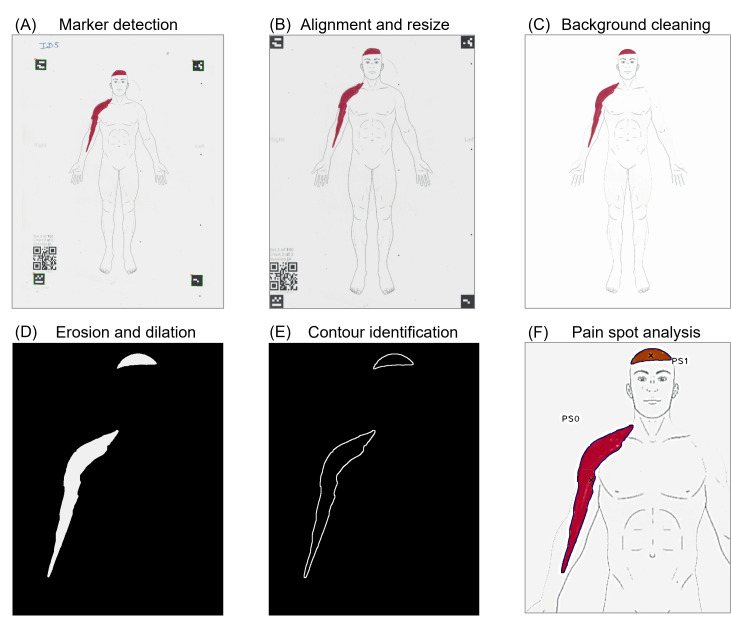
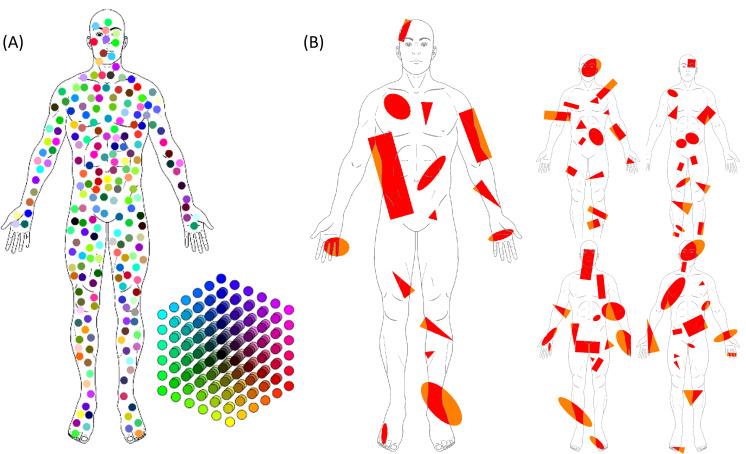
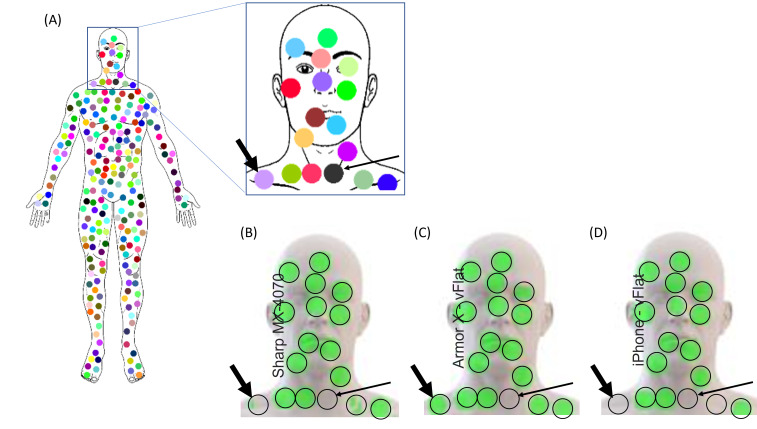
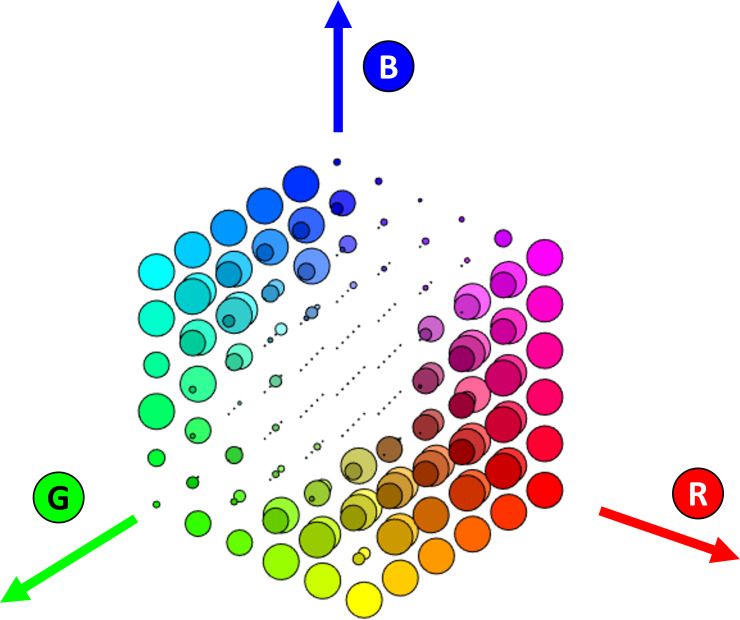
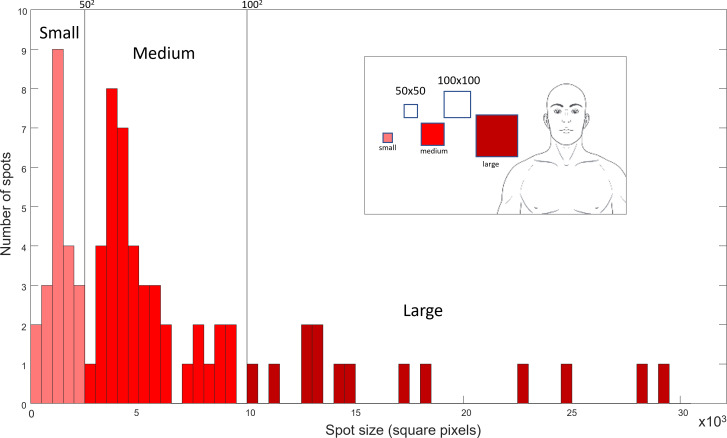
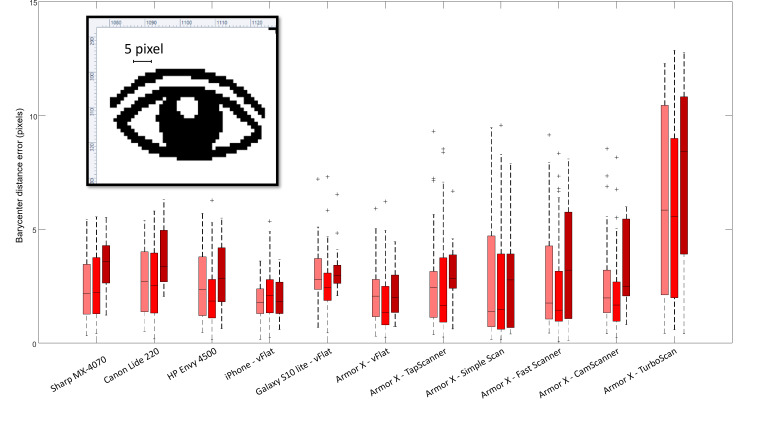
Methods: Two sets of PDs were generated: one with the addition of 216 colored circles and another composed of various red shapes distributed randomly on a frontal view body chart of an adult male. These drawings were then printed in color on A4 sheets, including QR codes at the corners in order to allow automatic alignment, and subsequently scanned using different devices and apps. The scanners used were flatbed scanners of different sizes and prices (professional, portable flatbed, and home printer or scanner), smartphones with varying price ranges, and 6 virtual scanner apps. The acquisitions were made under normal light conditions by the same operator.
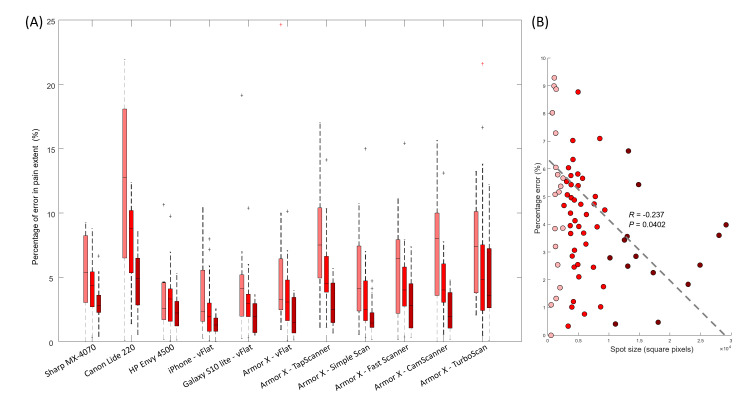
Results: High-saturation colors, such as red, cyan, magenta, and yellow, were accurately identified by all devices. The percentage error for small, medium, and large pain spots was consistently below 20% for all devices, with smaller values associated with larger areas. In addition, a significant negative correlation was observed between the percentage of error and spot size (R=-0.237; P=.04). The proposed platform proved to be robust and reliable for acquiring paper PDs via a wide range of scanning devices.
Conclusions: This study demonstrates that a web platform can accurately analyze PDs acquired through various digital scanners. The findings support the use of simple and cost-effective mobile devices for PD acquisition without compromising the quality of data. Standardizing the scanning process using the proposed platform can contribute to more efficient and consistent PD analysis in clinical and research settings.
Keywords: accuracy; accurate; app; applications; apps; body chart; body charts; device; devices; draw; drawing; image; image processing; images; mobile phone; musculoskeletal; pain; pain drawing; picture; pictures; reliability; reliable; scale; scan; scanner; scanners; smartphone; smartphones.
© Corrado Cescon, Giuseppe Landolfi, Niko Bonomi, Marco Derboni, Vincenzo Giuffrida, Andrea Emilio Rizzoli, Paolo Maino, Eva Koetsier, Marco Barbero. Originally published in JMIR mHealth and uHealth (https://mhealth.jmir.org).
Conflict of interest statement
Figures
References
-
- Ekman EF, Koman LA. Acute pain following musculoskeletal injuries and orthopaedic surgery: mechanisms and management. Instr Course Lect. 2005;54:21–33. Medline. - PubMed
MeSH terms
LinkOut - more resources
Full Text Sources
Miscellaneous
