

Assessing the Effect of Electronic Health Record Data Quality on Identifying Patients With Type 2 Diabetes: Cross-Sectional Study
- PMID: 39189917
- PMCID: PMC11370182
- DOI: 10.2196/56734
Assessing the Effect of Electronic Health Record Data Quality on Identifying Patients With Type 2 Diabetes: Cross-Sectional Study
Abstract
Background: Increasing and substantial reliance on electronic health records (EHRs) and data types (ie, diagnosis, medication, and laboratory data) demands assessment of their data quality as a fundamental approach, especially since there is a need to identify appropriate denominator populations with chronic conditions, such as type 2 diabetes (T2D), using commonly available computable phenotype definitions (ie, phenotypes).
Objective: To bridge this gap, our study aims to assess how issues of EHR data quality and variations and robustness (or lack thereof) in phenotypes may have potential impacts in identifying denominator populations.
Methods: Approximately 208,000 patients with T2D were included in our study, which used retrospective EHR data from the Johns Hopkins Medical Institution (JHMI) during 2017-2019. Our assessment included 4 published phenotypes and 1 definition from a panel of experts at Hopkins. We conducted descriptive analyses of demographics (ie, age, sex, race, and ethnicity), use of health care (inpatient and emergency room visits), and the average Charlson Comorbidity Index score of each phenotype. We then used different methods to induce or simulate data quality issues of completeness, accuracy, and timeliness separately across each phenotype. For induced data incompleteness, our model randomly dropped diagnosis, medication, and laboratory codes independently at increments of 10%; for induced data inaccuracy, our model randomly replaced a diagnosis or medication code with another code of the same data type and induced 2% incremental change from -100% to +10% in laboratory result values; and lastly, for timeliness, data were modeled for induced incremental shift of date records by 30 days to 365 days.
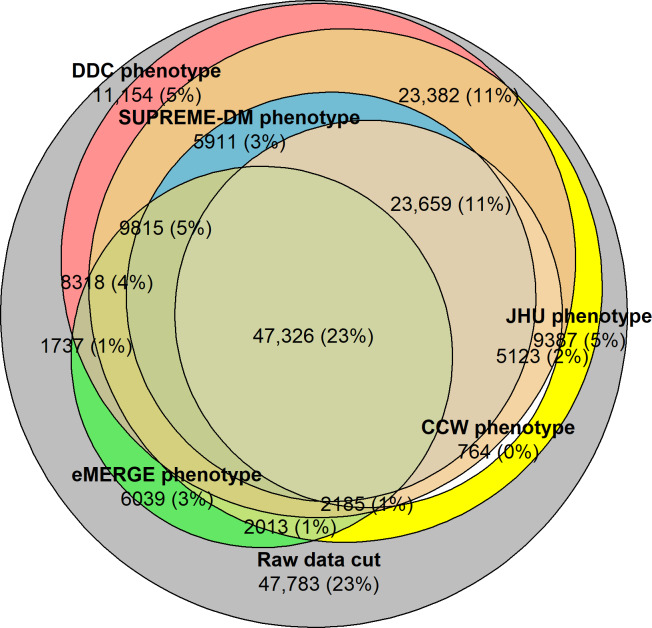
Results: Less than a quarter (n=47,326, 23%) of the population overlapped across all phenotypes using EHRs. The population identified by each phenotype varied across all combinations of data types. Induced incompleteness identified fewer patients with each increment; for example, at 100% diagnostic incompleteness, the Chronic Conditions Data Warehouse phenotype identified zero patients, as its phenotypic characteristics included only diagnosis codes. Induced inaccuracy and timeliness similarly demonstrated variations in performance of each phenotype, therefore resulting in fewer patients being identified with each incremental change.
Conclusions: We used EHR data with diagnosis, medication, and laboratory data types from a large tertiary hospital system to understand T2D phenotypic differences and performance. We used induced data quality methods to learn how data quality issues may impact identification of the denominator populations upon which clinical (eg, clinical research and trials, population health evaluations) and financial or operational decisions are made. The novel results from our study may inform future approaches to shaping a common T2D computable phenotype definition that can be applied to clinical informatics, managing chronic conditions, and additional industry-wide efforts in health care.
Keywords: DM; EHR; EHRs; chronic; clinical research and trial; computable; computable phenotypes; data quality; data science; data types—diagnosis data, medication data, laboratory data; diabetes; diabetic; diagnose; diagnoses; diagnosis; diagnostic; diagnostics; electronic health record; hospital system; identification; identify; phenotype; phenotypes; phenotypic; phenotyping; record; records; type 2; type-2 diabetes.
© Priyanka Dua Sood, Star Liu, Harold Lehmann, Hadi Kharrazi. Originally published in JMIR Medical Informatics (https://medinform.jmir.org).
Conflict of interest statement
Figures


References
-
- National Diabetes Statistics Report 2020 estimate of diabetes and its burden in the United States. Diabetes Research Institute. 2022. [13-07-2023]. https://diabetesresearch.org/wp-content/uploads/2022/05/national-diabete... URL. Accessed.
-
- Validating type 1 and type 2 diabetes mellitus in the Minisentinel Distributed Database using the Surveillance, Prevention, and Management of Diabetes Mellitus (SUPREME-DM) datalink. Sentinel Initiative. [20-06-2022]. https://www.sentinelinitiative.org/sites/default/files/Methods/Mini-Sent... URL. Accessed.
-
- 27 CCW chronic conditions algorithms. Chronic Conditions Data Warehouse. 2022. [13-04-2022]. https://www2.ccwdata.org/documents/10280/19139608/ccw-cond-algo-diabetes... URL. Accessed.
-
- Pacheco J, Thompson W. Type 2 diabetes mellitus. PheKB. 2012. [09-07-2024]. https://phekb.org/phenotype/18 URL. Accessed.
LinkOut - more resources
Full Text Sources
Miscellaneous
