. 2024 Dec 1;116(12):1961-1978.
doi: 10.1093/jnci/djae207.

Integrative multi-omics characterization of hepatocellular carcinoma in Hispanic patients

Affiliations

Integrative multi-omics characterization of hepatocellular carcinoma in Hispanic patients

Debodipta Das et al. J Natl Cancer Inst. .

Abstract

Background: The incidence and mortality rates of hepatocellular carcinoma among Hispanic individuals in the United States are much higher than in non-Hispanic White people. We conducted multi-omics analyses to elucidate molecular alterations in hepatocellular carcinoma among Hispanic patients.

Methods: Paired tumor and adjacent nontumor samples were collected from 31 Hispanic hepatocellular carcinomas in South Texas for genomic, transcriptomic, proteomic, and metabolomic profiling. Serum lipids were profiled in 40 Hispanic and non-Hispanic patients with or without clinically diagnosed hepatocellular carcinoma.

Results: Exome sequencing revealed high mutation frequencies of AXIN2 and CTNNB1 in South Texas Hispanic hepatocellular carcinoma patients, suggesting a predominant activation of the Wnt/β-catenin pathway. TERT promoter mutations were also statistically significantly more frequent in the Hispanic cohort (Fisher exact test, P < .05). Cell cycles and liver function were positively and negatively enriched, respectively, with gene set enrichment analysis. Gene sets representing specific liver metabolic pathways were associated with dysregulation of corresponding metabolites. Negative enrichment of liver adipogenesis and lipid metabolism corroborated with a significant reduction in most lipids in serum samples of hepatocellular carcinoma patients (paired t test, P < .0001). Two hepatocellular carcinoma subtypes from our Hispanic cohort were identified and validated with the Cancer Genome Atlas liver cancer cohort. Patients with better overall survival showed higher activity of immune and angiogenesis signatures and lower activity of liver function-related gene signatures. They also had higher levels of immune checkpoint and immune exhaustion markers.

Conclusions: Our study revealed specific molecular features of Hispanic hepatocellular carcinoma and potential biomarkers for therapeutic management. It provides a unique resource for studying Hispanic hepatocellular carcinoma.


Conflict of interest statement

The authors have no competing interest to declare.

Figures

Figure 1.
Figure 1.
Demographic and clinical information of hepatocellular carcinoma patients and sequencing data. A) Multi-omics data modalities for paired tumor and nontumor tissues from South Texas Hispanic hepatocellular carcinoma patients are shown in different rows. Each column indicates 1 patient. B) Clinical characteristics of 40 samples screened for serum lipid profiles. BMI = body mass index, kg/m2; HBV = hepatitis B; HCC = hepatocellular carcinoma; HCV = hepatitis C; N/A = not available; NAFLD = nonalcoholic fatty liver disease; NASH = nonalcoholic steatohepatitis; seq = sequencing; STX = South Texas; TCB = Transplant Center Biorepository.
Figure 2.
Figure 2.
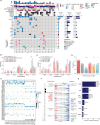
The mutational landscape of hepatocellular carcinoma in South Texas Hispanic patients. A) Genetic profiles and associated clinicopathologic characteristics of 27 South Texas Hispanic hepatocellular carcinoma patients. Bar plots on the right indicate mutation frequencies; left: 27 discovery samples; middle: 38 validation samples; right: 363 Cancer Genome Atlas Liver Hepatocellular Carcinoma cohort (TCGA-LIHC) samples. B and C) Mutation frequencies of 5 recurrently mutated genes between South Texas Hispanic hepatocellular carcinoma and TCGA-LIHC or ICGC (International Cancer Genome Consortium) hepatocellular carcinoma cohorts of different ethnicities. D) TERT promoter mutation frequencies between hepatocellular carcinoma patients from different ethnicities. B-D)P values calculated using Fisher exact test. Significance level: *P < .05; **P < .01; ***P < .001. E) Mutational signatures in 27 hepatocellular carcinoma tumors. The size of each dot indicates the average contribution of that signature (in the iterations where contribution was higher than 0). Color of dots are representative of percentage of iterations in which the signature is found (contribution > 0). F) Recurrent copy number amplifications and deletions across 27 South Texas Hispanic hepatocellular carcinoma patients by GISTIC2.0. Annotated peaks have a false discovery rate less than 0.25. Numbers in parentheses indicate number of genes encompassed in the peak. Cancer genes from cancer gene census (Catalogue of Somatic Mutations in Cancer) are annotated for each peak. G) Alteration frequency of oncogenic signaling pathways in South Texas Hispanic hepatocellular carcinoma patients. GISTIC2.0 = Genomic Identification of Significant Targets in Cancer; HBV = hepatitis B; HCC = hepatocellular carcinoma; HCV = hepatitis C; NAFLD = nonalcoholic fatty liver disease; NASH = nonalcoholic steatohepatitis; STX = South Texas.
Figure 3.
Figure 3.
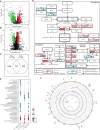
The integrated multi-omics profiling of South Texas Hispanic hepatocellular carcinoma. A) Differentially expressed genes and (B) differentially abundant proteins in tumor vs adjacent nontumor samples. Shown are common genes and proteins among 10% most differentially expressed protein-coding genes and differentially abundant proteins, respectively. Red: upregulated; green: downregulated. C) Intersection of differentially expressed protein-coding genes and differentially abundant proteins. D) Top 3 recurrently altered oncogenic signaling pathways in South Texas Hispanic hepatocellular carcinoma patients. Red boxes: genes with somatic mutations and copy number alterations. Color intensity indicates frequency of activating alterations (red) and inactivating alterations (blue), calculated based on the discovery cohort (n = 27). Cyan boxes: differentially expressed protein-coding genes and differentially abundant proteins. E) Hallmark gene sets significantly enriched in South Texas Hispanic hepatocellular carcinoma and The Cancer Genome Atlas Liver Hepatocellular Carcinoma cohorts. Red dots: positive enrichment; blue dots: negative enrichment. F) Genomic, transcriptomic, and proteomic alterations in South Texas Hispanic hepatocellular carcinoma patients. From outside to inside, the tracks depict the human genome (hg19) ideogram, frequency (number) of genetic alteration, GISTIC2.0 copy-number amplification (red) and deletion (green), log2 (fold-change) of upregulated (pink) and downregulated (blue) differentially expressed protein-coding genes, log2 (fold-change) of increased (purple) and decreased (green) differentially abundant proteins, and fusion genes (orange ribbons). Recurrently mutated genes are noted outside the ideogram. DAP = differentially abundant protein; DEG = differentially expressed protein-coding gene; GISTIC2.0 = Genomic Identification of Significant Targets in Cancer; NES = normalized enrichment score; STX = South Texas; TCGA-LIHC = The Cancer Genome Atlas Liver Hepatocellular Carcinoma.
Figure 4.
Figure 4.
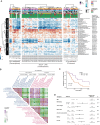
Proteomics and transcriptomics-based classification of hepatocellular carcinoma. A) Left: HM-1 and HM-2 subtypes from unsupervised hierarchical clustering of pathway activities in South Texas Hispanic hepatocellular carcinoma patients; middle: The Cancer Genome Atlas Liver Hepatocellular Carcinoma cohort (TCGA-LIHC); right: South Texas Hispanic proteomics cohort. Pathway activity based on normalized enrichment score from single-sample gene set enrichment analysis. Asterisks indicate statistically significant enrichment (false discovery rate < 0.05). B) Enrichment correlations of selected immune and liver function–related hallmark gene sets using normalized enrichment scores from transcriptome and proteome data of South Texas Hispanic hepatocellular carcinoma patients (based on 6 hepatocellular carcinoma with both datasets). Asterisks indicate significant associations between a pair of gene sets (Pearson correlation; P < .05). C) Kaplan–Meier curve for overall survival in 50 TCGA-LIHC patients stratified by HM-1 and HM-2 clusters. D) Multivariable Cox regression analysis of overall survival in the TCGA cohort (n = 50) after controlling for other clinicopathologic factors shown. BMI = body mass index; HBV = hepatitis B; HCC = hepatocellular carcinoma; HCV = hepatitis C; NAFLD = nonalcoholic fatty liver disease; NES = normalized enrichment score; STX = South Texas; UC = Unclassified.
Figure 5.
Figure 5.
Immune-cell profiling of hepatocellular carcinoma identifies significant differences between the 2 clusters of tumors. A) Stromal score, immune score (immune cell infiltration levels), and tumor purity in hepatocellular carcinoma clusters in South Texas Hispanic and The Cancer Genome Atlas (TCGA) cohorts. B) Hepatocellular carcinoma cluster-wise differences in enrichment of T cell–related gene sets (n = 17). C) Log2 (fold-change) of human leukocyte antigen gene expression (tumor vs paired nontumor) between hepatocellular carcinoma clusters. D) Differential expression of immune checkpoint receptors between clusters. E) Differential expression of immune checkpoint ligands between clusters. F) Differences in tumor mutational burden between clusters. Upper: South Texas Hispanic patients; lower: TCGA Liver Hepatocellular Carcinoma cohort. Statistical significance in panels A-C and F was determined using 2-sided Wilcoxon rank sum tests. P values for panels D and E were calculated using unpaired 2-tailed t tests. Significance level in panels A-E: *P < .05; **P < .01; ***P < .001; ****P < .0001. STX = South Texas; TCGA-LIHC = The Cancer Genome Atlas Liver Hepatocellular Carcinoma.
Figure 6.
Figure 6.
Tissue metabolomic profiles of hepatocellular carcinoma in South Texas Hispanic cohort. A) Partial least squares discriminant analysis of tumor and adjacent nontumor tissue samples from South Texas Hispanic hepatocellular carcinoma patients. B) Eleven statistically significantly enriched pathways in hepatocellular carcinoma tumors. Right: log2 (fold-change) of significantly enriched metabolites against each pathway (paired sample t test, P < .05 and ≥1.5 fold-change). C) Eight significantly negatively enriched GOBP (Gene Ontology Biological Process), KEGG (Kyoto Encyclopedia of Genes and Genomes), and REACTOME (Reactome pathway database) pathways obtained from gene set enrichment analysis using protein abundance in South Texas Hispanic hepatocellular carcinoma patients (left). Right: directional dysregulation of metabolites (tumor vs paired nontumor comparison) from each metabolomic pathway. D) Log2 (fold-change) between phosphoenolpyruvate carboxykinase 1 (protein) and phosphoenolpyruvate (metabolite) levels in South Texas Hispanic hepatocellular carcinoma patients (n = 11) is significantly correlated. E) Two significantly negatively enriched pathways curated using selected metabolites. F) Normalized enrichment scores between hallmark gene sets and curated metabolite sets from single-sample gene set enrichment analyses using proteome and metabolome data, respectively. Asterisks, significant enrichment (false discovery rate < 0.05). G) Normalized enrichment score trends for bile acid metabolism between proteomic or transcriptomic and metabolomic datasets in South Texas Hispanic hepatocellular carcinoma patients (n = 14). Solid lines: concordance; dashed lines: discordance in directionality of enrichment. HCC = hepatocellular carcinoma; NES = normalized enrichment score; PCK1 = phosphoenolpyruvate carboxykinase 1; STX = South Texas.
Figure 7.
Figure 7.
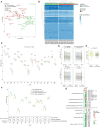
Dysregulated lipids in serum samples of hepatocellular carcinoma patients from different ethnicities. A) Principal components analysis of serum lipid profiles from hepatocellular carcinoma and nonhepatocellular carcinoma individuals from Hispanic and non-Hispanic cohorts. Lipid concentrations were log10 transformed before analysis. B) Independent of ethnicity, hepatocellular carcinoma (n = 20) and nonhepatocellular carcinoma individuals (n = 18) show different lipid profiles. C) Total concentrations of 16 profiled lipid types between hepatocellular carcinoma and nonhepatocellular carcinoma patients. D) Lipid concentrations between hepatocellular carcinoma and nonhepatocellular carcinoma samples and between Hispanic and non-Hispanic samples. Each line connects the same lipids. Dots represent average concentrations. E) Differences in log2-transformed average concentrations [Δ log2 (avg. conc.)] of 289 lipids in Hispanic vs non-Hispanic participants with or without hepatocellular carcinoma. F) Total lipid concentrations for individual lipid types across 4 datasets. Data in panels C and F analyzed using 2-sided Wilcoxon rank sum tests. P values in panels D and E calculated using paired sample t tests. G) Selected lipids showing a similar direction of dysregulation in hepatocellular carcinoma tumor vs adjacent nontumor tissues and hepatocellular carcinoma vs nonhepatocellular carcinoma serum samples in South Texas Hispanic participants. AC = acylcarnitine; aPC = plasmanyl-phosphatidylcholine; CER = ceramide; FA = fatty acyl chains in triacylglycerol; HCC = hepatocellular carcinoma; HNE = 4-hydroxy nonenal; LPC = lyso-phosphatidylcholine; LPE = lyso-phosphatidylethanolamine; PC = phosphatidylcholine; PE = phosphatidylethanolamine; PG = phosphatidylglycerol; PI = phosphatidylinositol; pPC = plasmenyl-phosphatidylcholine; pPE = ethanolamine plasmalogens; PS = phosphatidylserine; SM = sphingomyelin; STX = South Texas; TAG = triacylglycerol.

Update of

References

    1. Sung H, Ferlay J, Siegel RL, et al. Global Cancer Statistics 2020: GLOBOCAN estimates of incidence and mortality worldwide for 36 cancers in 185 countries. CA Cancer J Clin. 2021;71(3):209-249. doi: 10.3322/caac.21660. - DOI - PubMed
    1. Siegel RL, Miller KD, Wagle NS, Jemal A.. Cancer statistics, 2023. CA Cancer J Clin. 2023;73(1):17-48. doi: 10.3322/caac.21763. - DOI - PubMed
    1. Asafo-Agyei KO, Samant H. Hepatocellular carcinoma. In: StatPearls [Internet]. Treasure Island, FL: StatPearls Publishing; 2023.
    1. El-Serag HB, Sardell R, Thrift AP, Kanwal F, Miller P.. Texas has the highest hepatocellular carcinoma incidence rates in the USA. Dig Dis Sci. 2021;66(3):912-916. doi: 10.1007/s10620-020-06231-4. - DOI - PubMed
    1. Thrift AP, Liu KS, Raza SA, El-Serag HB.. Recent decline in the incidence of hepatocellular carcinoma in the United States. Clin Gastroenterol Hepatol. 2022;21(9):2418-2420.e3. doi: 10.1016/j.cgh.2022.07.034. - DOI - PubMed

Substances