. 2024 Oct;55(5):803-823.
doi: 10.1007/s10735-024-10233-1. Epub 2024 Aug 27.

SGLT2 inhibitor downregulated oxidative stress via activating AMPK pathway for cardiorenal (CR) protection in CR syndrome rodent fed with high protein diet

Affiliations

SGLT2 inhibitor downregulated oxidative stress via activating AMPK pathway for cardiorenal (CR) protection in CR syndrome rodent fed with high protein diet

Chih-Chao Yang et al. J Mol Histol. 2024 Oct.

Abstract

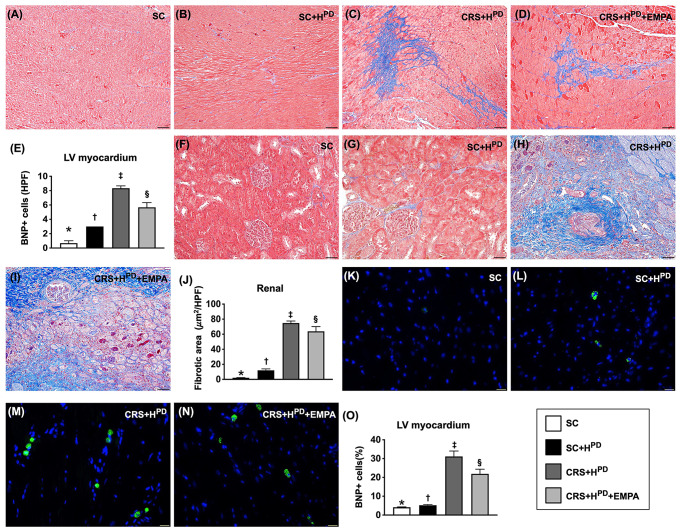
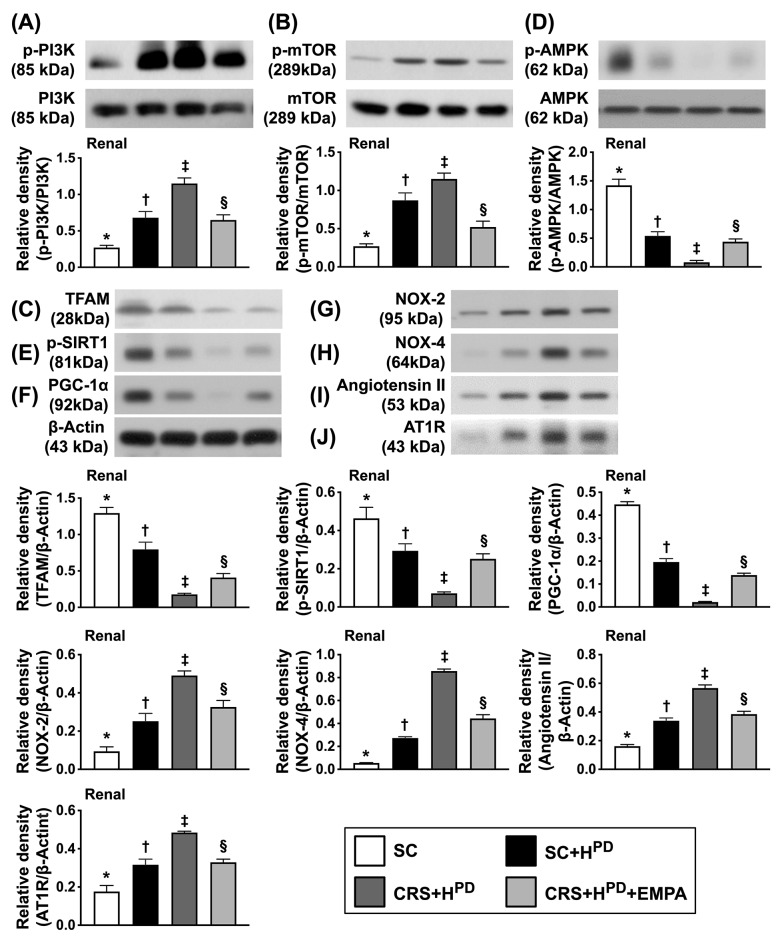
This study tested the hypothesis that empagliflozin (EMPA) therapy effectively protected renal and heart functions via downregulating reactive oxygen species (ROS) and activating AMPK signaling in cardiorenal syndrome (CRS) (induced by doxorubicin-5/6 nephrectomy) rats. In vitro result showed that underwent p-Cresol treatment, the H9C2/NRK-52E cell viabilities, were significantly suppressed, whereas cellular levels of ROS and early/late apoptosis of these cells were significantly increased that were significantly reversed by EMPA treatment (all p < 0.001). The protein levels of the cell-stress/oxidative signaling (p-PI3K/p-Akt/p-mTOR/NOXs/p-DRP1) were significantly activated, whereas the mitochondrial biogenesis signaling (p-AMPK/SIRT-1/TFAM/PGC-1α) was significantly repressed in these two cell lines treated by p-Cresol and all of these were significantly reversed by EMPA treatment (all p < 0.001). Male-adult-SD rats were categorized into groups 1 [sham-operated control (SC)]/2 [SC + high protein diet (HPD) since day 1 after CKD induction]/3 (CRS + HPD)/4 (CRS + HPD+EMPA/20 mg/kg/day) and heart/kidney were harvested by day 60. By day 63, the renal function parameters (creatinine/BUN/proteinuria)/renal artery restrictive index/cellular levels of ROS/inflammation were significantly increased in group 3 than in groups 1/2, whereas heart function exhibited an opposite pattern of ROS among the groups, and all of these parameters were significantly reversed by EMPA treatment (all p < 0.0001). The protein levels of inflammation/ oxidative-stress/cell-stress signalings were highest in group 2, lowest in group 1 and significantly lower in group 4 than in group 2, whereas the AMPK-mitochondrial biogenesis displayed an opposite manner of oxidative-stress among the groups (all p < 0.0001). EMPA treatment effectively protected the heart/kidney against CRS damage via suppressing ROS signaling and upregulating AMPK-mediated mitochondrial biogenesis.

Keywords: Cardiorenal syndrome; Empagliflozin; Inflammation; Mitochondrial biogenesis; Oxidative stress.


Conflict of interest statement

The authors declare no competing interests.

Figures

Fig. 1
Fig. 1
Impact of EMPA therapy on cell viability in NRK-52E cells and H9C2 cells undergoing uremic toxic substance stimulation. (A) MTT assay for identification of NRK-52E cell viability at 24 h, * vs. other groups with different symbols (†, ‡, §), p < 0.001. (B) MTT assay for identification of NRK-52E cell viability at 48 h, * vs. other groups with different symbols (†, ‡, §), p < 0.001. (C) MTT assay for identification of NRK-52E cell viability at 72 h, * vs. other groups with different symbols (†, ‡, §), p < 0.001. (D) MTT assay for identification of H9C2 cell viability at 24 h, * vs. other groups with different symbols (†, ‡, §), p < 0.001. (E) MTT assay for identification of H9C2 cell viability at 48 h, * vs. other groups with different symbols (†, ‡, §), p < 0.001. (F) MTT assay for identification of H9C2 cell viability at 72 h, * vs. other groups with different symbols (†, ‡, §), p < 0.001. All statistical analyses were performed by one-way ANOVA, followed by Bonferroni multiple comparison post hoc test (n = 3 for each group). Symbols (*, †, ‡, §) indicate significance (at 0.05 level). EMPA = empagliflozin
Fig. 2
Fig. 2
Impact of EMPA therapy on alleviating cellular apoptosis of NRK-52E and H9C2 cells undergoing uremic toxic substance stimulation. A-1 to A-4) Illustrating the flow cytometric analysis for identification of NRK-52E cell apoptosis. B) Analytical result of number of early (AN-V+/PI-) apoptotic NRK-52E cells at 48 h, * vs. other groups with different symbols (†, ‡, §), p < 0.001. C) Analytical result of number of late (AN-V+/PI+) apoptotic NRK-52E cells at 48 h, * vs. other groups with different symbols (†, ‡, §), p < 0.001. D) Protein expression of mitochondrial (Mito)-Bax, * vs. other groups with different symbols (†, ‡, §), p < 0.001. E) Protein expression of cleaved caspase 3 (c-Casp3), * vs. other groups with different symbols (†, ‡, §), p < 0.001. F) Protein expression of c-PARP, * vs. other groups with different symbols (†, ‡, §), p < 0.001. G-1 to G-4) Illustrating the flow cytometric analysis for identification of H9C2 cell apoptosis. H) Analytical result of number of early (AN-V+/PI-) apoptotic H9C2 cells at 48 h, * vs. other groups with different symbols (†, ‡, §), p < 0.001. I) Analytical result of number of late (AN-V+/PI+) apoptotic H9C2 cells at 48 h, * vs. other groups with different symbols (†, ‡, §), p < 0.001. J) Protein expression of mitochondrial (Mito)-Bax, * vs. other groups with different symbols (†, ‡, §), p < 0.001. K) Protein expression of cleaved caspase 3 (c-Casp3), * vs. other groups with different symbols (†, ‡, §), p < 0.001. L) Protein expression of c-PARP, * vs. other groups with different symbols (†, ‡, §), p < 0.001. n = 3 for each group
Fig. 3
Fig. 3
Impact of dose-dependent EMPA treatment on attenuating uric toxin substance-induced total intracellular ROS generation in NRK-52E and H9C2 cells. A to E) Illustrating the impact of stepwise increased concentrations of p-Cresol (0, 50, 100µ) on upregulation of total intracellular levels of reactive oxygen species (ROS) (i.e., by DCFDA staining) in NRK-52E (green color) and effect of dose-dependent EMPA treatment on reduction of ROS. F) Analytical result of number of NRK-52E expressed ROS, * vs. other groups with different symbols (†, ‡, §, ¶), p < 0.0001. G to K) Illustrating the impact of stepwise increased concentrations of p-Cresol (0, 50, 100µ) on total intracellular levels of ROS in H9C2 cells (green color) and the effect of dose-dependent EMPA treatment on reduction of ROS. L) Analytical result of number of H9C2 expressed ROS, * vs. other groups with different symbols (†, ‡, §, ¶), p < 0.0001. n = 5 for each group
Fig. 4
Fig. 4
Impact of dose-dependent EMPA treatment on attenuating uric toxin substance-induced mitochondrial ROS generation in NRK-52E and H9C2 cells. A to E) Illustrating the impact of high concentrations of p-Cresol (100µ) on mitochondrial levels of reactive oxygen species (ROS) (i.e., by mitoSOX staining) in NRK-52E (red color) and effect of dose-dependent EMPA treatment on reduction of ROS. F) Analytical result of number of NRK-52E expressed ROS, * vs. other groups with different symbols (†, ‡, §), p < 0.0001. G to K) Illustrating the impact of high concentrations of p-Cresol (100µ) on mitochondrial level of ROS in H9C2 cells (red color) and the effect of dose-dependent EMPA treatment on reduction of ROS. L) Analytical result of number of H9C2 expressed ROS, * vs. other groups with different symbols (†, ‡, §), p < 0.0001. n = 5 for each group
Fig. 5
Fig. 5
Impact EMPA therapy on maintaining mitochondrial biogenesis and redox homeostasis and alleviating the cell stress signalings in NRK-52E cells event undergoing the p-Cresol stimulation. (A) Protein expression of NOX-1, * vs. other groups with different symbols (†, ‡, §), p < 0.001. (B) Protein expression of NOX-4, * vs. other groups with different symbols (†, ‡, §), p < 0.001. (C) Protein expression of phosphorylated (p)-PI3K, * vs. other groups with different symbols (†, ‡, §), p < 0.001. (D) Protein expression of p-Akt, * vs. other groups with different symbols (†, ‡, §), p < 0.001. (E) Protein expression of p-mTOR, * vs. other groups with different symbols (†, ‡, §), p < 0.001. (F) Protein expression of p-DRP1, * vs. other groups with different symbols (†, ‡, §), p < 0.001. (G) Protein expression of p-AMPK, * vs. other groups with different symbols (†, ‡), p < 0.001. (H) Protein expression of SIRT1, * vs. other groups with different symbols (†, ‡, §), p < 0.001. (I) Protein expression of PGC-1α, * vs. other groups with different symbols (†, ‡, §), p < 0.001. (J) Protein expression of mitochondrial transcription factor A (TFAM), * vs. other groups with different symbols (†, ‡, §), p < 0.001. n = 5 for each group
Fig. 6
Fig. 6
Impact EMPA therapy on maintaining mitochondrial biogenesis and redox homeostasis and alleviating the cell stress signalings in H9C2 cells undergoing the p-Cresol stimulation. (A) Protein expression of NOX-1, * vs. other groups with different symbols (†, ‡, §), p < 0.001. (B) Protein expression of NOX-4, * vs. other groups with different symbols (†, ‡, §), p < 0.001. (C) Protein expression of phosphorylated (p)-PI3K, * vs. other groups with different symbols (†, ‡, §), p < 0.001. (D) Protein expression of p-Akt, * vs. other groups with different symbols (†, ‡), p < 0.001. (E) Protein expression of p-mTOR, * vs. other groups with different symbols (†, ‡), p < 0.001. (F) Protein expression of p-DRP1, * vs. other groups with different symbols (†, ‡, §), p < 0.001. (G) Protein expression of p-AMPK, * vs. other groups with different symbols (†, ‡, §), p < 0.001. (H) Protein expression of SIRT1, * vs. other groups with different symbols (†, ‡, §), p < 0.001. (I) Protein expression of PGC-1α, * vs. other groups with different symbols (†, ‡, §), p < 0.001. (J) Protein expression of mitochondrial transcription factor A (TFAM), * vs. other groups with different symbols (†, ‡, §), p < 0.001. n = 5 for each group
Fig. 7
Fig. 7
Serial changes of renal artery restrictive index (RARI) and heart function in CRS animals. (A) RARI at day 0, p > 0.5. (B) RARI at day 35, * vs. †, p < 0.0001. (C) RARI at day 63, * vs. other groups with different symbols (†, ‡), p < 0.001; at day 63, CRS + HPD vs. CRS + HPD+EMPA, p < 0.05. (D) LVEF at day 0, p > 0.5. (E) LVEF at day 35, * vs. other groups with different symbols (†, ‡), p < 0.001. (F) LVEF at day 63, * vs. other groups with different symbols (†, ‡, §), p < 0.001; at day 63, CRS + HPD vs. CRS + HPD+EMPA, p < 0.01. (G) Circulatory blood urine nitrogen (BUN) level at day 0, p > 0.5. (H) Circulatory creatinine level at day 0, p > 0.5. (I) Ratio of urine protein to urine creatinine (RUP/UC) at day 0, p > 0.5. (J) Circulatory BUN level at day 35, * vs. †, p < 0.001. K) Circulatory creatinine level at day 35, * vs. †, p < 0.001. L) The RUP/UC at day 35, * vs. †, p < 0.0001. M) Circulatory BUN level at day 42, * vs. other groups with different symbols (†, ‡) p < 0.0001. N) Circulatory creatinine level at day 42, * vs. other groups with different symbols (†, ‡), p < 0.0001; at day 42, CRS + HPD vs. CRS + HPD+EMPA, p < 0.001. O) The RUP/UC at day 42, * vs. other groups with different symbols (†, ‡), p < 0.0001; at day 42, CRS + HPD vs. CRS + HPD+EMPA, p < 0.001. P) Circulatory BUN level at day 63, * vs. other groups with different symbols (†, ‡), p < 0.0001; at day 42, CRS + HPD vs. CRS + HPD+EMPA, p < 0.001. Q) Circulatory creatinine level at day 63, * vs. other groups with different symbols (†, ‡), p < 0.0001; at day 42, CRS + HPD vs. CRS + HPD+EMPA, p < 0.001. R) The RUP/UC at day 63, * vs. other groups with different symbols (†, ‡), p < 0.0001; at day 42, CRS + HPD vs. CRS + HPD+EMPA, p < 0.001. n = 8–10 for each group. LVEF = left ventricular ejection fraction; HPD = high protein diet; CRS = cardiorenal syndrome
Fig. 8
Fig. 8
Impact of EMPA treatment on alleviating heart and kidney fibrosis, and pressure overload/heart failure biomarker in LV myocardium by day 63 after CRS induction. A to D) Illustrating the microscopic finding (100x) for identification of myocardial fibrotic change (blue color). E) Analytical result of myocardial fibrotic area, * vs. other groups with different symbols (†, ‡, §), p < 0.0001. F to I) Illustrating the microscopic finding (100x) for identification of renal fibrotic area (blue color). J) Analytical result of renal fibrotic area, * vs. other groups with different symbols (†, ‡, §), p < 0.0001. Scale bar in right lower corner represents 100 μm. K to N) Illustrating the immunofluorescent microscopic finding (800x) for identification of cellular expression of brain uretic peptide (BNP) (green color). Analytical result of number of BNP + cells in LV myocardium, * vs. other groups with different symbols (†, ‡, §), p < 0.0001. Scale bar in right lower corner represents 20 μm. n = 6–8 for each group. CKD = chronic kidney disease
Fig. 9
Fig. 9
Impact of EMPA treatment on alleviating ROS generation in the heart and kidney by day 63 after CRS induction. A to D) Illustrating the immunofluorescent (IF) microscopic finding (400x) for identification of cellular level of ROS (i.e., by H2DCFDA stain) in myocardium (green color). E) Analytical result of mean fluorescent intensity, * vs. other groups with different symbols (†, ‡, §), p < 0.0001. F to I) Illustrating the IF microscopic finding (400x) for identification of cellular level of ROS (i.e., by H2DCFDA stain) in kidney (green color). J) Analytical result of mean fluorescent intensity, * vs. other groups with different symbols (†, ‡, §), p < 0.0001. Scale bar in right lower corner represents 20 μm. n = 6 for each group
Fig. 10
Fig. 10
Impact of EMPA treatment on alleviating inflammatory reaction, and protein levels of apoptosis and BNP in heart and kidney tissues by day 63 after CRS induction. A to D) Illustrating the microscopic finding (200x) of immunohistochemical stain for identification of cellular expression of positively stained xanthine oxidase (XO) in myocardium (gray color). E) Analytical result of positively stained XO (%), * vs. other groups with different symbols (†, ‡, §), p < 0.0001. F to I) Illustrating the microscopic finding (200x) of immunohistochemical stain for identification of cellular expression of positively stained XO in renal tissue (gray color). J) Analytical result of positively stained XO (%), * vs. other groups with different symbols (†, ‡, §), p < 0.0001. Scale bar in right lower corner represents 50 μm. K1) Protein expression of Bax in LV myocardium, * vs. other groups with different symbols (†, ‡, §), p < 0.0001. K2) Protein expression of cleaved caspase 3 (c-Casp3) in LV myocardium, * vs. other groups with different symbols (†, ‡, §), p < 0.0001. K3) Protein expression of PARP in LV myocardium, * vs. other groups with different symbols (†, ‡, §), p < 0.0001. K4) Protein expression of BNP, * vs. other groups with different symbols (†, ‡, §), p < 0.0001. L1) Protein expression of Bax in renal tissue, * vs. other groups with different symbols (†, ‡, §), p < 0.0001. L2) Protein expression of c-Casp3 in renal tissue, * vs. other groups with different symbols (†, ‡, §), p < 0.0001. L3) Protein expression of PARP in renal tissue, * vs. other groups with different symbols (†, ‡, §), p < 0.0001. n = 6 for each group
Fig. 11
Fig. 11
Protein expressions of cell stress, energy biogenesis, and oxidative stress signalings in kidney parenchyma by day 63 after CRS induction. (A) Protein expression of p-PI3K, * vs. other groups with different symbols (†, ‡, §), p < 0.0001. (B) Protein expression of p-mTOR, * vs. other groups with different symbols (†, ‡, §), p < 0.0001. (C) Protein expression of mitochondrial transcription factor A (TFAM), * vs. other groups with different symbols (†, ‡, §), p < 0.0001. (D) Protein expression of p-AMPK, * vs. other groups with different symbols (†, ‡, §), p < 0.0001. (E) Protein expression of SIRT-1, * vs. other groups with different symbols (†, ‡, §), p < 0.0001. (F) Protein expression of peroxisome proliferator-activated receptor gamma coactivator 1-alpha (PGC-1α), * vs. other groups with different symbols (†, ‡, §), p < 0.0001. (G) Protein expression of NOX-2, * vs. other groups with different symbols (†, ‡, §), p < 0.0001. (H) Protein expression of NOX-4, * vs. other groups with different symbols (†, ‡, §), p < 0.0001. (I) Protein expression of angiotensin II, * vs. other groups with different symbols (†, ‡, §), p < 0.0001. (J) Protein expression of angiotensin II type I receptor (AT1R), * vs. other groups with different symbols (†, ‡, §), p < 0.0001. n = 6 for each group
Fig. 12
Fig. 12
The protein expressions of EMT and inflammatory biomarkers in kidney parenchyma by day 60 after DCM induction. (A) Illustrating the Western blot bands. (B) Protein expressions p-Smad3, * vs. other groups with different symbols (†, ‡, §), p < 0.0001. (C) Protein expression of transforming growth factor (TGF)-β, * vs. other groups with different symbols (†, ‡, §), p < 0.0001. (D) Protein expression of vimentin, * vs. other groups with different symbols (†, ‡, §), p < 0.0001. (E) Protein expression of fibronectin, * vs. other groups with different symbols (†, ‡, §), p < 0.0001. (F) Protein expression of xanthine oxidase, * vs. other groups with different symbols (†, ‡, §), p < 0.0001. (G) Protein expression of phosphorylated nuclear factor (p-NF)-κB, * vs. other groups with different symbols (†, ‡, §), p < 0.0001. (H) Protein expression of interleukin (IL)-1β, * vs. other groups with different symbols (†, ‡, §), p < 0.0001. (I) Protein expression of IL-6, * vs. other groups with different symbols (†, ‡, §), p < 0.0001. (J) Protein expression of Carbohydrate response element (ChRE)-binding protein (ChREBP), * vs. other groups with different symbols (†, ‡, §), p < 0.0001. n = 6 for each group
Fig. 13
Fig. 13
Schematically illustrated the AMPK plays a causal sensor to resolve mitochondrial ROS and maintain cellular metabolic balance in cells via promoting a PGC-1α-dependent antioxidant response. For against oxidative stress, empagliflozin upregulate SIRT1 and AMPK pathway while suppress the mTOR-ROS pathway. ROS = reactive oxygen species; TFAM = mitochondrial transcription factor A; AMPK = 5’ adenosine monophosphate-activated protein kinase; PGC-1α = peroxisome proliferator-activated receptor gamma coactivator 1-alpha

References

    1. Cingolani HE, Ennis IL (2007) Sodium-hydrogen exchanger, cardiac overload, and myocardial hypertrophy. Circulation 115:1090–1100. 10.1161/CIRCULATIONAHA.106.626929 - PubMed
    1. Collins AJ, Li S, Gilbertson DT, Liu J, Chen SC, Herzog CA (2003) Chronic kidney disease and cardiovascular disease in the Medicare population. Kidney Int Suppl. 10.1046/j.1523-1755.64.s87.5.x. S24-31 - PubMed
    1. de Jager DJ, Grootendorst DC, Jager KJ, van Dijk PC, Tomas LM, Ansell D, Collart F, Finne P, Heaf JG, De Meester J, Wetzels JF, Rosendaal FR, Dekker FW (2009) Cardiovascular and noncardiovascular mortality among patients starting dialysis. JAMA 302:1782–1789. 10.1001/jama.2009.1488 - PubMed
    1. Garneata L, Stancu A, Dragomir D, Stefan G, Mircescu G (2016) Ketoanalogue-supplemented vegetarian very low-protein Diet and CKD progression. J Am Soc Nephrol 27:2164–2176. 10.1681/ASN.2015040369 - PMC - PubMed
    1. Glassock RJ, Warnock DG, Delanaye P (2017) The global burden of chronic kidney disease: estimates, variability and pitfalls. Nat Rev Nephrol 13:104–114. 10.1038/nrneph.2016.163 - PubMed

MeSH terms

LinkOut - more resources