. 2024 Sep 3;121(36):e2405543121.
doi: 10.1073/pnas.2405543121. Epub 2024 Aug 27.

RAD21 promotes oncogenesis and lethal progression of prostate cancer

Affiliations

RAD21 promotes oncogenesis and lethal progression of prostate cancer

Xiaofeng A Su et al. Proc Natl Acad Sci U S A. .

Abstract

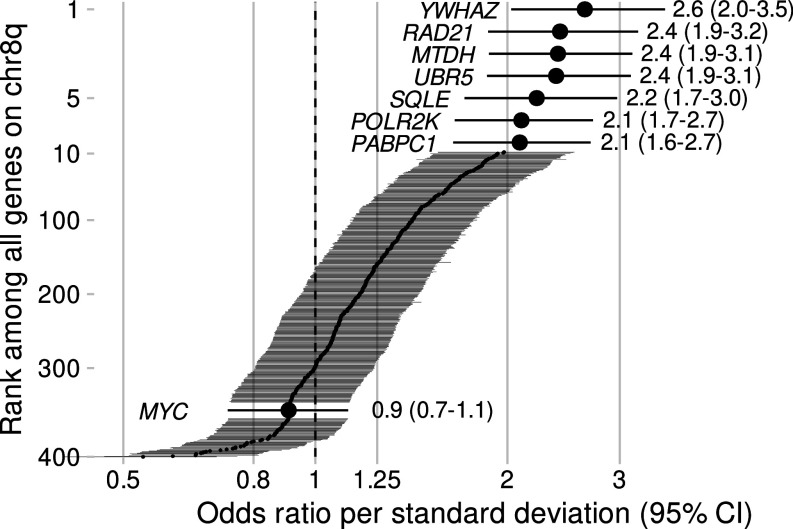
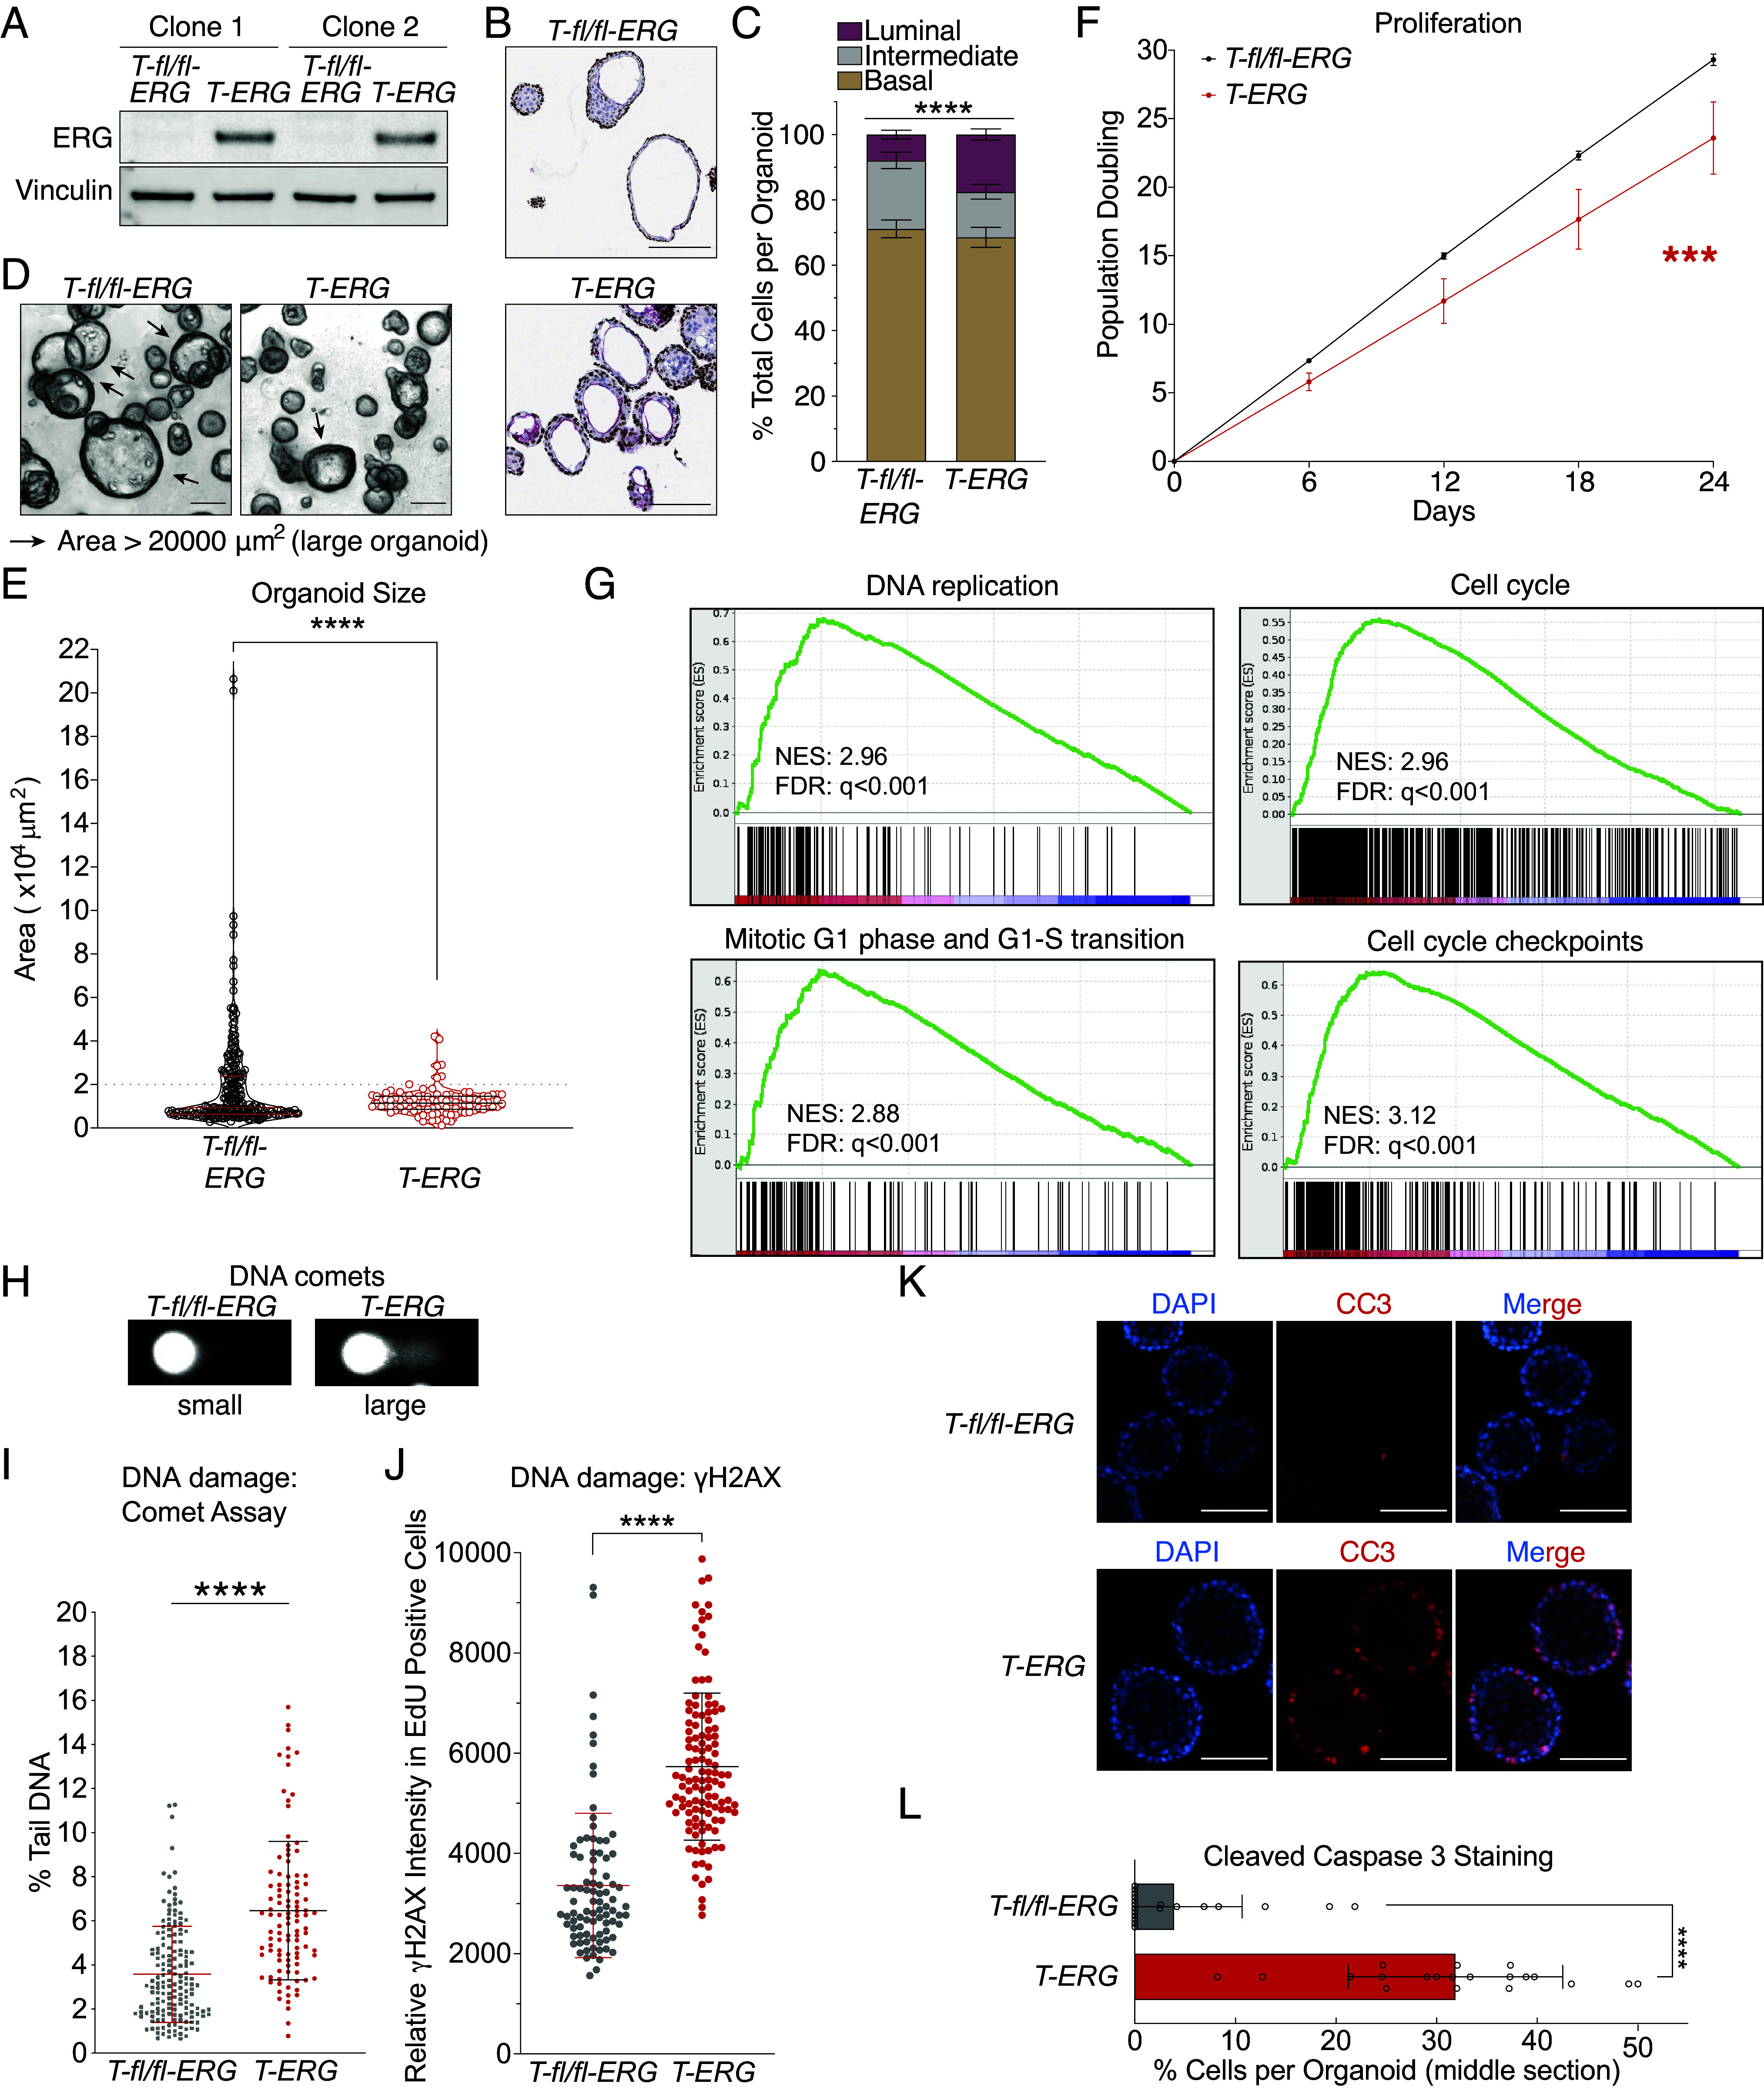
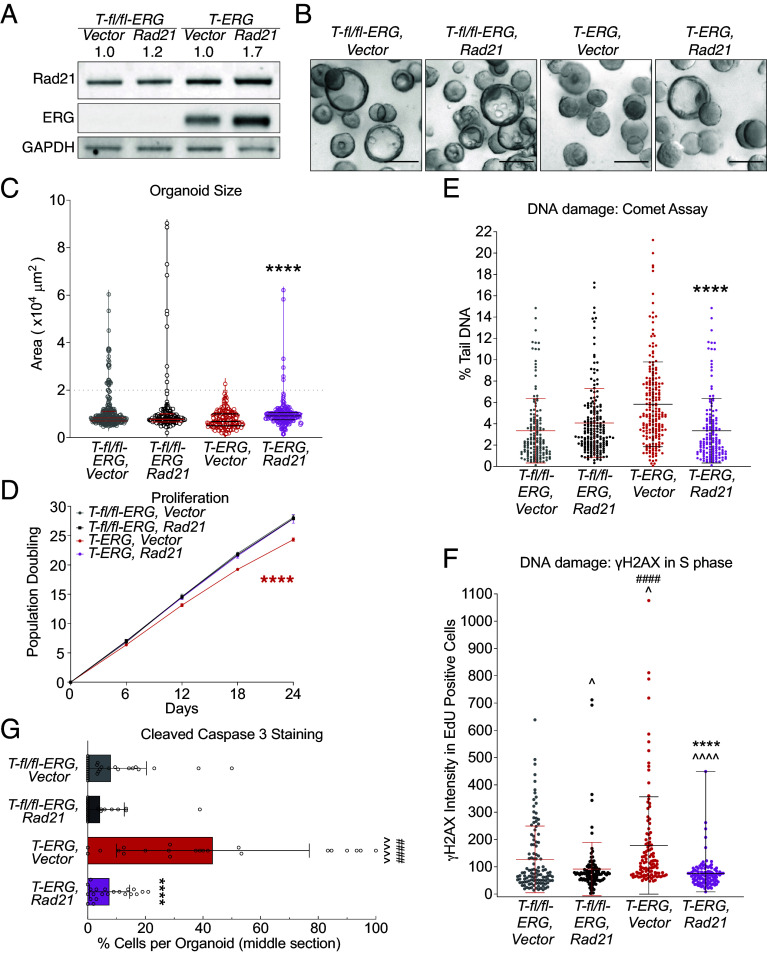
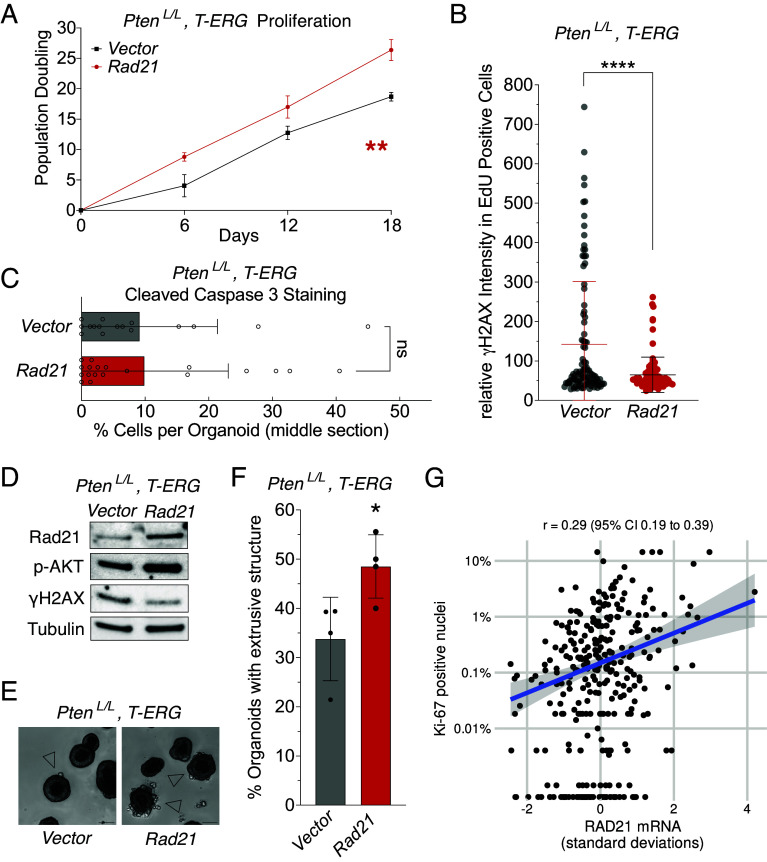
Higher levels of aneuploidy, characterized by imbalanced chromosome numbers, are associated with lethal progression in prostate cancer. However, how aneuploidy contributes to prostate cancer aggressiveness remains poorly understood. In this study, we assessed in patients which genes on chromosome 8q, one of the most frequently gained chromosome arms in prostate tumors, were most strongly associated with long-term risk of cancer progression to metastases and death from prostate cancer (lethal disease) in 403 patients and found the strongest candidate was cohesin subunit gene, RAD21, with an odds ratio of 3.7 (95% CI 1.8, 7.6) comparing the highest vs. lowest tertiles of mRNA expression and adjusting for overall aneuploidy burden and Gleason score, both strong prognostic factors in primary prostate cancer. Studying prostate cancer driven by the TMPRSS2-ERG oncogenic fusion, found in about half of all prostate tumors, we found that increased RAD21 alleviated toxic oncogenic stress and DNA damage caused by oncogene expression. Data from both organoids and patients indicate that increased RAD21 thereby enables aggressive tumors to sustain tumor proliferation, and more broadly suggests one path through which tumors benefit from aneuploidy.

Keywords: DNA damage; RAD21; clinical outcomes; organoid; prostate cancer.


Conflict of interest statement

Competing interests statement:M.G.V.H. discloses that he is a scientific advisor for Agios Pharmaceuticals, Auron Therapeutics, iTeos Therapeutics, Droia Ventures, Lime Therapeutics, Pretzel Therapeutics, and Sage Therapeutics. L.A.M. reports research funding from Janssen and Astra Zeneca; serves on the scientific advisory board and holds equity interest in Convergent Therapeutics; and was a consultant to Bayer Pharmaceuticals. W.A. discloses honoraria from Roche, Medscape, Aptitude Health, Clinical Education Alliance, OncLive/MJH Life Sciences, touchIME, Pfizer, theMedNet; serves as a consulting or advisory role in Clovis Oncology, Janssen, Overcoming Resistance In Cancer (ORIC) Pharmaceuticals, Daiichi Sankyo, AstraZeneca/MedImmune, Pfizer, Laekna Therapeutics, MOMA Therapeutics, Endeavor BioMedicines.

Figures

Fig. 1.
Fig. 1.
mRNA expression analysis identifies chr8q genes associated with lethal prostate cancer. Shown are all chr8q genes (n = 400, normalized to units of SD for comparability) and odds ratios for lethal disease (metastases/death from prostate cancer), compared to nonlethal disease (no metastases for >8 y after diagnosis) in a whole-transcriptome profiling study among men with prostate cancer from the Health Professionals Follow-up Study and Physicians’ Health Study (n = 403, 1982 to 2019). Genes are sorted by odds ratio, and genes with odds ratio >2 as well as MYC are highlighted. Bars and estimates in parentheses are 95% CI.
Fig. 2.
Fig. 2.
Induction of Tmprss2-ERG in prostate organoids causes oncogenic replication stress. (A) Expression of T-ERG by Western blot. Vinculin was used as a loading control. (B and C) T-ERG induction increases basal-to-luminal transition. Immunohistochemical analysis for basal marker, P63 (brown) and luminal marker, CK8 (red) (B) and quantification of basal-to-luminal transition (C). Error bars represent SEM of independent organoid clones, n = 11. (Scale bar: 150 µm.) ****P < 0.0001, two-way ANOVA. (DF) Expression of T-ERG impairs organoid proliferation. Example and definition of large and small organoid in this study (D). (Scale bar: 150 µm.) Proliferation was measured by organoid size after 6-d growth (E) and by population doublings (F). Each circle represents an organoid, and lines represent median (Middle) and quartiles (Top and Bottom). Gray dash line: cut-off between large and small organoids. Each dot represents the mean of 2 independent replicates with SEM (error bars) ***P < 0.001, linear regression (G) Cell cycle and replication genes were enriched in the T-ERG organoids. GSEA was performed on RNA sequencing data of T-ERG organoids over T-fl/fl-ERG organoids; Top 20 pathways were listed in SI Appendix, Fig. S5A. NES: normalized enrichment score; FDR: false discovery rate. (H and I) T-ERG expression elevates single-cell total DNA damage level in prostate organoids. Total DNA damage levels were measured by alkaline comet assays: examples of small and large DNA comets in (H) and quantification in (I, each dot represents a single comet). Middle line: mean, error bar: SD. ****P < 0.0001, t test. (J) T-ERG expression increases DNA damage in S-phase cells. DNA damage was measured by γH2AX intensity in EdU-positive cells: examples of stained cells in (SI Appendix, Fig. S6B). Each dot represents an EdU positive cell. The middle line represents the average with SD (error bar). ****P < 0.0001, t test. (Scale bar: 10 µm.) (K and L) T-ERG expression induces cellular apoptosis. DNA (DAPI) is in blue and the apoptotic maker, cleaved caspase 3 (CC3) is in red (K). Quantification of CC3 is in (L). Each bar represents average with SD. ****P < 0.0001, t test.
Fig. 3.
Fig. 3.
Increased Rad21 mitigates oncogenic stress and promotes growth in the Tmprss2-ERG-expressing prostate organoids. (A) Mild overexpression of Rad21, measured by Western blot. GAPDH is used as a loading control. Number on top indicates the extent of overexpression relative to vector expressing organoids. (B) Example of the organoids carrying indicated constructs 6 d post passage. (Scale bar: 150 µm.) (C and D) Rad21 overexpression promotes proliferation of T-ERG organoids. Proliferation was measured by organoid size after 6-day growth after passage (C) and by population doublings. Each circle is a single organoid, and lines represent median (Middle) and quartiles (Top and Bottom) in (C). ****P < 0.0001, t-test, compared between T-ERG, Vector and T-ERG, Rad21 in (C), and ****P < 0.0001, linear regression in (D). (E and F) Increased Rad21 reduces whole cell DNA damage by alkaline comet assays (E, each dot represents a single comet) and DNA damage in S-phase cells by γH2AX intensity in EdU positive cells (F, each dot represents a single EdU positive cell. Middle line: mean, error bar: SD). ****P < 0.0001 t-test, compared between T-ERG, Vector and T-ERG, Rad21. (G) Rad21 overexpression decreases apoptosis in T-ERG-expressing organoids. Error bar: SD. ****P < 0.0001, compared to T-ERG cells expressing vector; ####P < 0.0001, compared to T-fl/fl-ERG cells overexpressing Rad21; ^^^^P < 0.0001, ^P < 0.05, compared to T-fl/fl-ERG cells expressing the Vector; no symbol is shown if no significance is detected. Each data bar or population in (CG) represents combined data from 2 independent clones with either Vector or Rad21.
Fig. 4.
Fig. 4.
Rad21 overexpression promotes prostate cancer development. (A) Rad21 overexpression promotes proliferation of the PtenL/L, T-ERG organoids. Proliferation was measured by population doublings. Each dot represents the mean of 2 independent replicates with SEM (error bars). **P < 0.01, linear regression. (B and C) Increased Rad21 reduces whole cell DNA damage by γH2AX intensity in EdU positive cells (B, each dot represents a single EdU positive cell. Middle line: mean, error bar: SD; ****P < 0.0001, t test.), but does not affect apoptosis (C, each circle: each organoid. Error bar: SD. ns: not significant, t test) in the PtenL/L, T-ERG organoids. Each data bar or population in (B and C) represents combined data from 2 independent clones with either Vector or Rad21. (DF) PtenL/L, T-ERG organoids exhibit more advanced phenotypes when overexpressed Rad21. Overexpression of Rad21 upregulated phosphorylated AKT protein levels, measured by Western blot; tubulin is used as a loading control (D). Example of “finger-shape extrusion” structure indicating invasiveness of the organoids in (E) and the quantification of the extrusion structure in (F, each dot represents an independent culture composed of over 100 organoids. Error bar: SD; *P < 0.05, t test). (G) RAD21 mRNA expression and the proliferative index Ki-67 in primary tumors from participants of the two population-based studies (n = 313). Pearson correlations r and 95% CI are given. Note the log-scaled y axis. Dots at the bottom of the plot are tumors with 0% Ki-67-positive nuclei.

References

    1. Beroukhim R., et al. , The landscape of somatic copy-number alteration across human cancers. Nature 463, 899–905 (2010). - PMC - PubMed
    1. Weaver B. A., Cleveland D. W., Does aneuploidy cause cancer? Curr. Opin. Cell Biol. 18, 658–667 (2006). - PubMed
    1. Taylor A. M., et al. , Genomic and functional approaches to understanding cancer aneuploidy. Cancer Cell 33, 676–689.e3 (2018). - PMC - PubMed
    1. Stopsack K. H., et al. , Aneuploidy drives lethal progression in prostate cancer. Proc. Natl. Acad. Sci. U.S.A. 116, 11390–11395 (2019). - PMC - PubMed
    1. El Gammal A. T., et al. , Chromosome 8p deletions and 8q gains are associated with tumor progression and poor prognosis in prostate cancer. Clin. Cancer Res. 16, 56–64 (2010). - PubMed

MeSH terms