. 2024 Sep 3;121(36):e2318704121.
doi: 10.1073/pnas.2318704121. Epub 2024 Aug 27.

Climate, demography, immunology, and virology combine to drive two decades of dengue virus dynamics in Cambodia

Affiliations

Climate, demography, immunology, and virology combine to drive two decades of dengue virus dynamics in Cambodia

Cara E Brook et al. Proc Natl Acad Sci U S A. .

Erratum in

Abstract

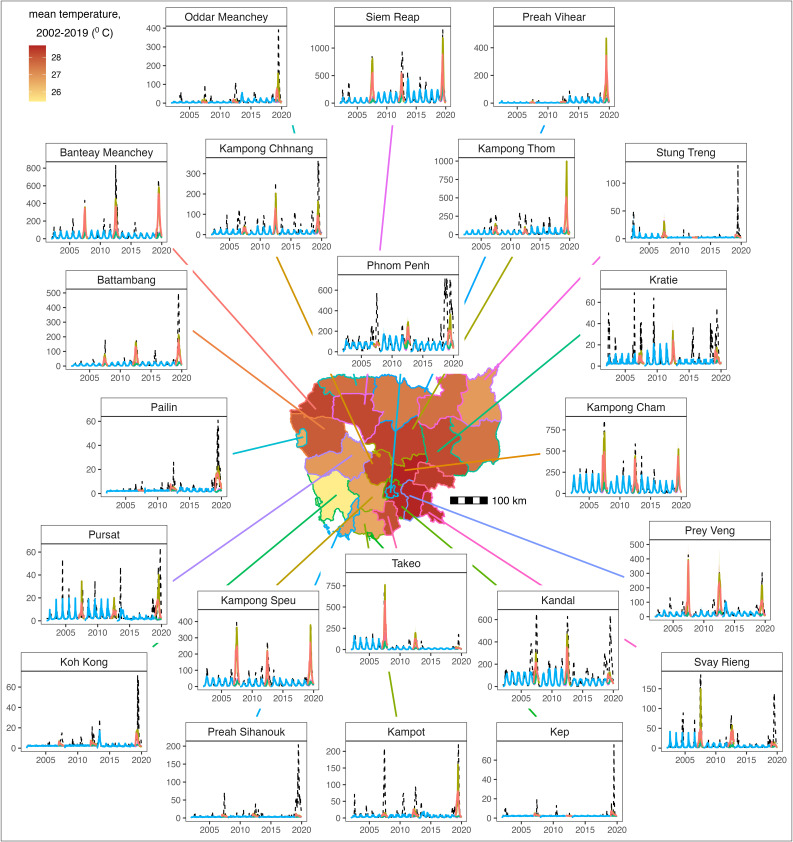
The incidence of dengue virus disease has increased globally across the past half-century, with highest number of cases ever reported in 2019 and again in 2023. We analyzed climatological, epidemiological, and phylogenomic data to investigate drivers of two decades of dengue in Cambodia, an understudied endemic setting. Using epidemiological models fit to a 19-y dataset, we first demonstrate that climate-driven transmission alone is insufficient to explain three epidemics across the time series. We then use wavelet decomposition to highlight enhanced annual and multiannual synchronicity in dengue cycles between provinces in epidemic years, suggesting a role for climate in homogenizing dynamics across space and time. Assuming reported cases correspond to symptomatic secondary infections, we next use an age-structured catalytic model to estimate a declining force of infection for dengue through time, which elevates the mean age of reported cases in Cambodia. Reported cases in >70-y-old individuals in the 2019 epidemic are best explained when also allowing for waning multitypic immunity and repeat symptomatic infections in older patients. We support this work with phylogenetic analysis of 192 dengue virus (DENV) genomes that we sequenced between 2019 and 2022, which document emergence of DENV-2 Cosmopolitan Genotype-II into Cambodia. This lineage demonstrates phylogenetic homogeneity across wide geographic areas, consistent with invasion behavior and in contrast to high phylogenetic diversity exhibited by endemic DENV-1. Finally, we simulate an age-structured, mechanistic model of dengue dynamics to demonstrate how expansion of an antigenically distinct lineage that evades preexisting multitypic immunity effectively reproduces the older-age infections witnessed in our data.

Keywords: arbovirus; dengue; force of infection; genomic epidemiology; wavelet decomposition.


Conflict of interest statement

Competing interests statement:The authors declare no competing interest.

Figures

Fig. 1.
Fig. 1.
Climate-informed TSIR insights into epidemic dynamics of DENV in Cambodia. Inset panels show province-level clinicosyndromic reported DENV cases (dashed black lines) with fitted TSIR output to the three inter-epidemic periods (2002–2006, 2008–2011, 2013–2018; blue lines) and TSIR projections for epidemic years (2007, 2012, and 2019) under trained biweekly transmission rate (β) estimates (pink lines), incorporating a factorial increase in the susceptible population (gold lines), using a climate-projected β estimated from lagged temperature and precipitation data by province (green lines), or using both climate-projected β and a factorial increase in the susceptible population (red lines) (SI Appendix, Tables S2 and S5). The center map shows province-level administrative boundaries for Cambodia, shaded by the mean biweekly temperature from 2002-2019.
Fig. 2.
Fig. 2.
Wavelet reconstructions show heightened synchrony in epidemic years. Reconstructed (A) annual and (B) multiannual dengue cycles by province, by year from NDCP incidence per 100,000 population. (C) Mean pairwise Pearson’s correlation coefficient (ρ) for annual dengue incidence between focal province and all other provinces through time. (D) Mean ρ comparing province-to-province reconstructed multiannual dengue cycles across a 5-y sliding window, with overlapping window frames plotted (partially translucent) atop one another. In all panels, epidemic years are highlighted by vertical red or black bars. Top panels indicate the distribution of corresponding values (median = solid line; max-to-min range = gray shading) observed across all provinces within each timestep. X-axis labels are marked on January 1 of the corresponding year.
Fig. 3.
Fig. 3.
Demographic transition underpins declining force of infection and increasing age of reported dengue incidence in Cambodia. (A) Mean age of reported dengue infection, by province in the last year of the NDCP time series (2020). (B) Age distribution of reported dengue cases by year, with violin plots highlighting changes in the interquartile range of cases. The interannual trend in the mean age of dengue infection is plotted as a solid red line, with 95% CI by SE shown as a narrow, translucent band behind it (SI Appendix, Table S7). Epidemic years (2007, 2012, and 2019) are highlighted by a light blue, dashed line in the background. (C) National (black) and province-level (colored) estimates for the annual, per serotype, per capita force of infection from 1981 to 2020. 95% CI from the hessian matrix are shown as translucent shading. FOI estimates are compared against national birth and death rates for Cambodia across the time series, with epidemic years highlighted by vertical dashed lines. (D) Age modifiers to the FOI fit as shared across all provinces for 2002–2010 and 2011–2020 subsets of the data, with 95% CI from the hessian matrix are shown as translucent shading. (E) Cumulative increase in the proportion of cases reported by age at the national level, colored by year. Data are shown as dotted lines and model output as solid lines. Model includes national FOI estimates from C, age modification terms from D, and time-varying waning multitypic immunity as shown in the inset.
Fig. 4.
Fig. 4.
Bayesian time trees highlight geospatial structuring in evolutionary relationships for Cambodian dengue. (A) Map of Cambodia with locations of DENV serum samples genotyped from 2019 to 2022 in part with this study. Cases are grouped together within 10 km radii. The centroid of each case cluster is plotted, with circle size corresponding to sample number and shading corresponding to serotype and genotype [DENV-1 = green; DENV-2 Genotype-V = light blue; DENV-2 Cosmopolitan (Genotype-II) = navy; DENV-4 = orange]. The age distribution of cases by serotype and genotype is shown in the upper left; DENV-2 Cosmopolitan and DENV-4 infections occurred in significantly older age individuals than reference DENV-1 infections (linear regression; P < 0.001; SI Appendix, Table S10). (B) Number of genotyped DENV cases by year from febrile surveillance in this study, colored by serotype and genotype as showing in panel A. (C) Map of Southeast Asia with countries colored corresponding to sequences, as shown in tip points on phylogenetic timetrees constructed using BEAST 2 for DENV-1 and (D) DENV-2. The X-axis highlights divergence times between corresponding sequences. Reference sequences from GenBank are represented as circle tips and sequences contributed by active febrile surveillance in this study as triangles. Cambodia and corresponding sequences are shaded purple. Clade bars indicate the genotype of corresponding sequences within each serotype: genotype-1 for DENV-1 and Genotype-V and Cosmopolitan III (Genotype-II) for DENV-2. See SI Appendix, Fig. S19 for a detailed inset of geographic localities for 2019–2022 Cambodia sequences. (E) Proportion of geolocated sequence pairs from panel A for DENV-1 (green) and DENV-2 (blue) genomes derived from the same transmission chain across progressively longer Euclidean distances. (F) Number of effective transmission chains for circulating DENV estimated across populations of varying densities. Black (urban) and gray (rural) circles with corresponding 95% CI depict estimates for Thailand from Salje et al. (8), while triangles depict estimates from our Kampong Speu active febrile surveillance study for DENV-1 (green) and DENV-2 (blue).
Fig. 5.
Fig. 5.
Simulations of genotype clade replacement recapitulate observed expansion in the age structure of reported dengue cases from Cambodian data. (A) Total reported cases (solid line = mean FOI; translucent shading = 95% CI for FOI), (B) age distribution of reported cases by year (black = secondary; blue = repeat secondary or tertiary), and (C) cumulative proportion of reported cases by age, from deterministic model simulations indicated to the left of panel A.

References

    1. World Health Organization, “Dengue and severe dengue” in WHO Fact Sheets (WHO, 2022). https://www.who.int/news-room/fact-sheets/detail/dengue-and-severe-dengue. Accessed 1 July 2024.
    1. Bhatt S., et al. , The global distribution and burden of dengue. Nature 496, 504–507 (2013). - PMC - PubMed
    1. Sabin A. B., Research on dengue during World War II. Am. J. Trop. Med. Hyg. 1, 30–50 (1952). - PubMed
    1. Katzelnick L. C., et al. , Antibody-dependent enhancement of severe dengue disease in humans. Science (New York, N.Y.) 932, 929–932 (2017). - PMC - PubMed
    1. Katzelnick L. C., et al. , Zika virus infection enhances future risk of severe dengue disease. Science 369, 1123–1128 (2020). - PMC - PubMed