. 2024 Sep 3;121(36):e2405210121.
doi: 10.1073/pnas.2405210121. Epub 2024 Aug 27.

HIV-1 control in vivo is related to the number but not the fraction of infected cells with viral unspliced RNA

Affiliations

HIV-1 control in vivo is related to the number but not the fraction of infected cells with viral unspliced RNA

Adam A Capoferri et al. Proc Natl Acad Sci U S A. .

Abstract

In the absence of antiretroviral therapy (ART), a subset of individuals, termed HIV controllers, have levels of plasma viremia that are orders of magnitude lower than non-controllers (NC) who are at higher risk for HIV disease progression. In addition to having fewer infected cells resulting in fewer cells with HIV RNA, it is possible that lower levels of plasma viremia in controllers are due to a lower fraction of the infected cells having HIV-1 unspliced RNA (HIV usRNA) compared with NC. To directly test this possibility, we used sensitive and quantitative single-cell sequencing methods to compare the fraction of infected cells that contain one or more copies of HIV usRNA in peripheral blood mononuclear cells (PBMC) obtained from controllers and NC. The fraction of infected cells containing HIV usRNA did not differ between the two groups. Rather, the levels of viremia were strongly associated with the total number of infected cells that had HIV usRNA, as reported by others, with controllers having 34-fold fewer infected cells per million PBMC. These results reveal that viremic control is not associated with a lower fraction of proviruses expressing HIV usRNA, unlike what is reported for elite controllers, but is only related to having fewer infected cells overall, maybe reflecting greater immune clearance of infected cells. Our findings show that proviral silencing is not a key mechanism for viremic control and will help to refine strategies toward achieving HIV remission without ART.

Keywords: CARD-SGS; HIV RNA; HIV controllers; HIV latency; HIV proviral expression.


Conflict of interest statement

Competing interests statement:J.W.M. is a consultant to Gilead Sciences, has received research grants from Gilead Sciences to the University of Pittsburgh, and owns share options in Infectious Disease Connect (co-founder) and Galapagos, NV, unrelated to the current work on HIV. J.M.C. is a member of the Scientific Advisory Board and a Shareholder of ROME Therapeutics, Inc. and Generate Biomedicine, Inc., both unrelated to the current work on HIV.

Figures

Fig. 1.
Fig. 1.
Participant baseline virologic characteristics. (A) Level of plasma viremia in HIV-1 RNA copies per mL, with P-value (Mann–Whitney test) shown above. The median and interquartile range are also shown. (B) Number of provirus+ cells (a surrogate for the number of infected cells) by HIV-1 DNA per million PBMC. The Mann-Whitney test with the median and interquartile range is shown. (C) Minimum duration of HIV infection (y) and number of provirus+ cells by HIV-1 DNA per million PBMC. (D) Number of provirus+ cells by HIV-1 DNA per million PBMC and level of plasma viremia by HIV-1 RNA copies/mL. Each symbol represents an individual donor within the respective group.
Fig. 2.
Fig. 2.
Number of PBMC with HIV usRNA and association with levels of plasma viremia. (A) Number of cells with HIV usRNA per million PBMC. The Mann-Whitney test with the median and interquartile range is shown. (B) The log10-transformed number of cells with HIV usRNA per million PBMC and log10-transformed plasma viremia as HIV-1 RNA copies per mL in VC and NC. (C) Provirus+ cells by HIV-1 DNA per million PBMC and log10-transformed number of provirus+ cells with HIV usRNA per million PBMC in VC and NC. (D) Number of cells per million PBMC that are high-expressing (>10 HIV usRNA). The Mann-Whitney test with the median and interquartile range is shown. (E) Number of high-expressing cells per million PBMC and log10-transformed plasma viremia in HIV-1 RNA copies per mL of plasma. Open shapes indicate no detectable high-expressing cells in a particular donor; thus, a lower limit of detection estimate (determined as 1/number of PBMC assayed) is shown. A Mann–Whitney test was performed for both uncensored and censored data (excluding no undetectable high-expressing cell donors). Each symbol represents an individual donor within the respective group.
Fig. 3.
Fig. 3.
The fraction of infected cells with HIV usRNA is not associated with levels of plasma viremia. (A) Percent of infected cells (provirus+ cells) with HIV usRNA in VC and NC. The Mann-Whitney test with the median and interquartile range is shown. (B) Percent infected cells with usRNA and the log10-transformed HIV plasma viremia as HIV-1 RNA copies per mL in VC and NC. Each symbol represents an individual donor within the respective group.
Fig. 4.
Fig. 4.
Levels of HIV usRNA in single cells. (A) Distribution plots of the frequency of HIV usRNA copies per cell in VC and NC. (B) Average number of HIV-1 usRNA copies per cell detected for each participant. The Mann–Whitney test with the median and interquartile range is shown. (C) Comparison of HIV usRNA in single cells between VC and NC. The number of infected cells assayed with the indicated number expressing HIV usRNA is reported. The number of high-expressing cells (>10 copies HIV usRNA/cell) in each group is reported by the median with the interquartile range and mean with range for the HIV usRNA copies per cell. Each symbol represents an individual donor within the respective group.
Fig. 5.
Fig. 5.
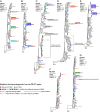
Neighbor-joining p-distance tree of the p6-PR-RT region of HIV-1 obtained from CARD-SGS assay on the VC. (A–H) The PID is denoted with the MDI in years. The black triangles show the proviruses from PBMC, red circles are the plasma virus, and the squares are the intracellular HIV usRNA from PBMC with each color square representing a different aliquot. Black arrows indicate high-expressing PBMC, and red arrows indicate identical HIV usRNA sequences found in 2 or more aliquots of PBMC. Diversity was measured where appropriate (SI Appendix, Supplemental Methods) by the APD with predicted hypermutants removed and identical sequences collapsed.
Fig. 6.
Fig. 6.
Neighbor-joining p-distance tree of the p6-PR-RT region of HIV-1 obtained from the CARD-SGS assay on the NC. (A–G) The PID is denoted with the MDI in years. The black triangles show the proviruses from PBMC, red circles are the plasma virus, and the squares are the intracellular HIV usRNA from PBMC with each color square representing a different aliquot. Black arrows indicate high-expressing PBMC, and red arrows indicate identical HIV usRNA sequences found in 2 or more aliquots of PBMC. Diversity was measured where appropriate (SI Appendix, Supplemental Methods) by the APD with predicted hypermutants removed and identical sequences collapsed.
Fig. 7.
Fig. 7.
HIV-1 control is related to the number but not the fraction of infected cells with transcriptionally active proviruses. There are approximately 27-fold fewer infected cells in the VC. The ratio of transcriptionally active to silent proviruses is the same in the two groups with similar levels of HIV usRNA molecules per infected cell. This model is based on measured data at the time of sampling from Table 2.

Update of

References

    1. Mellors J. W., et al. , Prognosis in HIV-1 infection predicted by the quantity of virus in plasma. Science 272, 1167–1170 (1996). - PubMed
    1. O’Brien W. A., et al. , Changes in plasma HIV-1 RNA and CD4+ lymphocyte counts and the risk of progression to AIDS. Veterans Affairs Cooperative Study Group on AIDS. N. Engl. J. Med. 334, 426–431 (1996). - PubMed
    1. Groves K. C., et al. , Disease progression in HIV-1-infected viremic controllers. J. Acquired Immune Defic. Syndr. 61, 407–416 (2012). - PMC - PubMed
    1. Baxter A. E., et al. , Single-cell characterization of viral translation-competent reservoirs in HIV-infected individuals. Cell Host Microbe 20, 368–380 (2016). - PMC - PubMed
    1. Sannier G., et al. , Combined single-cell transcriptional, translational, and genomic profiling reveals HIV-1 reservoir diversity. Cell Rep. 36, 109643 (2021). - PubMed

LinkOut - more resources