. 2024 Aug 27:13:RP96789.
doi: 10.7554/eLife.96789.

Hosts manipulate lifestyle switch and pathogenicity heterogeneity of opportunistic pathogens in the single-cell resolution

Affiliations

Hosts manipulate lifestyle switch and pathogenicity heterogeneity of opportunistic pathogens in the single-cell resolution

Ziguang Wang et al. Elife. .

Abstract

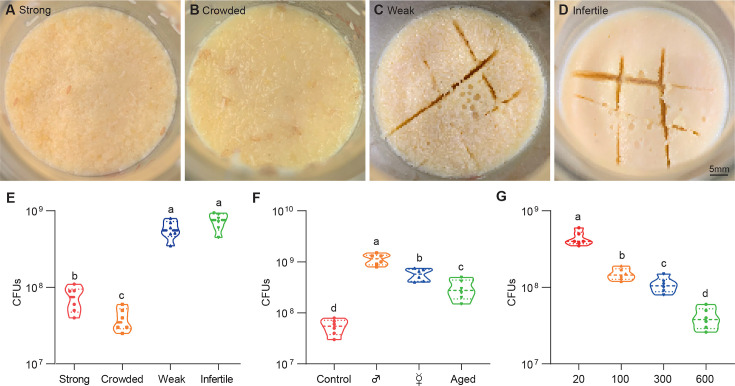
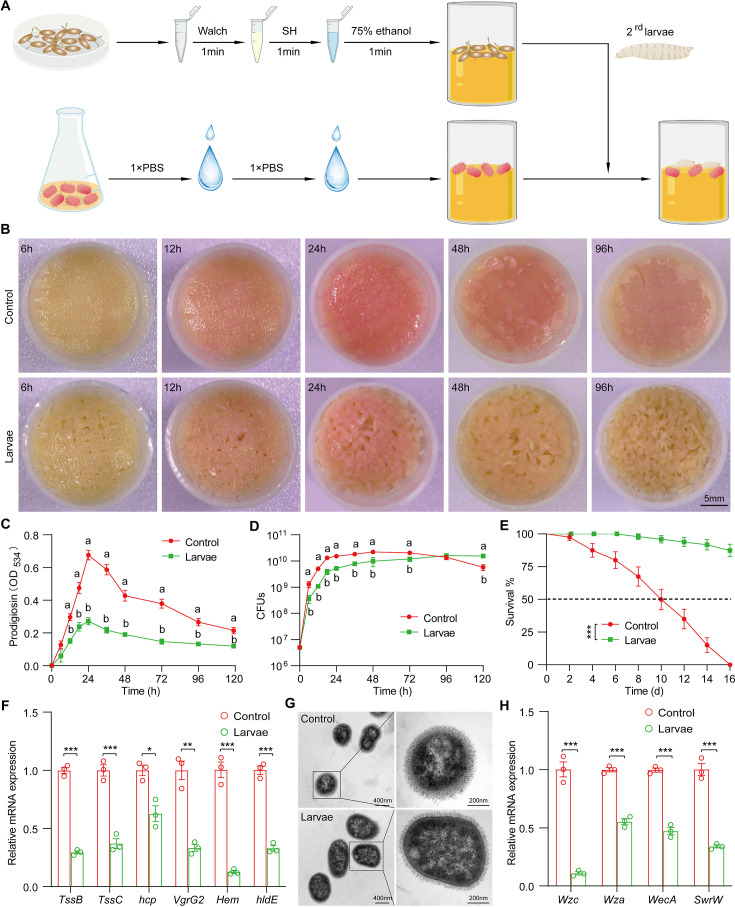
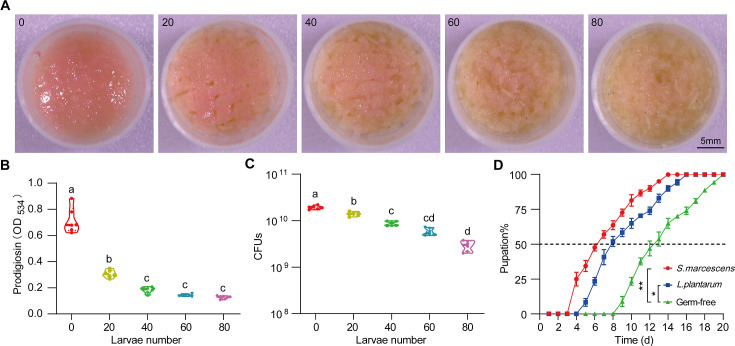
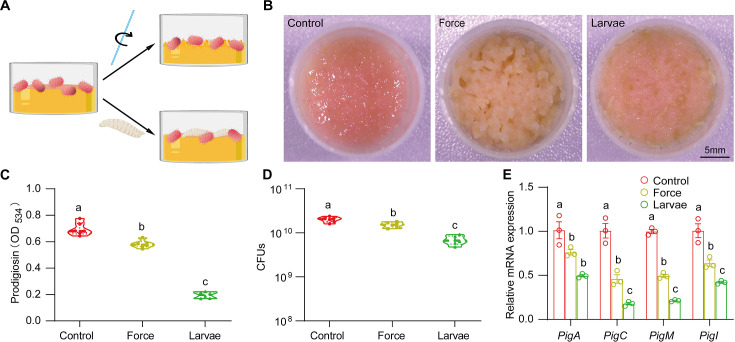
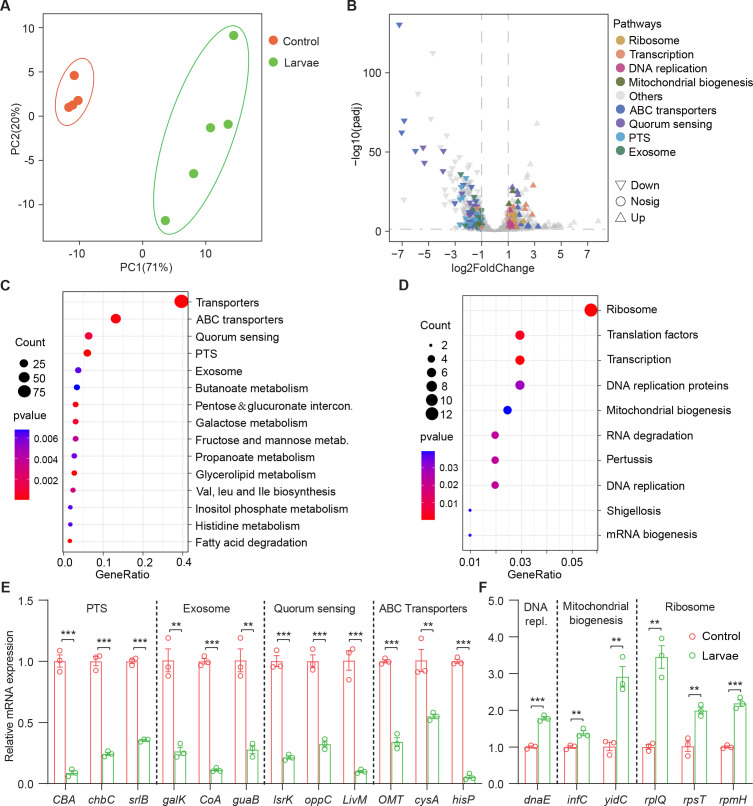
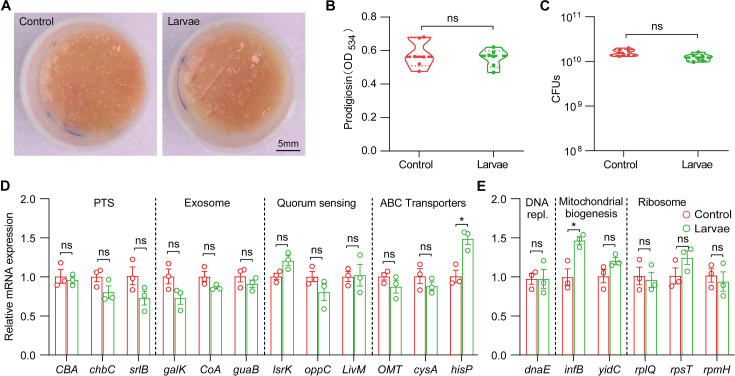
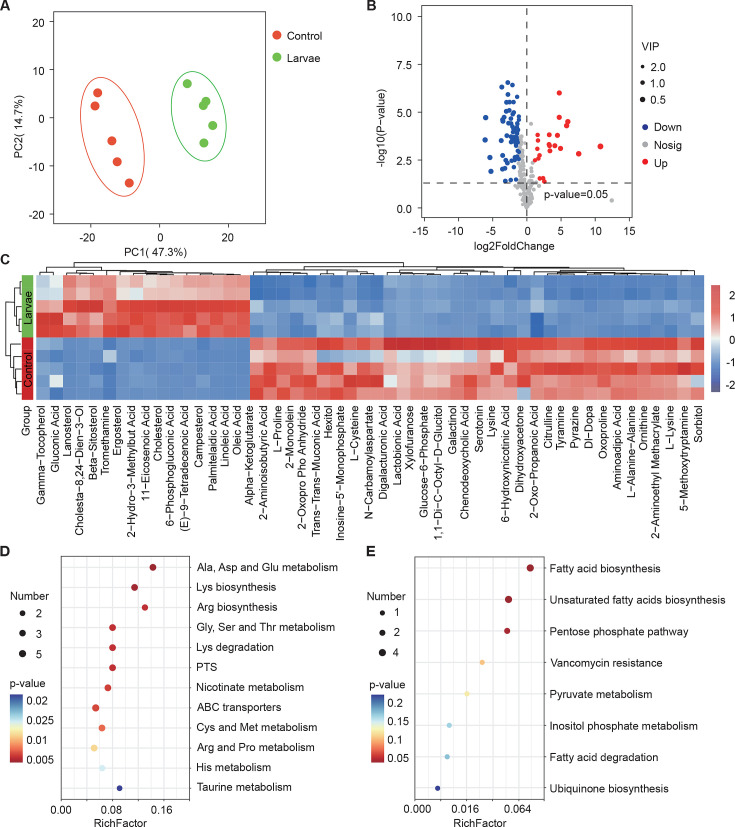
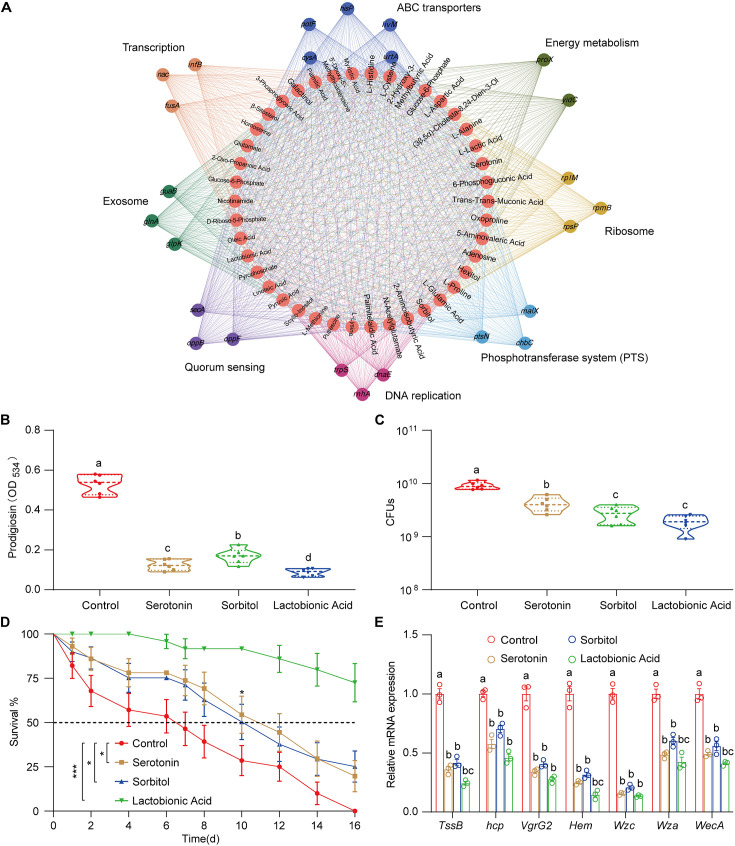
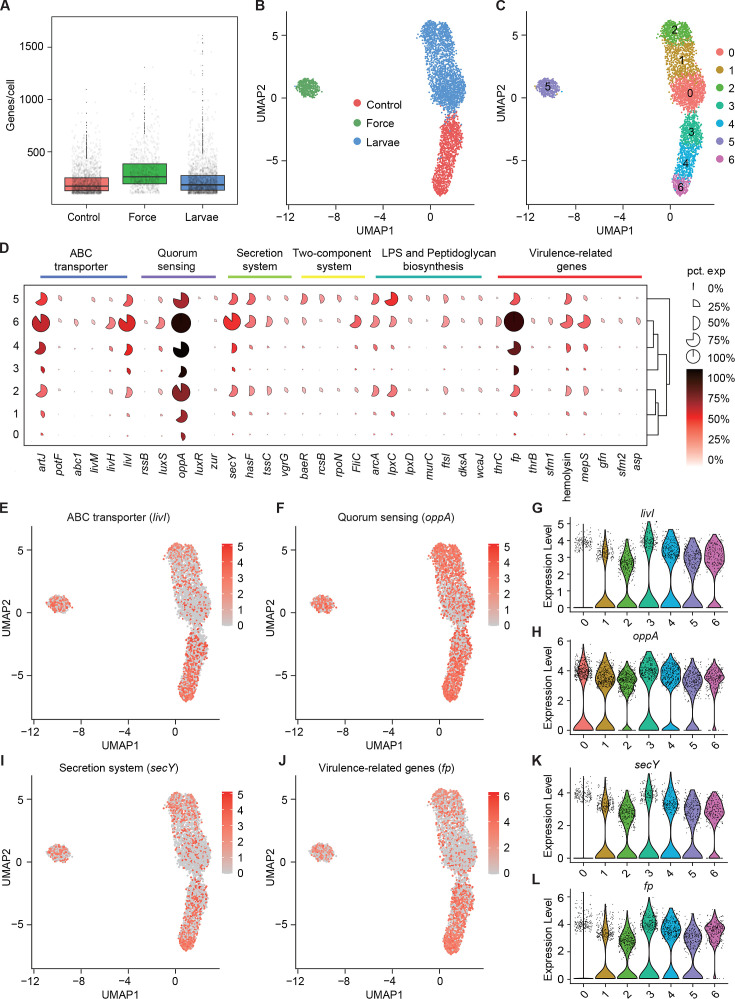
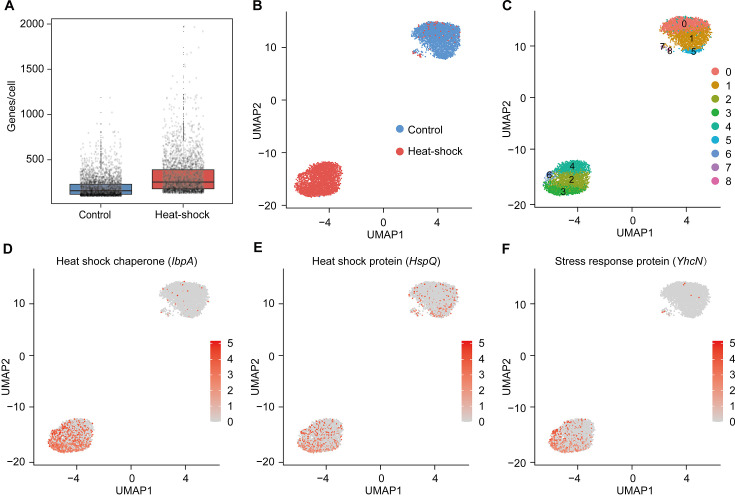
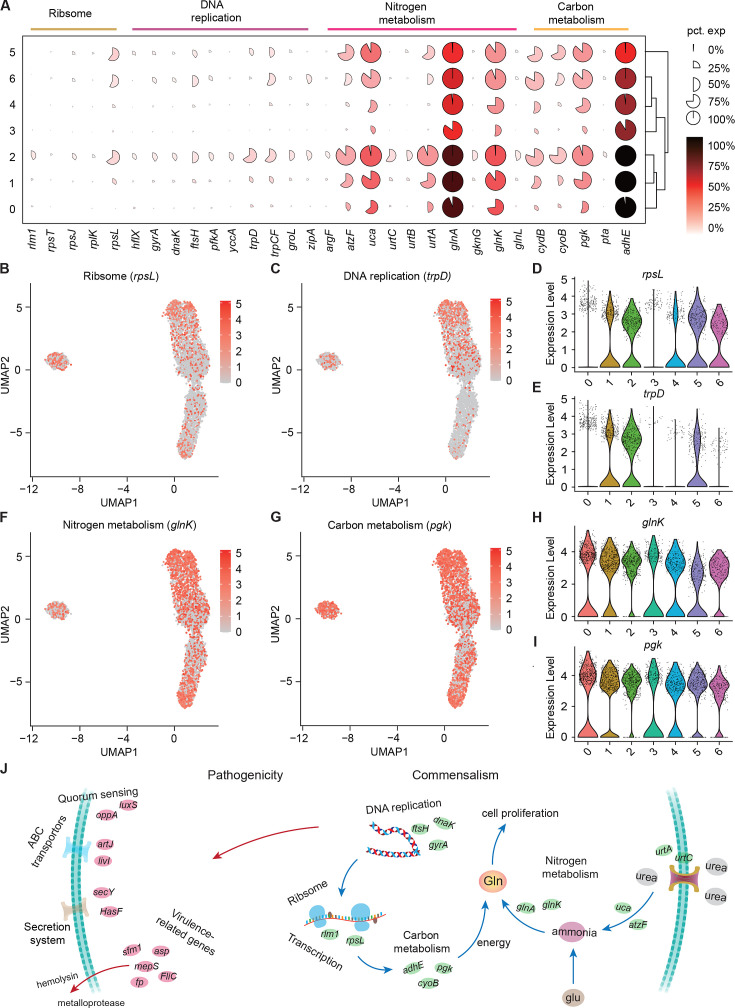
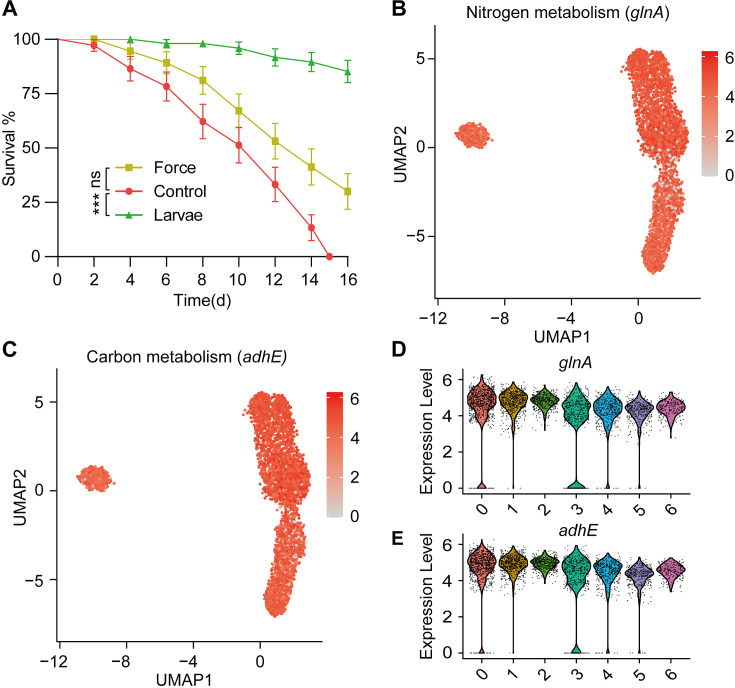
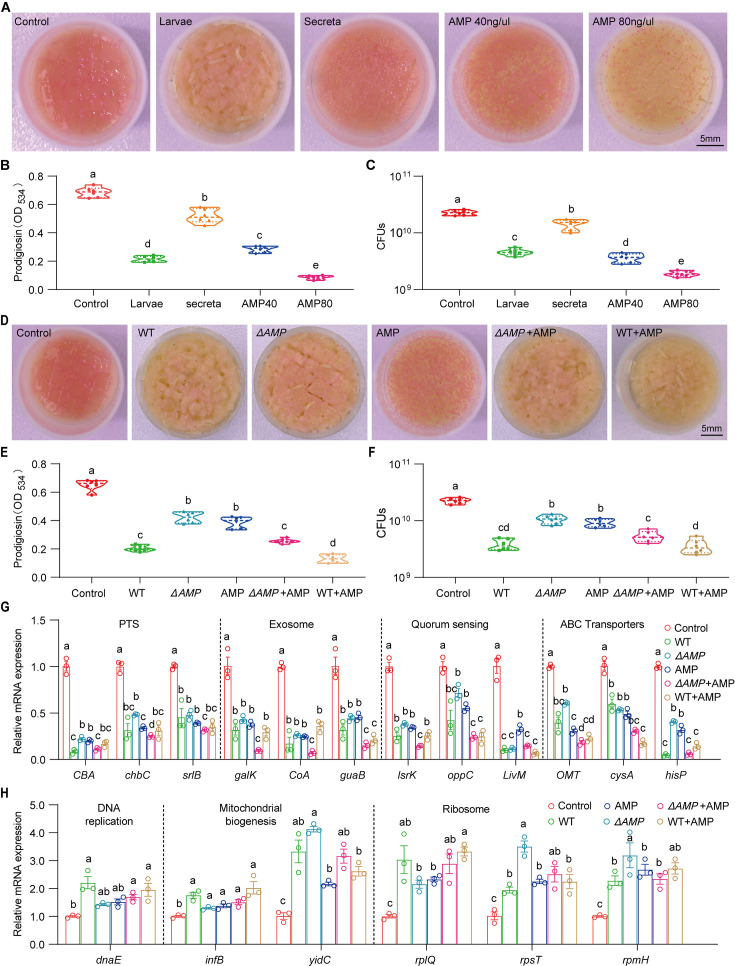
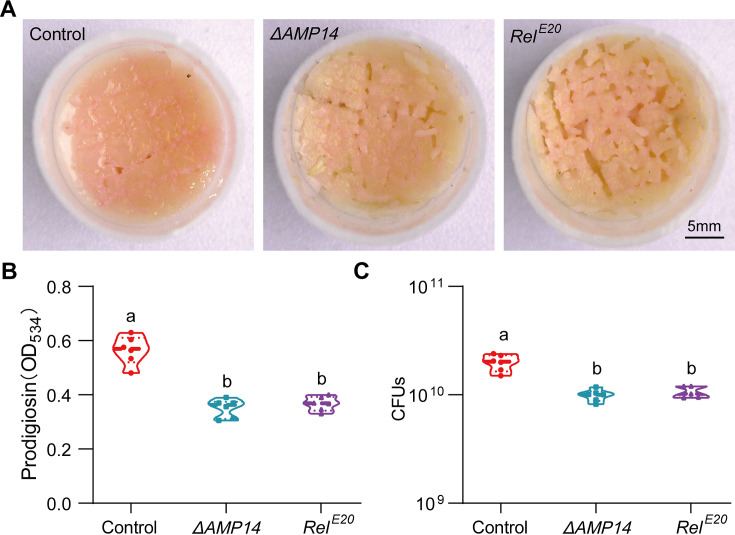
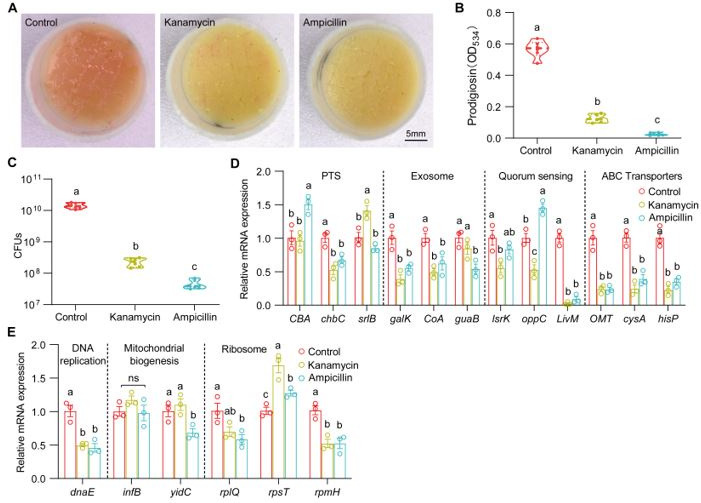
Host-microbe interactions are virtually bidirectional, but how the host affects their microbiome is poorly understood. Here, we report that the host is a critical modulator to regulate the lifestyle switch and pathogenicity heterogeneity of the opportunistic pathogens Serratia marcescens utilizing the Drosophila and bacterium model system. First, we find that Drosophila larvae efficiently outcompete S. marcescens and typically drive a bacterial switch from pathogenicity to commensalism toward the fly. Furthermore, Drosophila larvae reshape the transcriptomic and metabolic profiles of S. marcescens characterized by a lifestyle switch. More importantly, the host alters pathogenicity and heterogeneity of S. marcescens in the single-cell resolution. Finally, we find that larvae-derived AMPs are required to recapitulate the response of S. marcescens to larvae. Altogether, our findings provide an insight into the pivotal roles of the host in harnessing the life history and heterogeneity of symbiotic bacterial cells, advancing knowledge of the reciprocal relationships between the host and pathogen.

Keywords: D. melanogaster; Serratia marcescens; bacterial single-cell RNA-seq; host-microbe interactions; infectious disease; lifestyle switch; microbiology; pathogenicity heterogeneity.


Conflict of interest statement

ZW, SL, SZ, TZ, YW, AL, KW, XJ, HC, YZ, ET, YW, YW, WL No competing interests declared

Figures

Figure 1.
Figure 1.. Drosophila larvae shape topographies and carrying capacities of bacterial community.
(A–D) Representative images of sticky ‘biofilm-like’ formation on the surface of the sugar-corn-yeast medium whereby Drosophila flies with differential robustness were raised. The topographies of surface slick are differentially deconstructed and segmented by flies with different robust flies. (E) Bacterial loads of the diet associated with strong, crowed, weak, and infertile flies, respectively. Strong flies (wild-type fly CS), weak flies (yw; Sp/CyO; MKRS/TM6B), infertile flies (dfmr150M null mutant). n=6 for each. (F) Bacterial loads of the diet associated with control, male, virgin, and aged flies, respectively. Each bottle contained 100 flies with a 1:1 ratio of male:female in control and aged groups, and 50-day-aged flies were used. n=6 for each. (G) Bacterial loads of the diet associated with Drosophila larvae in a dosage-dependent manner. n=6 for each. Means ± SEMs. All variables have different letters, and they are significantly different (p<0.05). If two variables share a letter, they are not significantly different (p>0.05). Kruskal-Wallis test followed by Dunn’s multiple comparisons test.
Figure 2.
Figure 2.. Drosophila larvae outcompete S. marcescens in the diet.
(A) A diagram of a reductionist approach to investigate the role of Drosophila in regulating the physiology and behavior of S. marcescens. Top: Germ-free (GF) Drosophila larvae were generated by successive sterilization of fresh eggs with sanitizer Walch, sodium hypochloride (SH), ethanol, and PBS containing 0.01% Triton X-100 (PBST). Bottom: S. marcescens was cultured in a liquid medium and re-inoculated to fly cornmeal food after washing with PBS buffer. In the meantime, GF crawling larvae were transferred to the fly medium in the shared vials with S. marcescens. (B) Representative images of surface slick inoculated with S. marcescens alone and with S. marcescens over time. (C) The prodigiosin production of S. marcescens alone and in coculture at different timepoints. Prodigiosin production was assessed with the spectrometer at OD534. n=6 for each. (D) Bacterial loads of S. marcescens alone and in coculture in the time course. n=6 for each. (E) The survival rate of adult flies challenged with S. marcescens alone and in coculture. The bacterial suspension (20 μl, OD595=1) was supplemented to a vial with autoclaved fly food. Single and coculturing S. marcescens were obtained after 24 hr incubation as described in A, and the percentage of living female flies treated with S. marcescens alone and in coculture was calculated to monitor lifespan. n=180 for each. The statistical analyses were performed using log-rank test. ***p<0.001. (F) RT-qPCR analysis of the expression levels of virulence-related genes of S. marcescens alone and in coculture. n=3 for each. (G) Transmission electron microscopy of S. marcescens alone and in coculture. Scale bars: 400 nm (left panel) or 200 nm (right panel). (H) RT-qPCR analysis of the expression levels of extracellular polysaccharide production-related genes in the control and larvae groups. n=3 for each. Means ± SEMs. The statistical analyses were performed using two-tailed unpaired Student’s t-test in (F) and (H). *p<0.05; **p<0.01; ***p<0.001. All variables have different letters, and they are significantly different (p<0.05). If two variables share a letter, they are not significantly different (p>0.05). Kruskal-Wallis test followed by Dunn’s multiple comparisons test.
Figure 2—figure supplement 1.
Figure 2—figure supplement 1.. Drosophila larvae modulate S. marcescens lifestyle switch.
(A) Representative images of surface slick inoculated with S. marcescens in coculture with different numbers of crawling larvae. (B) The prodigiosin production of S. marcescens in coculture with a series of crawling larvae. n=6 for each. (C) Bacterial loads of S. marcescens in coculture with different numbers of crawling larvae. n=6 for each. (D) S. marcescens promoted the development of germ-free (GF) larvae. Developmental timing of GF, Lactobacillus plantarum-, and S. marcescens-associated Drosophila was assessed on the poor diet with 0.5% yeast. The cumulative percentage of the pupation emergence is shown over time. n=60 for each. The statistical analyses were performed using two-tailed Mann-Whitney U-test in (D). *p<0.05; **p<0.01. Means ± SEMs. All variables have different letters, and they are significantly different (p<0.05). If two variables share a letter, they are not significantly different (p>0.05). Kruskal-Wallis test followed by Dunn’s multiple comparisons test.
Figure 2—figure supplement 2.
Figure 2—figure supplement 2.. Biological factors mainly determine S. marcescens lifestyle.
(A) The schematic illustration of S. marcescens alone, with force and with larvae. Single and coculturing S. marcescens were generated as described in Figure 2A. In the meantime, S. marcescens with force were agitated using sterile glass sticks at the 2 hr interval. (B) Representative images of surface slicks associated with S. marcescens alone, with force and with larvae. (C) The prodigiosin production of S. marcescens alone, with force and with larvae. n=6 for each. (D) Bacterial loads of S. marcescens alone, with force and with larvae. n=6 for each. (E) RT-qPCR analysis of the expression levels of the pigA, pigC, pigM, and pigI genes of S. marcescens alone, with force and with larvae. n=3 for each. Means ± SEMs. All variables have different letters, they are significantly different (p<0.05). If two variables share a letter, they are not significantly different (p>0.05). Kruskal-Wallis test followed by Dunn’s multiple comparisons test.
Figure 3.
Figure 3.. Drosophila larvae adjust bacterial global transcriptional adaptation to the host.
(A) Principal component analysis (PCA) of unweighted, jack-knifed UniFrac distances of the transcriptional profile of S. marcescens alone and with larvae. PC1, principal component 1; PC2, principal component 2. Scattered dots in different colors represent samples from different experimental groups. n=4–5. (B) Volcano plot comparing gene expression profiles of S. marcescens alone and with larvae after 24 hr of incubation. X-axis represents the log2-transformed value of gene expression change folds between larvae and control groups. Y-axis represents the logarithmic transformation value of gene expression levels in S. marcescens. Genes belonging to different pathways are represented by different colored shapes as indicated. ∇ depicts genes significantly upregulated in S. marcescens with larvae compared to S. marcescens alone (log2 fold change<1; adjusted p<0.01), and △ depicts genes significantly downregulated in S. marcescens with larvae (log2 fold change<1; adjusted p<0.01) compared to S. marcescens alone. ○ depicts genes without significant alteration compared to S. marcescens alone. (C, D) Kyoto Encyclopedia of Genes and Genomes (KEGG) analysis of the significantly downregulated and upregulated genes in S. marcescens with larvae compared to S. marcescens alone. (E, F) RT-qPCR analysis of the expression levels of downregulated and upregulated genes in the control and larvae groups. n=3 for each. Means ± SEMs. The statistical analyses were performed using two-tailed unpaired Student’s t-test. **p<0.01; ***p<0.001.
Figure 3—figure supplement 1.
Figure 3—figure supplement 1.. The lifestyle switch of S. marcescens was driven by transcriptional alterations.
(A) Representative images of surface slick with S. marcescens after re-culturing 24 hr from control and larvae groups isolated bacteria. (B) The prodigiosin production of S. marcescens after re-culturing 24 hr from control and larvae groups isolated bacteria. n=6 for each. (C) Bacterial loads of S. marcescens after re-culturing 24 hr from control and larvae groups isolated bacteria. n=6 for each. (D, E) RT-qPCR analysis of the expression levels of downregulated and upregulated genes in the S. marcescens after re-culturing 24 hr from control and larvae groups isolated bacteria. n=3 for each. Means ± SEMs. The statistical analyses were performed using two-tailed unpaired Student’s t-test. *p<0.05; ns, no significance.
Figure 4.
Figure 4.. Drosophila larvae affect the global metabolic profile of S. marcescens.
(A) Principal component analysis (PCA) of unweighted, jack-knifed UniFrac distances of metabolic profile of S. marcescens alone and with larvae. PC1, principal component 1; PC2, principal component 2. Scattered dots in different colors represent samples from different experimental groups. n=5 for each. (B) Volcano plot comparing metabolic profiles of between control and larvae groups after 24 hr of incubation. X-axis represents the log2-transformed value of gene expression change folds between larvae and control groups. Y-axis represents the logarithmic transformation value of gene expression levels in S. marcescens. Red dots depict genes significantly upregulated in S. marcescens with larvae compared to S. marcescens alone (log2 fold change<1; adjusted p<0.01), and blue dots depict genes significantly downregulated in S. marcescens with larvae (log2 fold change<1; adjusted p<0.01) compared to S. marcescens alone. Gray dots depict genes without significant alteration compared to S. marcescens alone. (C) The distinct clusters of metabolites in S. marcescens alone versus coculture. (D, E) Kyoto Encyclopedia of Genes and Genomes (KEGG) pathway analysis of the significantly downregulated and upregulated metabolites in S. marcescens with larvae compared to S. marcescens alone.
Figure 4—figure supplement 1.
Figure 4—figure supplement 1.. Interaction network analysis of transcriptome and metabolome.
(A) Interaction network analysis of transcriptome and metabolome of S. marcescens alone and with larvae. 42 differentially expressed metabolites (red circles) are related to differentially expressed genes involved in the ribosome (light brown), transcription (dark brown), DNA replication (light purple), energy metabolism (dark green), ABC transporters (dark blue), phosphotransferase system (light blue), quorum sensing (dark purple), and exosome (light blue). (B) The prodigiosin production of S. marcescens alone and with predicted metabolites. (C) Bacterial loads of S. marcescens alone and with predicted metabolites. n=6 for each. (D) The survival rate of adult flies challenged with S. marcescens alone and with metabolites. n=180 for each. The statistical analyses were performed using log-rank test. *p<0.05; ***p<0.001. (E) RT-qPCR analysis of the expression levels of virulence-related genes of S. marcescens alone and with metabolites. n=3 for each. Means ± SEMs. All variables have different letters, and they are significantly different (p<0.05). If two variables share a letter, they are not significantly different (p>0.05). Kruskal-Wallis test followed by Dunn’s multiple comparisons test.
Figure 5.
Figure 5.. Pathogenicity heterogeneity of S. marcescens.
(A) mRNA gene counts per cell for S. marcescens alone, with force and with larvae. Each dot represents a bacterial cell of S. marcescens. (B) Joint UMAP two-dimensional analysis showing that are distinct clusters among S. marcescens alone, with force and with larvae. (C) The cell subpopulation among the control, force, and larvae groups. There were three distinct subpopulations in the control and force groups. (D) Mean expression levels of genes involved in ABC transporter, quorum sensing, secretion system, two-component system, LPS and peptidoglycan biosynthesis, and virulence-related genes in different subclusters. The shape of each dot indicates the proportion of cells in the cluster, while the color indicates the average activity normalized from 0% to 100% across all clusters. (E, F) The expression of a representative gene of ABC transporter and quorum sensing was highlighted on the UMAP. The red color bars represent the normalized expression of a gene across all cells analyzed. (G, H) Violin plots of livI and oppA gene in different subclusters. Each dot represents a single cell and the shapes represent the expression distribution. (I, J) The expression of a representative gene of secretion system and virulence-related genes was highlighted on the UMAP. The red color bars represent the normalized expression of a gene across all cells analyzed. (K, L) Violin plots of secY and fp gene in different subclusters. Each dot represents a single cell and the shapes represent the expression distribution.
Figure 5—figure supplement 1.
Figure 5—figure supplement 1.. Heat-induced phenotypic heterogeneity of S. marcescens.
(A) mRNA gene counts per cell for the control and heat-shock groups. Each dot represents a bacterial cell of S. marcescens. (B) Joint UMAP two-dimensional analysis of S. marcescens showing that are distinct clusters between the control and heat-shock groups. (C) The cell subpopulation typing of the control and heat-shock groups. (E, F) The expression of two representative genes of heat shock and stress response was highlighted on the UMAP. The red color bars represent the normalized expression of a gene across all cells analyzed.
Figure 6.
Figure 6.. Growth heterogeneity of S. marcescens.
(A) Mean expression levels of genes involved in ribsome, DNA replication, nitrogen metabolism, and carbon metabolism in different subclusters. The shape of each dot indicates the proportion of cells in the cluster, while the color indicates the average activity normalized from 0% to 100% across all clusters. (B, C) The expression of a representative gene of ribsome and DNA replication was highlighted on the UMAP. The red color bars represent the normalized expression of a gene across all cells analyzed. (D, E) Violin plots of rpsL and trpD genes in different subclusters. Each dot represents a single cell and the shapes represent the expression distribution. (F, G) The expression of two representative genes of nitrogen metabolism and carbon metabolism was highlighted on the UMAP. The red color bars represent the normalized expression of a gene across all cells analyzed. (H, I) Violin plots of glnK, glnA, pgk, and adhE genes in different subclusters. Each dot represents a single cell and the shapes represent the expression distribution. (J) Schematic of the pathogenicity and commensalism regulatory pathway.
Figure 6—figure supplement 1.
Figure 6—figure supplement 1.. Larvae affect the metabolism of S. marcescens.
(A) The survival rate of adult flies challenged with S. marcescens alone, with agitation and in coculture. S. marcescens with alone, with agitation, and in coculture were obtained after 24 hr incubation as described in Figure 2—figure supplement 2A, and the percentage of living female flies was calculated to monitor lifespan. n=180 for each. The statistical analyses were performed using log-rank test. ***p<0.001; ns, no significance. (B, C) The expression of two representative genes of nitrogen metabolism and carbon metabolism was highlighted on the UMAP. The red color bars represent the normalized expression of a gene across all cells analyzed. (D, E) Violin plots of glnK, glnA, pgk, and adhE genes in different subclusters. Each dot represents a single cell and the shapes represent the expression distribution.
Figure 7.
Figure 7.. Larvae-derived antimicrobial peptides (AMPs) antagonize S. marcescens.
(A) Representative images of surface slick with S. marcescens alone, with larvae, with secreta, and with AMPs. (B) The prodigiosin production of S. marcescens alone, with larvae, with secreta, and with AMPs. (C) Bacterial loads of S. marcescens alone, with larvae, with secreta, and with AMPs. AMPs: cecropin A (40 μg/μl, 80 μg/μl). (D) Representative images of surface slick with S. marcescens alone, with wild-type larvae, with ΔAMP14 larvae, with AMPs, with ΔAMP14 larvae+AMPs, and wild-type larvae+AMPs. (E) The prodigiosin production of S. marcescens alone, with wild-type larvae, with ΔAMP14 larvae, with AMPs, with ΔAMP14 larvae+AMPs, and wild-type larvae+AMPs. (F) Bacterial loads of S. marcescens alone, with wild-type larvae, with ΔAMP14 larvae, with AMPs, with ΔAMP14 larvae+AMPs, and wild-type larvae+AMPs. AMPs: cecropin A=40 μg/μl. (G, H) RT-qPCR analysis of the expression levels of downregulated and upregulated genes in the S. marcescens alone, with wild-type larvae, with ΔAMP14 larvae, with AMPs, with ΔAMP14 larvae+AMPs, and wild-type larvae+AMPs. For B–C and E–F, n=6 for each. For G–H, n=3 for each. Means ± SEMs. All variables have different letters, and they are significantly different (p<0.05). If two variables share a letter, they are not significantly different (p>0.05). Kruskal-Wallis test followed by Dunn’s multiple comparisons test.
Figure 7—figure supplement 1.
Figure 7—figure supplement 1.. Antimicrobial peptides (AMPs) play a major role in recapitulating the response of S. marcescens to larvae.
(A) Representative images of surface slick with S. marcescens alone, with ΔAMP14 larvae, and with RelE20 larvae. (B) The prodigiosin production of S. marcescens alone, with ΔAMP14 larvae, and with RelE20 larvae. n=6 for each. (C) Bacterial loads of S. marcescens alone, with ΔAMP14 larvae, and with RelE20 larvae. n=6 for each. Means ± SEMs. All variables have different letters, they are significantly different (p<0.05). If two variables share a letter, they are not significantly different (p>0.05). Kruskal-Wallis test followed by Dunn’s multiple comparisons test.
Author response image 1.
(A) Representative images of surface slick with S. marcescens alone, with kanamycin (5 μg/μl) and ampicillin (10 μg/μl). (B) The prodigiosin production of S. marcescens alone, with kanamycin (5 μg/μl) and ampicillin (10 μg/μl). n = 6 for each. (C) Bacterial loads of S. marcescens alone, with kanamycin (5 μg/μl) and ampicillin (10 μg/μl). n = 6 for each. (D, E) RT-qPCR analysis of the expression levels of downregulated and upregulated genes in the S. marcescens alone, with kanamycin (5 μg/μl) and ampicillin (10 μg/μl). n = 3 for each. Means ± SEMs. All variables have different letters, they are significantly different (p < 0.05). If two variables share a letter, they are not significantly different (p > 0.05). ns, no significance. Kruskal-Wallis test followed by Dunn’s multiple comparisons test.

Update of

  • doi: 10.1101/2024.02.14.580325
  • doi: 10.7554/eLife.96789.1
  • doi: 10.7554/eLife.96789.2

Similar articles

Cited by

References

    1. Ackermann M. A functional perspective on phenotypic heterogeneity in microorganisms. Nature Reviews. Microbiology. 2015;13:497–508. doi: 10.1038/nrmicro3491. - DOI - PubMed
    1. Avraham R, Haseley N, Brown D, Penaranda C, Jijon HB, Trombetta JJ, Satija R, Shalek AK, Xavier RJ, Regev A, Hung DT. Pathogen cell-to-cell variability drives heterogeneity in host immune responses. Cell. 2015;162:1309–1321. doi: 10.1016/j.cell.2015.08.027. - DOI - PMC - PubMed
    1. Bäckhed F, Ley RE, Sonnenburg JL, Peterson DA, Gordon JI. Host-bacterial mutualism in the human intestine. Science. 2005;307:1915–1920. doi: 10.1126/science.1104816. - DOI - PubMed
    1. Barak-Gavish N, Dassa B, Kuhlisch C, Nussbaum I, Brandis A, Rosenberg G, Avraham R, Vardi A. Bacterial lifestyle switch in response to algal metabolites. eLife. 2023;12:e84400. doi: 10.7554/eLife.84400. - DOI - PMC - PubMed
    1. Becattini S, Sorbara MT, Kim SG, Littmann EL, Dong Q, Walsh G, Wright R, Amoretti L, Fontana E, Hohl TM, Pamer EG. Rapid transcriptional and metabolic adaptation of intestinal microbes to host immune activation. Cell Host & Microbe. 2021;29:378–393. doi: 10.1016/j.chom.2021.01.003. - DOI - PMC - PubMed

Associated data