. 2024 Oct 7;221(10):e20240152.
doi: 10.1084/jem.20240152. Epub 2024 Aug 27.

Immunologic signatures of response and resistance to nivolumab with ipilimumab in advanced metastatic cancer

Affiliations

Immunologic signatures of response and resistance to nivolumab with ipilimumab in advanced metastatic cancer

Apostolia M Tsimberidou et al. J Exp Med. .

Abstract

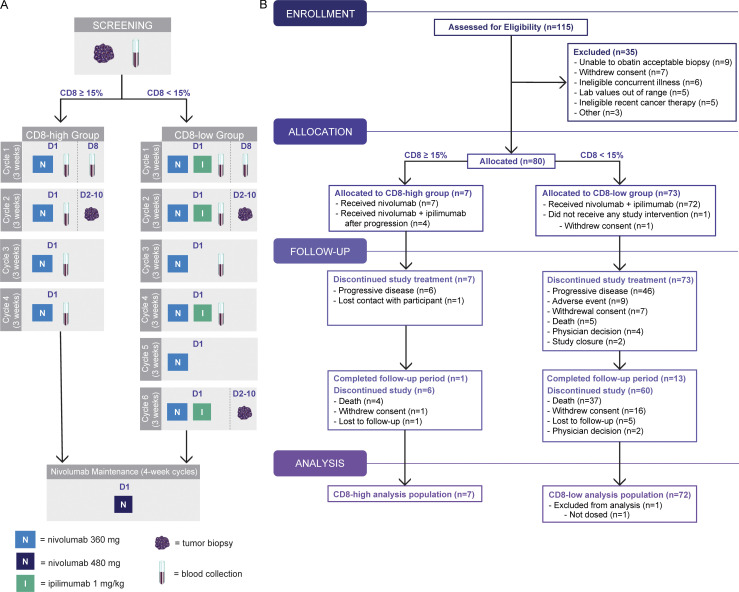
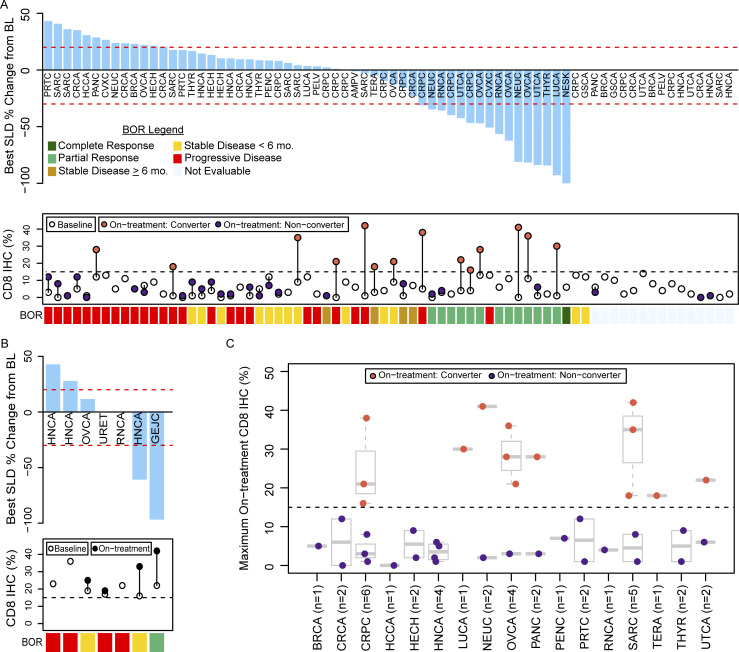
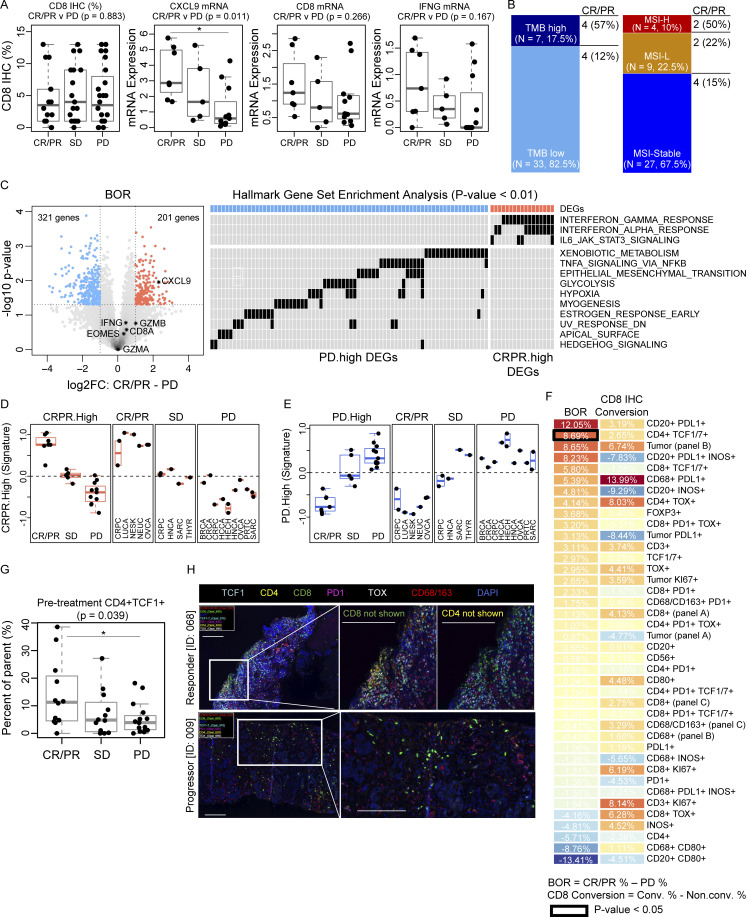
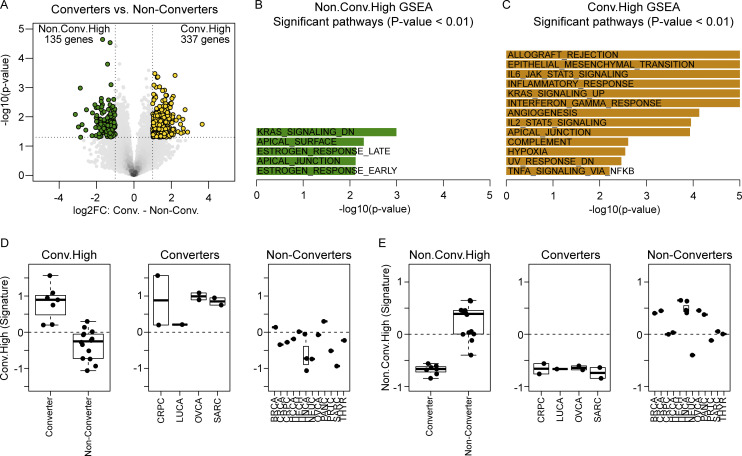
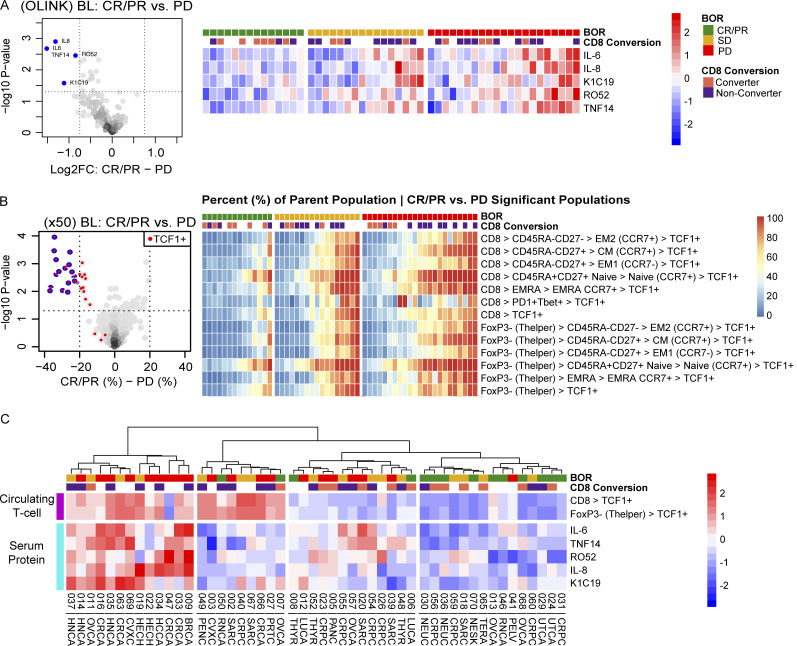
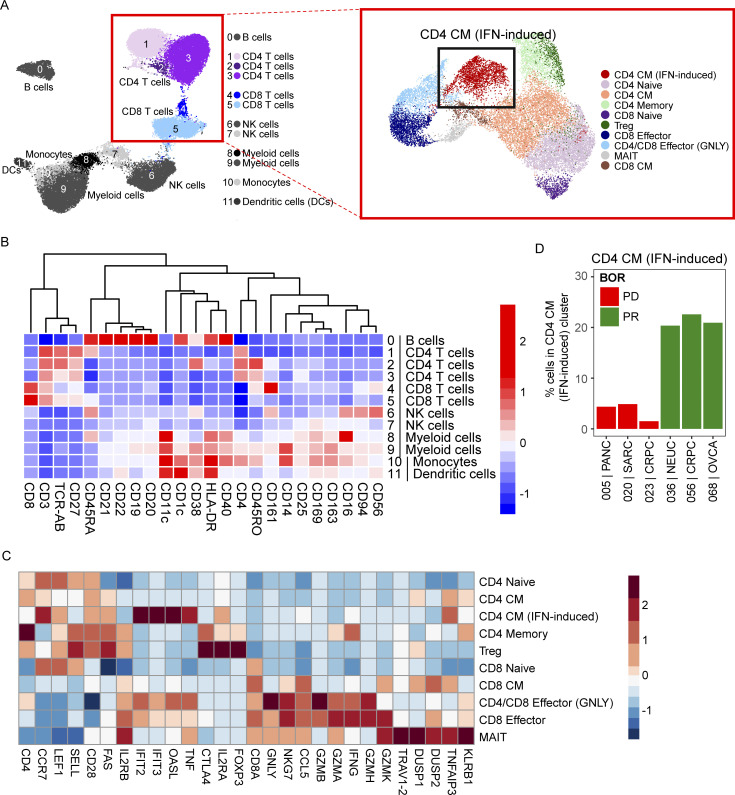
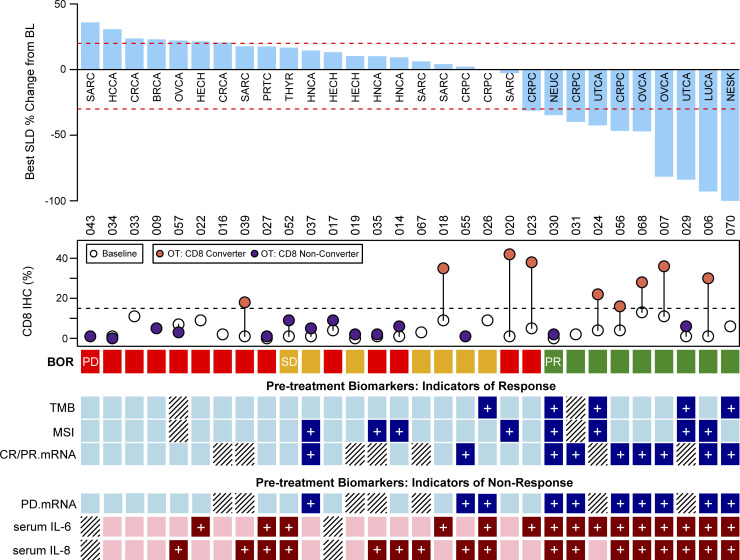
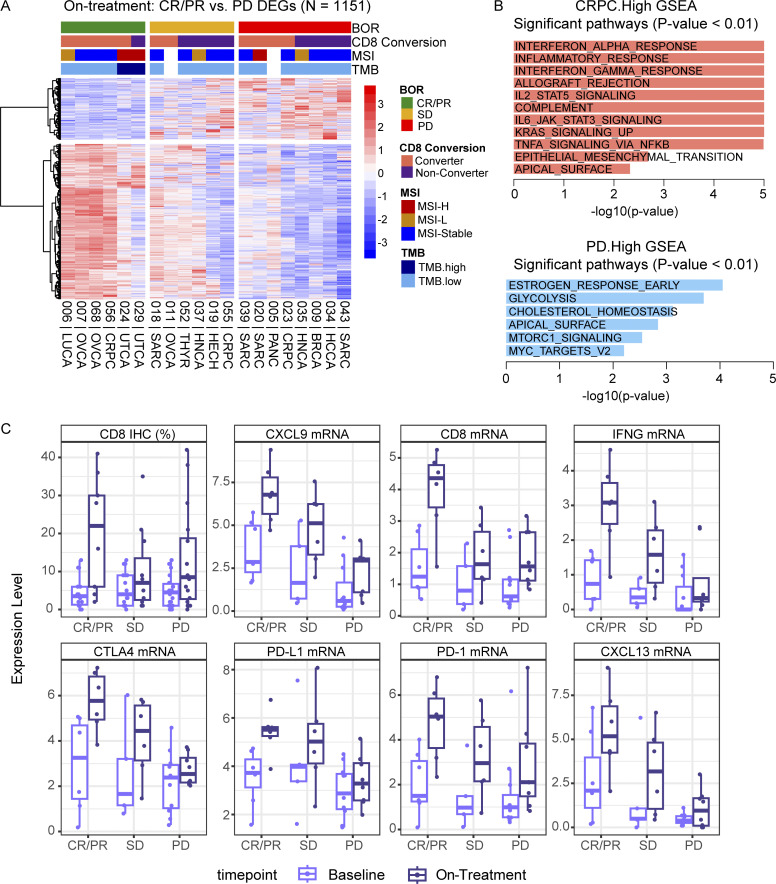
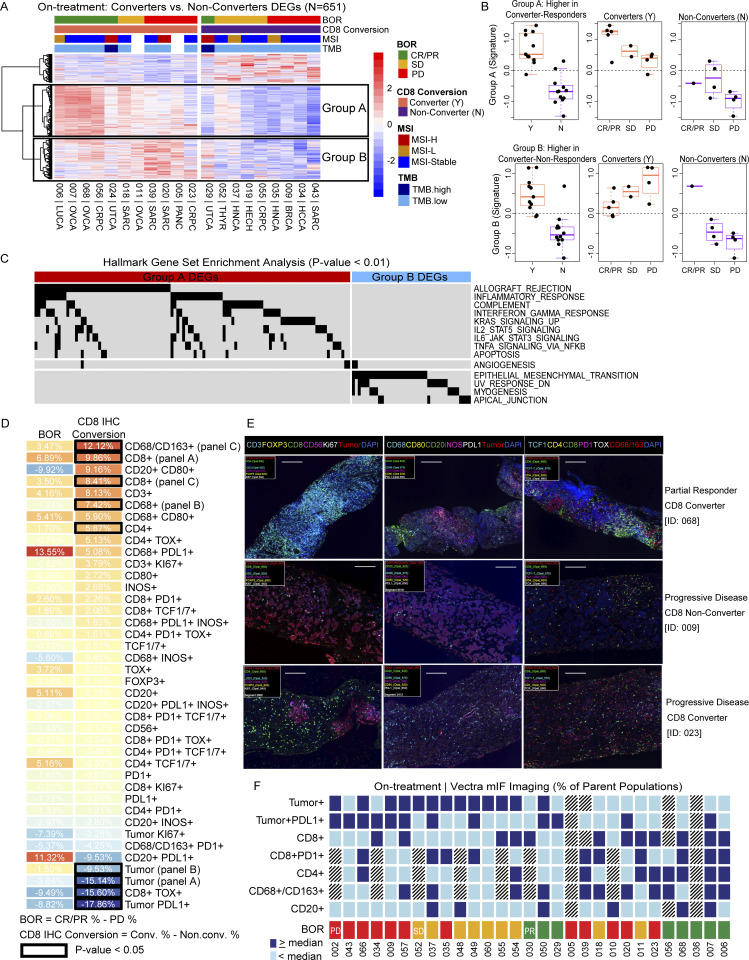
Identifying pan-tumor biomarkers that predict responses to immune checkpoint inhibitors (ICI) is critically needed. In the AMADEUS clinical trial (NCT03651271), patients with various advanced solid tumors were assessed for changes in intratumoral CD8 percentages and their response to ICI. Patients were grouped based on tumoral CD8 levels: those with CD8 <15% (CD8-low) received nivolumab (anti-PD-1) plus ipilimumab (anti-CTLA4) and those with CD8 ≥15% (CD8-high) received nivolumab monotherapy. 79 patients (72 CD8-low and 7 CD8-high) were treated. The disease control rate was 25.0% (18/72; 95% CI: 15.8-35.2) in CD8-low and 14.3% (1/7; 95% CI: 1.1-43.8) in CD8-high. Tumors from 35.9% (14/39; 95% CI: 21.8-51.4) of patients converted from CD8 <15% pretreatment to ≥15% after treatment. Multiomic analyses showed that CD8-low responders had an inflammatory tumor microenvironment pretreatment, enhanced by an influx of CD8 T cells, CD4 T cells, B cells, and macrophages upon treatment. These findings reveal crucial pan-cancer immunological features for ICI response in patients with metastatic disease.


Conflict of interest statement

Disclosures: A.M. Tsimberidou reported grants from Parker Institute for Cancer Immunotherapy (PICI) during the conduct of the study; grants from OBI Pharmaceuticals, Tachyon, Orionis, AbbVie, Immatics, Vividion, Novocure, Tempus, Agenus, Tvardi, and Macrogenics; and personal fees from Avstera, Macrogenics, BrYet, Bioeclipse, NEX-I, and VinceRx outside the submitted work. A. Drakaki reported personal fees from BMS, Merck, AZ, Roche, Seagen, Exelixis, and EMD Serono outside the submitted work. D.N. Khalil reported personal fees from Abbvie, Akamis Bio, and Celldex Therapeutics outside the submitted work; in addition, D.N. Khalil had a patent to US20240109973A1 pending, a patent to AU2016304597B2 issued, and a patent to CA3042867A1 pending. S. Kummar reported personal fees from Fortress Biotech, Inc., Gilead, GI Innovation, Inc., Mundibiopharma, Oxford Biotherapeutics, Springworks Therapeutics, Bayer, Genome Insight, XYOne Therapeutics, BPGbio Therapeutics, Genome and Company, and HarbourBiomed and “other” from Pathomiq and Mirati outside the submitted work. F.S. Hodi reported “other” from Bristol Myers Squibb during the conduct of the study and personal fees from Bristol Myers Squibb, Merck, Novartis, Compass Therapeutics, Apricity, 7 Hills Pharma, Bicara, Checkpoint Therapeutics, Genentech, Bioentre, Gossamer, Iovance, Catalym, Immunocore, Kairos, Rheos, Bayer, Zumotor, Corner Therapeutics, Puretech, Curis, Astra Zeneca, Pliant, Solu Therapeutics, Vir biotechnology, and 92Bio outside the submitted work; in addition, F.S. Hodi had a patent to Methods for Treating MICA-Related Disorders (#20100111973) with royalties paid to institution per institutional policies, a patent to Tumor antigens and uses thereof (#7250291) issued, a patent to Angiopoiten-2 Biomarkers Predictive of Anti-immune checkpoint response (#20170248603) pending, a patent to Compositions and Methods for Identification, Assessment, Prevention, and Treatment of Melanoma using PD-L1 Isoforms (#20160340407) pending, a patent to Therapeutic peptides (#20160046716) pending, a patent to Methods of Using Pembrolizumab and Trebananib pending, a patent to Vaccine compositions and methods for restoring NKG2D pathway function against cancers Patent number: 10279021 with royalties paid to institution per institutional, a patent to Antibodies that bind to MHC class I polypeptide-related sequence A Patent number: 10106611 with royalties paid to institution per institutional, a patent to Anti-Galectin Antibody Biomarkers Predictive of Anti-Immune Checkpoint and Anti-Angiogenesis Responses pending, and a patent to Antibodies against EDIL3 and methods of use thereof pending. D.Y. Oh reported grants from Damon Runyon Cancer Research Foundation, V Foundation for Cancer Research, Prostate Cancer Foundation, and Nutcracker Therapeutics; “other” from Merck, PACT Pharma, Poseida Therapeutics, TCR2 Therapeutics, and Roche/Genentech; and personal fees from Revelation Partners outside the submitted work; and has received research support (to the institution) from Merck, PACT Pharma, Poseida Therapeutics, TCR2 Therapeutics, Roche/Genentech, and Nutcracker Therapeutics; travel and accommodations from Roche/Genentech; and has consulted for Revelation Partners. M. Amouzgar reported fees for consulting. M. Spasic reported personal fees from Natera outside the submitted work. M.T. Tetzlaff reported “other” from Merck and personal fees from Clinical care options outside the submitted work. T.J. Hollmann reported grants from Bristol Myers Squibb, Calico Labs, and PICI during the conduct of the study. J.S. Moore reported, “This was performed on a flow cytometer provided to the Parker Institute for Cancer Immunotherapy and some panel reagents were provided under an agreement between BDIS and PICI.” S. Velichko reported personal fees from Natera, Inc. during the conduct of the study. S. Bucktrout reported personal fees from Akamis Bio outside the submitted work. U. Dugan reported “other” from BMS during the conduct of the study. At the time of writing this manuscript V.M. Hubbard-Lucey is employed and has stock/interest in Bristol Myers Squibb. J. O’Donnell-Tormey reported grants from Bristol Myers Squibb outside the submitted work. L.H. Butterfield reported advisory activities (honoraria): Calidi Scientific and Medical Advisory Board, 2017–2023; KaliVir, Scientific Advisory Board, 2018–2023; Torque Therapeutics, Scientific Advisory Board, 2018–2020; Khloris, Scientific Advisory Board, 2019–2023; Pyxis, Scientific Advisory Board, 2019–2023; CytomX, Scientific Advisory Board, 2019–2023; DCprime, Scientific Advisory Board meeting, Nov. 2020; RAPT, Scientific Advisory Board, 2020–2023; Takeda, Scientific Advisor, 2020–2023; EnaraBio scientific advisor, Feb. 2021; Federation Bio scientific advisor Sept.–Oct. 2022; Pfizer scientific advisor Oct. 2022, Apple Tree 2022–2023, Orionis 2023. J. Fairchild reported personal fees from PICI outside the submitted work. T.M. LaVallee reported personal fees from PICI outside the submitted work; and is currently employed at Coherus Biosciences. P. Sharma reported “other” from Achelois, Adaptive Biotechnologies, Affini-T, Akoya Biosciences, Apricity, Asher Bio, BioAtla LLC, BioNTech, Candel Therapeutics, Catalio, C-Reveal Therapeutics, Dragonfly Therapeutics, Earli Inc, Enable Medicine, Glympse, Henlius/Hengenix, Hummingbird, ImaginAb, InterVenn Biosciences, JSL Health, LAVA Therapeutics, Lytix Biopharma, Marker Therapeutics, Matrisome, Oncolytics, Osteologic, PBM Capital, Phenomic AI, Polaris Pharma, Sporos, Spotlight, Time Bioventures, Trained Therapeutix Discovery, Two Bear Capital, and Xilis, Inc. outside the submitted work. No other disclosures were reported.

Figures

Figure 1.
Figure 1.
AMADEUS study design and CONSORT (Consolidated Standards of Reporting Trials) diagram. (A) AMADEUS was a clinical study that prospectively defined and assessed hot versus cold tumors using pretreatment percentages of CD8 cells. Patients in the CD8-high group received nivolumab monotherapy and those in the CD8-low group received nivolumab and ipilimumab combination. After completing four cycles in the CD8-high group or six cycles in the CD8-low group, patients continued to receive maintenance nivolumab. Tumor biopsies were mandatory at screening. Biopsies were also obtained Cycle 2 (both groups), Cycle 6 (CD8-low group), and at disease progression (CD8-high group), if medically feasible. Blood samples for translational analysis were collected at screening, Cycles 1–4, and the end of treatment visit. (B) CONSORT flow diagram. D = day.
Figure 2.
Figure 2.
Tumor response and change in tumoral percentage of CD8 T cells. (A and B) Tumor type and maximum percentage change from baseline in the sum of the longest diameters of the target lesions (top) along with pretreatment (empty circles) and on-treatment (colored circles) tumoral CD8 IHC percentage (bottom) for each patient in the (A) CD8-low and (B) CD8-high groups. If a patient had multiple on-treatment biopsies, the largest on-treatment CD8 percentage is plotted. 14 of 39 patients in the CD8-low group with an on-treatment biopsy had tumors that converted from CD8-low (<15%) to CD8-high (≥15%; orange circles). (C) Maximum on-treatment CD8 percentage for patients in the CD8-low group, presented by tumor type. Box plots show the median and quartiles, and whiskers represent 1.5 times the interquartile range. Tumor-type abbreviations are defined in Table 1. BL = baseline/pretreatment; BOR = best overall response; SLD = sum of longest diameters.
Figure 3.
Figure 3.
Pretreatment tumor inflammatory gene expression and mIF imaging. (A) Box plots of pretreatment CD8 IHC (%) and mRNA expression levels of CXCL9, CD8A, and IFNG genes grouped by best overall response (BOR). Expression levels were compared between responders (CR/PR, n = 7) and progressors (PD, n = 11) by the student’s T test. (B) Bar plots of TMB (left) and MSI (right) status in pretreatment biopsies. (C) Volcano plot of the DEGs in pretreatment tumor biopsies between responders (n = 7) versus progressors (n = 11) and Hallmark GSEA indicating the DEGs contributing to significantly enriched pathways (P < 0.01). The heatmap only displays DEGs within these pathways. (D and E) Box plots of the aggregate gene expression (signature) of the CRPR.high and PD.high DEGs plotted by tumor type. (F) Heatmap displaying mean differences in cell populations detected by mIF (Vectra; scale bar, 200 μm) imaging of pretreatment tumor samples, comparisons done by BOR: CR/PR (%, n = 14) − PD (%, n = 21) and CD8 conversion: converter (%, n = 13) − non-converter (%, n = 22). Markers featured in multiple panels are denoted with the respective panel label. (G) Box plots of tumoral TCF1+ CD4 T cells (%) grouped by BOR. (H) Representative ROI images from two patients with pretreatment tumor biopsies probed with antibodies from mIF (panel C). Top: Representative ROI from tumor tissue from an ovarian cancer patient (ID: 068) with BOR: PR, biopsy location: lymph node. Bottom: Representative ROI from a breast cancer patient (ID: 009) with BOR: PD, biopsy location: liver. Box plots show median and quartiles, and whiskers represent 1.5 times the IQR. Tumor-type abbreviations are defined in Table 1. *P < 0.05 by student’s T test (A, F, and G).
Figure S1.
Figure S1.
Differential gene expression analysis on pretreatment tumor samples comparing CD8 converters versus non-converters in the CD8-low group. (A) Volcano plot of the DEGs when comparing pretreatment tumor samples from CD8 converters (n = 7) versus CD8 non-converters (n = 14). (B and C) Hallmark GSEA results indicating pathways with genes overrepresented in the Non-converter.High DEGs and the Converter.High DEGs. (D and E) Box plots of aggregated gene expression (signature) of the DEGs plotted by tumor type. Box plots show median and quartiles and whiskers represent 1.5× IQR. Tumor-type abbreviations are defined in Table 1. FC = fold change.
Figure 4.
Figure 4.
Pretreatment peripheral blood-based biomarkers associated with progression. (A) Left: Volcano plot of serum cytokines comparing responders (CR/PR, n = 14) to progressors (PD, n = 21); statistically significant cytokines highlighted in blue. Right: Heatmap of patients sorted by response and the aggregate z-scores of IL-6, IL-8, K1C19, RO52, and TNF14. (B) Left: Volcano plot of the X50 gated T cell subsets from pretreatment PBMCs comparing responders (CR/PR, n = 14) to progressors (PD, n = 23); statistically significant populations indicated in blue. Right: Heatmap of the percent of parent values of the significantly different T cell populations, sorted by response. (C) Heatmap of normalized OLINK and X50 expression of blood biomarkers associated with response. Tumor-type abbreviations are defined in Table 1. BL = baseline; BOR = best overall response; FC = fold change.
Figure S2.
Figure S2.
Higher pretreatment frequencies of circulating IFN-induced central memory (CM) CD4 T cells are found in responders. CITEseq analysis on pretreatment PBMCs from six patients (all CD8 converters: n = 3 partial responders, n = 3 progressors). (A) 10 T cell clusters identified using ADT and gene expression. (B) Gene expression profile of 12 cell clusters derived from ADTs. (C) Gene expression of T cell subset clusters. (D) Bar plots of the percentage of cells in the CD4 central memory cluster grouped by tumor type. Tumor-type abbreviations are defined in Table 1. BOR = best overall response; MAIT = mucosal-associated invariant T cells.
Figure 5.
Figure 5.
Pretreatment biomarkers associated with response to nivolumab and ipilimumab. Summary table of six biomarkers associated with response pretreatment (four from tumor tissue, colored blue: TMB, MSI, CR/PR.mRNA tumor gene expression signature, and PD.mRNA tumor gene expression signature; and two from blood, colored red: serum IL-6 and IL-8). Biomarker values associated with response are shown in a darker color with a “+”: TMB-high; MSI-high or MSI-low; CR/PR.mRNA expression above the median; PD.mRNA expression below the median; serum IL-6 expression below the median; and serum IL-8 expression below the median. Hatched lines indicate that biomarker data is not available. Data are shown for patients in the CD8-low group with at least four of the six biomarkers assessed. Tumor-type abbreviations are defined in Table 1. BL = baseline; BOR = best overall response; OT = on-treatment; SLD = sum of longest diameters.
Figure S3.
Figure S3.
On-treatment tumor inflammatory signatures associate with response to nivolumab and ipilimumab. (A) Heatmap of DEGs from on-treatment tumor samples comparing responders (CR/PR, n = 6) to progressors (PD, n = 8). Patients (columns) are sorted by best overall response (BOR) and then CD8 conversion. (B) Hallmark GSEA of the statistically significant pathways (P < 0.01) for genes that are significantly higher in responders (CRPC.High) and progressors (PD.High). (C) Box plots of CD8 IHC (%) and mRNA expression levels of select genes, grouped by BOR. Box plots show median and quartiles and whiskers represent 1.5× IQR. Tumor-type abbreviations are defined in Table 1.
Figure 6.
Figure 6.
On-treatment inflammatory TME and higher frequencies of circulating activated and proliferating T cells in responders. (A) Heatmap of patients sorted by conversion then response with expression of the DEGs identified by comparing on-treatment tumor samples from CD8 converters to non-converters. Unsupervised clustering revealed three distinct signatures, including genes higher in responders who were CD8 converters (Group A) and genes higher in non-responders who were CD8 converters (Group B). The complete list of genes displayed in this figure is available as Table S15. (B) Box plots of Group A and Group B gene signatures by best overall response (BOR) and CD8 conversion (Y = converter, N = non-converter). (C) GSEA pathways enriched in Groups A and B. (D) Heatmap displaying mean differences in cell populations detected by mIF imaging (Vectra) of on-treatment tumor samples, comparisons done by BOR: CR/PR (%, n = 7) − PD (%, n = 12) and CD8 conversion: converter (%, n = 10) − non-converter (%, n = 21) by the student’s T test; significantly different populations are denoted by a black outline. Markers featured in multiple panels are denoted with the respective panel label. (E) Representative ROI images at 200× final magnification from three patients with on-treatment tumor biopsies from three mIF panels; left: panel A, middle: panel B, right: panel C (scale bar, 200 μm). (F) Selected mIF imaging results show the combination of cell types that are present (≥ median), absent (< median), or not evaluable (grey) for each patient with on-treatment mIF data. Box plots show median and quartiles, and whiskers represent 1.5 times the IQR. Tumor-type abbreviations are defined in Table 1.
Figure 7.
Figure 7.
Increased on-treatment TCR clonality in the tumor of responders. (A) Box plots of TCR repertoire diversity index (Chao1) from baseline/pretreatment (BL) and on-treatment (OT) tumor biopsies by best overall response (BOR). (B and C) (B) TCA and (C) TCB clones shared across patients. Only patients with shared clones are displayed in the plots. (D) Overview of shared HLA alleles among patients with available TCR sequencing data. Each column corresponds to a patient and each row to a specific HLA allele. The numerical value in each cell represents the count of patients sharing a particular allele. (E) The total number of distinct TCRs found in the periphery sorted by T cell subsets identified by CITEseq analysis of PBMCs at baseline/pretreatment and C1D8 from four patients: two partial responders and two progressors. Also indicated are the number of TCRs found in both the periphery and tumor tissue for each T cell subset detected in the periphery. CM = central memory; iNKT = invariant NK T cells; MAIT = mucosal-associated invariant T cells.
Figure 8.
Figure 8.
On-treatment increase of proinflammatory cytokines and expansion of activated and stem cell progenitor-like T cells in the periphery of responders to nivolumab and ipilimumab. (A) Volcano plots of differentially expressed cytokines (after normalization to pretreatment levels) between responders (CR/PR, n = 14) and progressors (PR, n = 20) by timepoint. (B) Box plots of significantly different cytokines that are differentially expressed between responders (CR/PR) and progressors (PD) by student’s T test (*P < 0.05; **P < 0.01). (C) Heatmap of gated immune cell populations from PBMCs analyzed by CyTOF showing mean differences (% of parent) between the responders (CR/PR, n = 11) and progressors (PD, n = 24) at pre- and on-treatment timepoints (C1D8, C2D1, and C3D1), significantly different populations (P < 0.05) by student’s T test are denoted by a black outline box. (D) Box plots of the C1D1 (pretreatment) circulating TCF1+ CD8 cells (left) and TCF1+ CD4 (FOXP3−/T helper) cells (right) as percent of parent grouped by BOR and CD8 conversion status. (E) Box and line plots of the circulating TCF1+ CD8 T cells (left) and TCF1+ CD4 (FOXP3−/T helper) cells (right) at each on-treatment timepoint (C1D8, C2D1, C3D1, C4D1, EOT) normalized to pretreatment levels grouped by BOR and CD8 conversion. Box plots show median and quartiles and whiskers represent 1.5 times the IQR. BOR = best overall response; CM = central memory; EM = effector memory; EOT = end of treatment; FC = fold change.
Figure 9.
Figure 9.
Single-cell trajectory analysis for circulating CD8 T cells pre- and on-treatment in the CD8-low group. CITEseq was performed on PBMCs pretreatment (C1D1) and on-treatment (C1D8) from six patients (three partial responders [PR], three progressors [PD], all CD8 converters). (A) Pseudotime trajectory clustering of CD8 T cells constructed from ADT components of T cell protein targets. (B) CD8 T cell density trends are depicted for progressors (PD, top row) and responders (PR, bottom row) pretreatment (C1D1, lighter lines) and on-treatment (C1D8, darker lines). (C) Normalized signatures of Tnaive, Tscm, Tcm, Tem, Tte, and T senescent/exhausted cells (Tsenes.ex) along the T cell transcriptome trajectory. (D) Heatmap of normalized expression for all ADT features used for trajectory inference. (E) Volcano plot showing results of differential gene expression analysis comparing genes significantly associated with the T cell trajectory. Consistent with the ADT data, naive and stem-like genes including IL7R and TCF7 significantly enriched earlier in the trajectory, and activated or effector genes like ZEB2, Granzymes, and NKG7 significantly enriched later in the trajectory. (F) UpSet plot summarizing the number of genes significantly associated with pretreatment (C1D1) and on-treatment (C1D8) phenotypes, and responder (PR) and non-responder (PD) pharmacodynamics along the T cell trajectory. (G) Heatmap showing DEGs (normalized expression) between comparison groups versus the T cell trajectory pseudotime. Larger differences indicate where along this T cell state trajectory that the gene expression differences are the largest. (H) Heatmap of normalized expression for genes significantly changing with nivolumab and ipilimumab treatment among responders for all four clinical groups: C1D1 responders, C1D8 responders, C1D1 non-responders, and C1D8 non-responders. (I) Normalized transcript expression of genes associated with the T cell trajectory in a response- or timepoint-dependent manner. JUNB expression was particularly high among non-responder Tn and Tcm/Tscm states at C1D1 and decreased on-treatment but remained stable among responders. Non-responders had high JUNB and TCF7 expression along the Tem and early Tte states. Responders had increased SELL and IFITM1 expression among the effector states compared to non-responder.
Figure S4.
Figure S4.
CyTOF broad immune profile panel gating strategy. CM = central memory; EM = effector memory; EMRA = terminally differentiated effector memory.
Figure S5.
Figure S5.
X50 T cell panel gating strategy. CM = central memory; EM = effector memory; EMRA = terminally differentiated effector memory.

References

    1. Assarsson, E., Lundberg M., Holmquist G., Björkesten J., Thorsen S.B., Ekman D., Eriksson A., Rennel Dickens E., Ohlsson S., Edfeldt G., et al. 2014. Homogenous 96-plex PEA immunoassay exhibiting high sensitivity, specificity, and excellent scalability. PLoS One. 9:e95192. 10.1371/journal.pone.0095192 - DOI - PMC - PubMed
    1. Beltra, J.-C., Manne S., Abdel-Hakeem M.S., Kurachi M., Giles J.R., Chen Z., Casella V., Ngiow S.F., Khan O., Huang Y.J., et al. 2020. Developmental relationships of four exhausted CD8+ T cell subsets reveals underlying transcriptional and epigenetic landscape control mechanisms. Immunity. 52:825–841.e8. 10.1016/j.immuni.2020.04.014 - DOI - PMC - PubMed
    1. Bratman, S.V., Yang S.Y.C., Iafolla M.A.J., Liu Z., Hansen A.R., Bedard P.L., Lheureux S., Spreafico A., Razak A.A., Shchegrova S., et al. 2020. Personalized circulating tumor DNA analysis as a predictive biomarker in solid tumor patients treated with pembrolizumab. Nat. Cancer. 1:873–881. 10.1038/s43018-020-0096-5 - DOI - PubMed
    1. Cercek, A., Lumish M., Sinopoli J., Weiss J., Shia J., Lamendola-Essel M., El Dika I.H., Segal N., Shcherba M., Sugarman R., et al. 2022. PD-1 blockade in mismatch repair-deficient, locally advanced rectal cancer. N. Engl. J. Med. 386:2363–2376. 10.1056/NEJMoa2201445 - DOI - PMC - PubMed
    1. Chen, D.S., and Mellman I.. 2017. Elements of cancer immunity and the cancer-immune set point. Nature. 541:321–330. 10.1038/nature21349 - DOI - PubMed

Publication types

MeSH terms