. 2024 Aug 27;134(19):e180310.
doi: 10.1172/JCI180310.

The senescence-associated secretome of Hedgehog-deficient hepatocytes drives MASLD progression

Affiliations

The senescence-associated secretome of Hedgehog-deficient hepatocytes drives MASLD progression

Ji Hye Jun et al. J Clin Invest. .

Abstract

The burden of senescent hepatocytes correlates with the severity of metabolic dysfunction-associated steatotic liver disease (MASLD), but the mechanisms driving senescence and how it exacerbates MASLD are poorly understood. Hepatocytes experience lipotoxicity and become senescent when Smoothened (Smo) is deleted to disrupt Hedgehog signaling. We aimed to determine whether the secretomes of Smo-deficient hepatocytes perpetuate senescence to drive MASLD progression. RNA-Seq analysis of liver samples from human and murine cohorts with MASLD confirmed that hepatocyte populations in MASLD livers were depleted of Smo+ cells and enriched with senescent cells. When fed a choline-deficient, amino acid-restricted high-fat diet (CDA-HFD) to induce MASLD, Smo- mice had lower antioxidant markers and developed worse DNA damage, senescence, steatohepatitis, and fibrosis than did Smo+ mice. Sera and hepatocyte-conditioned medium from Smo- mice were depleted of thymidine phosphorylase (TP), a protein that maintains mitochondrial fitness. Treating Smo- hepatocytes with TP reduced senescence and lipotoxicity, whereas inhibiting TP in Smo+ hepatocytes had the opposite effect and exacerbated hepatocyte senescence, steatohepatitis, and fibrosis in CDA-HFD-fed mice. We conclude that inhibition of Hedgehog signaling in hepatocytes promoted MASLD by suppressing hepatocyte production of proteins that prevent lipotoxicity and senescence.

Keywords: Cell stress; Cellular senescence; Hepatology; Metabolism; Mitochondria.


Conflict of interest statement

Conflict of interest: Funding from a sponsored research agreement with Boehringer-Ingelheim Pharmaceuticals helped to support this work.

Figures

Figure 1
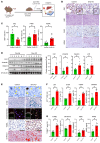
Figure 1. Hepatocyte-specific depletion of Smo (Smo-KO) exacerbates MASLD.
(A) Smofl/fl mice were fed a CDA-HFD diet for 6 weeks. Mice were intravenously injected once with AAV-TBG-Luci or Cre (n = 9 control mice; n = 10 Smo-KO mice). (B) Representative images of staining for Gli2, H&E, F480, and α smooth muscle actin (ASMA) and (C) corresponding densitometric analysis of positively stained areas. Scale bars: 100 μm; original magnification, ×100 (enlarged insets). (D) Expression of the fibrotic and senescence markers Col1, vimentin, desmin, and p16, as detected by immunoblotting and corresponding analysis. (E) Representative images of staining for p21, β-gal, γH2AX (rH2AX), 8OHDG, TUNEL, and Oil Red O and corresponding densitometric analysis of positively stained areas for (F) p21, β-gal, rH2AX, and 8OHDG and (G) TUNEL, Oil Red O, MDA, and 4HNE. Scale bars: 100 μm; original magnification, ×100 (enlarged insets). Data are graphed as the mean ± SEM. *P < 0.05, by 1-way ANOVA.
Figure 2
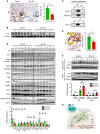
Figure 2. Hepatocyte Smo-KO secretome is depleted of factors that promote antioxidant defense.
Heatmap from proteome profiler analysis in (A) serum of Smo-KO mice and (B) conditioned medium of oleic acid– and palmitic acid–treated Smo-KO primary hepatocytes (n = 3 per group). TP protein expression by (C) immunoblotting (n = 3 per group), (D and E) immunohistochemistry of mouse total liver (n = 5 controls, n = 4 Smo-KO), and (F) ELISA using serum from mice (n = 9 control mice; n = 10 Smo-KO mice). (D) Original magnification, ×10 (low magnification), ×40 (high magnification), and ×100 (insets). (G) Representative images of staining for TP, Nrf2, and HO1 and (H) quantification of the positively stained areas in cells from patients with MASLD versus healthy control cells (n = 3 individuals per group). (G) Original magnification for TP images, ×10 (low magnification), ×40 (high magnification), and ×100 (insets). Original magnification for Nrf2 images, ×20 (low magnification), ×40 (high magnification), and ×100 (insets). Original magnification for HO1 images, ×10 (low magnification), ×40 (high magnification), and ×100 (insets). Data are graphed as the mean ± SEM. *P < 0.05, by 1-way ANOVA.
Figure 3
Figure 3. Hepatocyte Smo-KO induces mitochondrial dysfunction.
(A) Representative images of staining for Nrf2 and quantification of the positively stained areas in liver tissues from Smo-KO versus control mice (n = 5 mice per group). Scale bars: 250 μm. Original magnification, ×100 (enlarged insets). (B) HO1 protein expression in total liver from Smo-KO versus control mice, as determined by immunoblotting (n = 7 mice per group). (C) Interaction between TP, Smo, Nrf2, and HO1 in mouse primary hepatocytes by immunoprecipitation. WB, Western blot. (D) Protein expression of TP, HO1, OXPHOS complexes, SDHA, PDH, PHB1, HSP 60, VDAC, SOD, and cytochrome C by immunoblotting of isolated mitochondria in total liver from Smo-KO mice (n = 7 mice per group). (E) Representative images of staining for PGC1a and quantification of the positively stained areas in liver tissues from Smo-KO versus control mice (n = 9 control mice; n = 10 Smo-KO mice). Scale bars: 60 μm. (F) Immunoblots showing AIF and Smac protein expression in mitochondria or cytoplasm in total liver from Smo-KO and control mice (n = 7 mice per group). *P < 0.05, by 1-way ANOVA. Data are graphed as the mean ± SEM. (G) Hypothetical design.
Figure 4
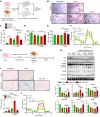
Figure 4. Replenishing TP restores mitochondrial fitness and rescues Smo-depleted hepatocytes from lipotoxicity and senescence.
(A) Experimental scheme. (B and C) Oil Red O staining and (D) percentage of Smo-KO primary hepatocytes by CCK-8 assay. Original magnification, ×200. (E) MDA concentration (conc.) in conditioned media of Smo-KO primary hepatocytes. (F) OCR using the Seahorse extracellular flux analyzer in Smo-KO primary hepatocytes. (G) Experimental scheme. (H) Protein expression by immunoblot assay and corresponding morphometric quantification in siRNA-Smo–transfected Huh7 cells. (I) β-Gal staining and corresponding morphometric quantification in siRNA-Smo–transfected Huh7 cells. Scale bars: 131.4 μm. (J) OCR of siRNA-Smo–transfected Huh7 cells using the Seahorse extracellular flux analyzer. Data from triplicate experiments are graphed and are shown as the mean ± SEM. *P < 0.05, by 1-way ANOVA.
Figure 5
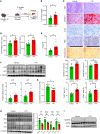
Figure 5. Inhibiting TP exacerbates diet-induced MASH and liver fibrosis in WT mice.
(A) WT mice were fed a CDA-HFD diet for 6 weeks and were intraperitoneally injected with a TPI (tipiracil-HCl) or its vehicle 3 times. (B) Liver/body weight ratio in TPI-treated versus vehicle-treated mice (n = 10 mice per group). (C) Representative images of staining for H&E, Oil Red O, Picrosirius red, F480, β-gal and corresponding densitometric analysis of positively stained areas. Scale bars: 100 μm (H&E-, F480-, and Picrosirius red–stained images) and 50 μm (Oil Red O– and β-gal–stained images). Serological results of hepatic function markers (D) ALT and AST and (E) HOMA-IR (n = 10 mice per group). (F) Expression of the senescence markers p16 and p21 detected in total liver from TPI-treated mice, as detected by immunoblotting (n = 7 mice per group). (G) Concentration of TP in serum from vehicle- and TPI-treated mice (n = 10 mice per group). (H) Protein expressions of TP, Smo, Nrf2, and HO1 detected in total liver from TPI-treated mice, as detected by immunoblotting (n = 7 mice per groups). (I) Expression of the mitochondrial OXPHOS complex markers NDUFB8 and ATP5A detected in total liver mitochondria from vehicle- or TPI-treated mice, as detected by immunoblotting (n = 7 mice per group). Data are graphed as the mean ± SEM. *P < 0.05, by 1-way ANOVA.

References

    1. Fahed G, et al. Metabolic syndrome: updates on pathophysiology and management in 2021. Int J Mol Sci. 2022;23(2):786. doi: 10.3390/ijms23020786. - DOI - PMC - PubMed
    1. Eslam M, et al. Metabolic (dysfunction)-associated fatty liver disease in individuals of normal weight. Nat Rev Gastroenterol Hepatol. 2022;19(10):638–651. doi: 10.1038/s41575-022-00635-5. - DOI - PubMed
    1. Liu Y, et al. Nonalcoholic fatty liver disease and mortality from all causes, cardiovascular disease, and cancer: a meta-analysis. Sci Rep. 2019;9(1):11124. doi: 10.1038/s41598-019-47687-3. - DOI - PMC - PubMed
    1. Bertolotti M, et al. Nonalcoholic fatty liver disease and aging: epidemiology to management. World J Gastroenterol. 2014;20(39):14185–14204. doi: 10.3748/wjg.v20.i39.14185. - DOI - PMC - PubMed
    1. Zhang L, et al. Cellular senescence: a key therapeutic target in aging and diseases. J Clin Invest. 2022;132(15):e158450. doi: 10.1172/JCI158450. - DOI - PMC - PubMed