. 2025 Jul 1;82(1):165-183.
doi: 10.1097/HEP.0000000000001066. Epub 2024 Aug 27.

A functional genomic framework to elucidate novel causal metabolic dysfunction-associated fatty liver disease genes

Affiliations

A functional genomic framework to elucidate novel causal metabolic dysfunction-associated fatty liver disease genes

Peter Saliba-Gustafsson et al. Hepatology. .

Abstract

Background and aims: Metabolic dysfunction-associated fatty liver disease (MASLD) is the most prevalent chronic liver pathology in western countries, with serious public health consequences. Efforts to identify causal genes for MASLD have been hampered by the relative paucity of human data from gold standard magnetic resonance quantification of hepatic fat. To overcome insufficient sample size, genome-wide association studies using MASLD surrogate phenotypes have been used, but only a small number of loci have been identified to date. In this study, we combined genome-wide association studies of MASLD composite surrogate phenotypes with genetic colocalization studies followed by functional in vitro screens to identify bona fide causal genes for MASLD.

Approach and results: We used the UK Biobank to explore the associations of our novel MASLD score, and genetic colocalization to prioritize putative causal genes for in vitro validation. We created a functional genomic framework to study MASLD genes in vitro using CRISPRi. Our data identify VKORC1 , TNKS , LYPLAL1 , and GPAM as regulators of lipid accumulation in hepatocytes and suggest the involvement of VKORC1 in the lipid storage related to the development of MASLD.

Conclusions: Complementary genetic and genomic approaches are useful for the identification of MASLD genes. Our data supports VKORC1 as a bona fide MASLD gene. We have established a functional genomic framework to study at scale putative novel MASLD genes from human genetic association studies.


Conflict of interest statement

Johanne M. Justesen is employed by Novo Nordisk. Joshua W. Knowles consults for Arrowhead and Mammoth. The remaining authors have no conflicts to report.

Figures

None
Graphical abstract
FIGURE 1
FIGURE 1
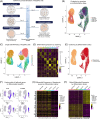
Human molecular genetic analyses in the UK Biobank. Nonmoderately or moderately drinking European ancestry British participants were selected for the analyses. (A) receiver operating characteristic curve showing the predictive power of MASLD-S and individual biochemical and anthropometric variables on MASLD status as defined by liver fat >5.5% in UK biobank. (B) Manhattan plot for the genome-wide association study on MASLD defined as >5.5% liver fat in UK biobank. (C) Genome-wide association study on MASLD score in UK biobank, visualized using a Manhattan plot. (D) ALT associations from the genome-wide association study in UK biobank, visualized by a Manhattan plot. (E) Q-Q plot for the genome-wide association studies on ALT, MASLD, and MASLD score, plotted together to visualize the differences in significance obtained. y-axes in Manhattan plots are scaled for comparison between the 3 association studies. Abbreviations: BMI, body mass index; FLI, fatty liver index; MASLD, metabolic dysfunction–associated fatty liver disease; MASLD-S, metabolic dysfunction–associated fatty liver disease-score; TG, triglycerides; UKB, UK Biobank.
FIGURE 2
FIGURE 2
Colocalization study of MASLD-S–associated SNPs in the UK Biobank. (A) Strategy for genetic colocalization studies to infer causality of novel putative MASLD genes found from genome-wide association studies with metabolically active tissues in the GTEx (v8) database. Liver enzymes include ALT, ALP, GGT and qnormALT_UKB, MRI/ML MRI_UKB and machine learning MRI, MASLD-S out novel MASLD score, and the MASLD score from Miao and colleagues. (B) Overlap of genes with a significant liver eQTL/sQTL colocalization. GSEA gene set enrichment analysis of colocalized genes can be found in Table 2. Full list of colocalizations can be found in Supplemental Table S5, http://links.lww.com/HEP/I624. Abbreviations: cALT, chronic ALT (Alanine Transaminase); ML, machine learning; QTL, quantitative trait locus.
FIGURE 3
FIGURE 3
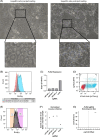
Characterization of a HepaRG model system that is genetically engineered to allow for CRISPRi gene-editing. (A) Description of HepaRG culturing, indicating at which point scRNA-seq was used to characterize the model system. (B) Clustering by both genotype and differentiation stage (temporal analysis along the differentiation axis). Data demonstrate that cells efficiently differentiate regardless of genotype (dCas9-KRAB integration) and that cells remain in their differentiated phenotype two weeks after differentiation is complete. This allows for gene editing after complete HepaRG differentiation. (C) Clustering of scRNA-seq data, where proliferative and differentiated cells are plotted together, irrespective of genotype (dCas9-KRAB integration). Data show 11 different clusters divided over two distinct populations of cells. (D) Differential gene expression analyses based on clustering in B. Clusters 1, 3, and 5 belong to undifferentiated cells, whereas the remaining clusters belong to the differentiated HepaRG cells; genes involved in drug-metabolizing pathways, lipid metabolism, hemostasis, and albumin were significantly upregulated in differentiated cells, particularly in clusters 0, 2, 4, 6 and 9. Lists for differentially expressed genes can be found in Supplemental Table S6, http://links.lww.com/HEP/I624. (E) Clustering by differentiation status irrespective of genotype. Data demonstrate a perfect clustering of HepaRG cells by their differentiation status. (F) Expression of hepatocyte hallmark genes ALB, CYP3A5, HP-1, and DPP4. Data show an upregulation of these genes on differentiation. (G) Differential expression analyses of genes suggested to define hepatocytes from “the human liver atlas.” Data show that the transcriptional program thought to define hepatocytes is enhanced on differentiation. (H) Global differential expression analyses by differentiation status. Genes upregulated by differentiation are enriched in processes related to small molecule and lipid metabolic processes, mitochondrial processes, and electron transport chain (Supplemental Table S10, http://links.lww.com/HEP/I624). Complete lists of differentially expressed genes can be found in Supplemental Table S7, http://links.lww.com/HEP/I624. Abbreviations: scRNA, single-cell RNA sequencing; UMAP, uniform manifold approximation and projection.
FIGURE 4
FIGURE 4
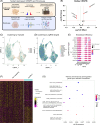
Establishment of, and control experiments in a HepaRG cell CRISPRi gene-editing model system with lipid accumulation as readout. (A) Micrographs showing that lipid loading using 400 µM of oleic acid results in significant formation of large lipid droplets. (B) Lipid loaded HepaRG cells were stained with 1 µg/mL Bodipy and analyzed using flow cytometry. Data show that lipid loading (blue histogram) increases the content of neutral lipids within the HepaRG cell compared to non-loaded control cells (red histogram). (C) PLIN2 was knocked down as a proof-of-principle experiment. PLIN2 expression was efficiently silenced in our dCas9-KRAB expressing HepaRG cells, and sgRNAs from the v2 Weissman library. (D) Representative gates for sorting gene-edited HepaRG cells (blue), and an untransduced control, negative for both mCherry and BFP (red). The Q2 gate contains the gene-edited cells, which express dCas9-KRAB and have been efficiently transduced with sgRNAs. (E) Gene-edited HepaRG cells from Q2 were sorted based on their Bodipy content; approximately the top and bottom 18% of cells were sorted, and gDNA was prepared from both extreme populations. gDNA was then sequenced using NGS. (F–G) By assessing the enrichment of PLIN2 sgRNAs in the cell population with the least intracellular lipids, we find a 2–3 times enrichment of PLIN2 sgRNAs compared to nontargeting sgRNAs. As one would expect, these data demonstrate hampered lipid accumulation in HeapRG cells that do not express PLIN2. The casTLE pipeline was also piloted for this purpose, and analyzed data recapitulates simple sgRNA counting and fold change calculations in that we show a 2 times enrichment of PLIN2 sgRNAs in the least lipid-laden cells compared to what one would expect by chance. Data show that the model system can provide useful information on the effect of genes on lipid accumulation in HepaRG cells, and show that appropriate analysis methods are employed. Abbreviation: sgRNA, small guide RNA.
FIGURE 5
FIGURE 5
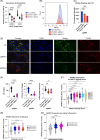
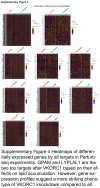
Tandem lipid-based CRISPRi and Perturb-seq in HepaRG cells to explore the involvement of genes, suggested by human molecular genetics, in MASLD pathogenesis. (A) Experimental outline of tandem CRISPRi and Perturb-seq in HepaRG cells. HepaRG cells were harvested on day 42 of culturing, as per the protocol described in Figure 3A. (B) Volcano plot, following sequencing of gDNA in the most and least lipid-laden HepaRG cells, where casTLE effect and score are plotted against each other. Data demonstrate that the knockdown of VKORC1 and TNKS results in less intracellular lipids. Conversely, the knockdown of genes GPAM and LYPLAL1 increases intracellular lipids. (C, D) Perturb-seq is performed in parallel to our lipid accumulation-based CRISPRi to explore the transcriptomic profiles resulting from a gene knockdown. No major changes in the clustering of gene-edited cells by replicate and sgRNA identity is observed. Data show that replicates are very similar, and sgRNAs have modest effects on the transcriptome that causes the cells to cluster separately. (E) Dotplot is visualizing that the knockdown of sgRNAs targeting the selected genes is efficient and specific as demonstrated by the blue dots along the diagonal. (F, G) Differential gene expression analyses on VKORC1 knockdown are carried out using the scMaGeCK R-package, and differentially expressed genes are plotted in a representative heatmap. Results reveal that VKORC1 knockdown changes the transcriptional landscape, and reduces the gene expression of genes involved in lipid metabolism, Golgi and ER, as well as homeostatic processes. Complete results of differentially expressed genes for all perturbations can be found in Supplemental Figure S4, http://links.lww.com/HEP/I628, and Supplemental Table S8, http://links.lww.com/HEP/I624. Abbreviations: sgRNA, small guide RNA; UMAP, uniform manifold approximation and projection.
FIGURE 6
FIGURE 6
Validation experiments of VKORC1 knockdown in differentiated HepaRG cells and the relationship between VKORC1 transcript and human disease. (A) Single sgRNA knockdown of VKORC1 in differentiated HepaRG cells results in a significant knockdown of the VKORC1 transcript as measured by qPCR. Concomitant with VKORC1 knockdown, we demonstrate a significant downregulation of the PLIN2 transcript. (B, C) VKORC1 knockdown results in the reduction of intracellular neutral lipids by Bodipy staining and flow cytometric analysis. (D, E) Confocal microscopy of HepaRG cells on VKORC1 knockdown shows a significant reduction in Bodipy neutral lipid staining, lipid droplet number, lipid droplet area, and PLIN2 positive area. (F–H) By exploring VKORC1 expression levels in different stages of human disease we demonstrate an upregulation of the VKORC1 transcript in livers of a higher degree of metabolic dysfunction–associated fatty liver disease activity score, steatsis, and inflammation. N for experimental data is 6–7 replicates, Ordinary one-way ANOVA was performed to compare the nontargeting sgRNA with the VKORC1 targeting sgRNAs. Total n for human liver samples is 78. * p<0.05, ** p<0.01, ***p<0.001, ****p<0.0001. Abbreviations: KD, knockdown; LD, lipid droplet; NT, non-targeting; qPCR, quantitative polymerase chain reaction; sgRNA, small guide RNA.
None
None
None
None
None
None
None
None

Update of

References

    1. Shang Y, Nasr P, Widman L, Hagström H. Risk of cardiovascular disease and loss in life expectancy in NAFLD. Hepatology. 2022;76:1495–505. - PMC - PubMed
    1. Duell PB, Welty FK, Miller M, Chait A, Hammond G, Ahmad Z, et al. Nonalcoholic fatty liver disease and cardiovascular risk: A scientific statement from the American Heart Association. Arterioscler Thromb Vasc Biol. 2022;42:e168–85. - PubMed
    1. Mancina RM, Sasidharan K, Lindblom A, Wei Y, Ciociola E, Jamialahmadi O, et al. PSD3 downregulation confers protection against fatty liver disease. Nat Metab. 2022;4:60–75. - PMC - PubMed
    1. Sveinbjornsson G, Ulfarsson MO, Thorolfsdottir RB, Jonsson BA, Einarsson E, Gunnlaugsson G, et al. Multiomics study of nonalcoholic fatty liver disease. Nat Genet. 2022;54:1652–63. - PMC - PubMed
    1. Chen Y, Du X, Kuppa A, Feitosa MF, Bielak LF, O’Connell JR, et al. Genome-wide association meta-analysis identifies 17 loci associated with nonalcoholic fatty liver disease. Nat Genet. 2023;55:1640–50. - PMC - PubMed