. 2024 Sep 26;64(3):2302171.
doi: 10.1183/13993003.02171-2023. Print 2024 Sep.

CD94+ natural killer cells potentiate pulmonary ischaemia-reperfusion injury

Affiliations

CD94+ natural killer cells potentiate pulmonary ischaemia-reperfusion injury

Tasha Tsao et al. Eur Respir J. .

Abstract

Background: Pulmonary ischaemia-reperfusion injury (IRI) is a major contributor to poor lung transplant outcomes. We recently demonstrated a central role of airway-centred natural killer (NK) cells in mediating IRI; however, there are no existing effective therapies for directly targeting NK cells in humans.

Methods: We hypothesised that a depleting anti-CD94 monoclonal antibody (mAb) would provide therapeutic benefit in mouse and human models of IRI based on high levels of KLRD1 (CD94) transcripts in bronchoalveolar lavage samples from lung transplant patients.

Results: We found that CD94 is highly expressed on mouse and human NK cells, with increased expression during IRI. Anti-mouse and anti-human mAbs against CD94 showed effective NK cell depletion in mouse and human models and blunted lung damage and airway epithelial killing, respectively. In two different allogeneic orthotopic lung transplant mouse models, anti-CD94 treatment during induction reduced early lung injury and chronic inflammation relative to control therapies. Anti-CD94 did not increase donor antigen-presenting cells that could alter long-term graft acceptance.

Conclusions: Lung transplant induction regimens incorporating anti-CD94 treatment may safely improve early clinical outcomes.


Conflict of interest statement

Conflict of interest: R. Shi, L. Bai, K. Dilley, M. Will, N. Tomasevic, T. Sputova, A. Salles and J. Kang are employees and shareholders of Dren Bio, Inc. N. Tomasevic is a founder and holds a management position at Dren Bio, Inc. M. Will holds a management position at Dren Bio, Inc. L.L. Lanier is a consultant for Dren Bio, Inc. The authors have no additional conflicts of interest to disclose.

Figures

Figure 1.
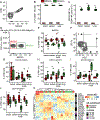
Figure 1.. Bronchoalveolar lavage RNA sequencing screen of potential NK cell targets.
RNA sequencing was performed on BAL collected on the 1st postoperative day after lung transplantation in recipients with severe PGD (n = 20) and those without PGD (n= 18). We generated a random forest model using 18 NK cell genes as predictors of severe PGD with leave one out validation. (A) Receiver operator curve demonstrating the test characteristics of the model. (B) Relative feature importance of each of the 18 NK cell genes. (C) Transcript counts of KLRD1, the top feature in the model, stratified by PGD status. (D) Cumulative incidence plot of discharge from the intensive care unit (ICU) for recipients stratified by high BAL KLRD1 gene transcript counts and PGD status. Box and whisker plots are bound by 25th and 75th percentile with boxes bisected by the median. Comparisons of gene counts were made with Mann-Whitney U test. Difference in time to ICU discharge was assessed with Cox Proportional Hazards model, displaying log-rank p value.
Figure 2.
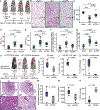
Figure 2.. Mouse CD94+ NKG2A+ NK cell profiles.
To determine the NK cell expression of CD94 and NKG2A in C57BL/6 mice, several tissues were collected and characterized by spectral flow cytometry. (A) NK cells (CD3-CD19-F4/80-NKp46+) expressing CD94 co-express NKG2A in a 1:1 ratio. (B) The percentage of NKG2A expression on CD94+ cells is increased across blood, spleen, and lung NK cells. (C) In CD94+ NK cells, NKG2A mean fluorescence intensity is increased on CD94+ NK cells (D) Representative contour plots of NKG2A gates. (E) NKG2A+ NK cells constitute 40–50% of the NK cell population in blood, spleen, lymph node, and lung. (F) As indicated by arrow directionality, NK cell maturation is defined by acquisition of CD27, gain of CD11b, and finally loss of CD27 [55]. We assessed differences in NKG2A across the four NK cell maturation states: (G), CD11b-CD27- (H) CD11b-CD27+ (I), CD11b+CD27+ and (J) CD11b+CD27-. (K) We assessed additional activation, chemotaxis, and tissue-resident markers and show differences in MFI in a heatmap. Experiments in B&C studied 5 mice for each condition and other experiments show 10 mice. Box and whisker plots display individual data points bound by boxes at 25th and 75th percentiles and medians depicted with bisecting lines. Differences were assessed using the Mann-Whitney U test with Benjamini-Hochberg corrections for multiple comparisons and paired testing for comparisons within individual animals. P values; * <0.05, ** <0.01, *** <0.001.
Figure 3.
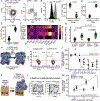
Figure 3.. NKG2A+ NK cells in pulmonary ischemia-reperfusion injury.
We identified differences during IRI in the NKG2A+ populations. (A) We performed warm ischemia reperfusion injury with the hilar clamp model. A slip knot (HC, n = 7) or a sham suture (sham, n = 7) was tied around the left hilum and released 2 hours later, followed by 4 hours of reperfusion before the mice were euthanized. (B) There was an increase in percentage of NKG2A+ NK cells in the lungs following hilar clamp. (C) Representative contour plots of CD49a in NKG2A+ NK cells. (D) CD49a was increased on NKG2A+ NK cells in the lung following HC. (E) Representative contour plots of DNAM1 in NKG2A+ NK cells (F) Of the NKG2A+ NK cell population, lungs that underwent hilar clamp have an increased percentage of DNAM1. (G) Representative contour plots of KLRG1 in NKG2A+ NK cells (H) There was no difference in expression of KLRG1 between conditions. Experiments studied 5 mice for each condition. Box and whisker plots display individual data points bound by boxes at 25th and 75th percentiles and medians depicted with bisecting lines. Differences were assessed using the Mann-Whitney U test with p<0.05 considered significant.
Figure 4.
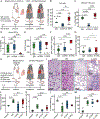
Figure 4.. Lung and bronchoalveolar lavage NK cells are reduced with anti-CD94 treatment.
(A) C57BL/6 mice underwent sham procedures (n = 5) or were treated with 10 mg/kg of anti-CD94 antibody (n = 6) or isotype-matched control IgG (n = 5) at 7 days and 1 day prior to HC procedures. (B) Representative contour plots of NK cells (CD3-CD19-F4/80-NKp46+) across conditions. (C) Percentages of lung NK cells were increased during HC in the isotype-matched IgG-treated group and decreased with anti-CD94 treatment. (D) Absolute bronchoalveolar lavage NK cells were reduced with anti-CD94 treatment. (E) Absolute bronchoalveolar lavage CD49a+ NK cells. (F). CD8+ T cells in the lung across the conditions. (G) Percentage of γδ T cells in the lung. (H) Representative contour plots of NKG2A+ NK cells in the lung across the 3 conditions. (I) Percentage of lung NKG2A+ NK cells. (J) Percentage of NKG2A+ lymphocytes in the lung across the conditions. Box and whisker plots display individual data points bound by boxes at 25th and 75th percentiles and medians depicted with bisecting lines. Differences were assessed using the Mann-Whitney U test with Benjamini-Hochberg correction for multiple comparisons with p<0.05 considered significant.
Figure 5.
Figure 5.. CD94-based NK cell depletion reduces lung ischemia-reperfusion injury.
(A) Mice underwent sham procedures or received intraperitoneal anti-CD94 antibody (αCD94) or isotype-matched control antibody (IgG) 7 days and 1 day preceding hilar clamp. (B) H&E staining of representative lungs (n = 3 per condition). Quantitative injury metrics were collected for each condition and displayed as (C) partial pressure of oxygen in arterial blood, (D) extravascular lung water, (E) extravascular plasma equivalents, (F) gamma counts of I125-albumin per gram of dry lung, and (G) endothelial permeability. PaO2 experiments show sham-treated (n=5), IgG (n = 6) and anti-CD94-treated mice (n = 6) whereas other metrics display sham-treated (n = 6), IgG (n = 8), and anti-CD94-treated mice (n = 9). (H) H2d C57BL/6 donor and H2b C56BL/6 recipient mice were treated with intraperitoneal isotype-matched IgG control antibody (IgG, n = 5) or anti-CD94 antibody (αCD94, n = 5) 24 hours preceding the donor lung procurement. H2d C57BL/6 donor lung was subjected to 4 hours of cold ischemia before orthotopic lung transplant into a C57BL/6 recipient. (I) NK cells as a percentage of total lymphocytes in the lung were decreased with treatment. (J) NKG2A+ NK cells in the lung were depleted. (K) NKG2A+ lymphocytes in the lung were depleted. (L) Representative H&E staining of representative lungs (n = 5). We assessed injury via (M) quantitative pathology score, (N) BAL protein, and (O) PaO2. Box and whisker plots display individual data points bound by boxes at 25th and 75th percentiles and medians depicted with bisecting lines. Differences were assessed using the Mann-Whitney U test with Benjamini-Hochberg correction for multiple comparisons with p<0.05 considered significant.
Figure 6.
Figure 6.. Human lung transplant recipient PBMCs treated with anti-CD94 results in NK cell depletion and reduced in vitro IRI.
(A) NK cells, and CD4 and CD8 T cells were quantified with flow cytometry from lung transplant recipient PBMC (n = 5). CD94 was quantified on PBMCs with plots showing: (B) histograms for NK and T cells, (C) CD8 T cells, and (D) NK cells. NK cell CD94 expression was quantified in BAL from lung transplant recipients with (n = 5) and without PGD (n = 7). (E) NK cells in the BAL have high frequency of CD94 expression. (F) Heatmap of NK cell marker MFI differences between CD94hi and CD94low (or negative) NK cells from patients with and without PGD. (G) Differences in NKG2D MFI values shown by boxplots. (H) In vitro depletion of NK cells from lung transplant whole PBMC was performed. (I) Representative contour plots from isotype-matched control IgG-treated and anti-CD94 (αCD94)-treated PBMCs treated at 0.1ug/ul. (J) Percentages of NK cells are shown relative to IgG control across different anti-CD94 concentrations (K) To assess cytotoxicity, airway epithelial cells were subjected to hypoxia (1% O2) for 24 hours and then co-cultured with PBMCs treated with control IgG or anti-CD94 antibody for an additional 24 hours. Airway epithelial cells are stained with CellTrace Violet prior to plating to distinguish PBMCs from epithelial cells during flow cytometry analysis. (L) Representative contour plots of viability in co-culture across 2 conditions at 2:1 PBMC to epithelial ratio. (M) Killing plots of airway epithelial cells across the 2 conditions. Box and whisker plots display individual data points bound by boxes at 25th and 75th percentiles and medians depicted with bisecting lines. Differences were assessed using the Mann-Whitney U test. P values; * p<0.05, ** p <0.01, and *** p <0.001.
Figure 7.
Figure 7.. CD94-based NK cell depletion in the allogeneic orthotopic lung transplant model
(A) CD45.1 C57BL/6 mice were treated with intraperitoneal isotype-matched IgG control antibody (IgG, n = 5), anti-CD94 antibody (αCD94, n = 4), or IL-15-IL-15 receptor complex (IL15RC, n = 4) 1-hour preceding orthotopic lung transplant with minimal warm ischemia from a BALB/c donor. We measured lung allograft (B) total NK cells, (C) NKG2A+ NK cells, (D) donor APCs. Injury was quantified by (E) PaO2, (F) BAL protein, and (G) plasma cell-free DNA. (H) We also assessed chronic injury on post-operative day 14 in isografts (n = 4) and allograft recipients pre-treated with intraperitoneal isotype-matched IgG control antibody (IgG, n = 4), anti-CD94 antibody (αCD94, n = 4), or IL-15-IL-15 receptor complex (IL15RC, n = 3) 1-hour preceding orthotopic lung transplant with minimal warm ischemia from a BALB/c donor. (I) Representative H&E slide sections from each group. We assessed pathologic injury via (J) median nuclei per high powered field (hpf), (K) median nuclei surrounding the airways per square millimeter, (L) airway patency, and (M) pleural thickness. Box and whisker plots display individual data points bound by boxes at 25th and 75th percentiles and medians depicted with bisecting lines. Comparisons across experimental groups were made with the Kruskal Wallis test. Differences were assessed using the Mann-Whitney U test with Benjamini-Hochberg correction for multiple comparisons with p<0.05 considered significant.

References

    1. Valapour M, Lehr CJ, Schladt DP et al. OPTN/SRTR 2021 Annual Data Report: Lung. Am J Transplant 2023;23(2 Suppl 1):S379–s442. - PMC - PubMed
    1. Diamond JM, Lee JC, Kawut SM et al. Clinical risk factors for primary graft dysfunction after lung transplantation. Am J Respir Crit Care Med 2013;187(5):527–534. - PMC - PubMed
    1. Snell GI, Yusen RD, Weill D et al. Report of the ISHLT Working Group on Primary Lung Graft Dysfunction, part I: Definition and grading; A 2016 Consensus Group statement of the International Society for Heart and Lung Transplantation. J Heart Lung Transplant 2017;36(10):1097–1103. - PubMed
    1. Kolaitis NA, Gao Y, Soong A et al. Primary graft dysfunction attenuates improvements in health-related quality of life after lung transplantation, but not disability or depression. Am J Transplant 2021;21(2):815–824. - PubMed
    1. Paraskeva MA, Borg BM, Paul E et al. Abnormal one-year post-lung transplant spirometry is a significant predictor of increased mortality and chronic lung allograft dysfunction. J Heart Lung Transplant 2021;40(12):1649–1657. - PubMed

Substances