. 2024 Sep 5;84(17):3209-3222.e5.
doi: 10.1016/j.molcel.2024.08.013. Epub 2024 Aug 26.

RNA polymerases reshape chromatin architecture and couple transcription on individual fibers

Affiliations

RNA polymerases reshape chromatin architecture and couple transcription on individual fibers

Thomas W Tullius et al. Mol Cell. .

Abstract

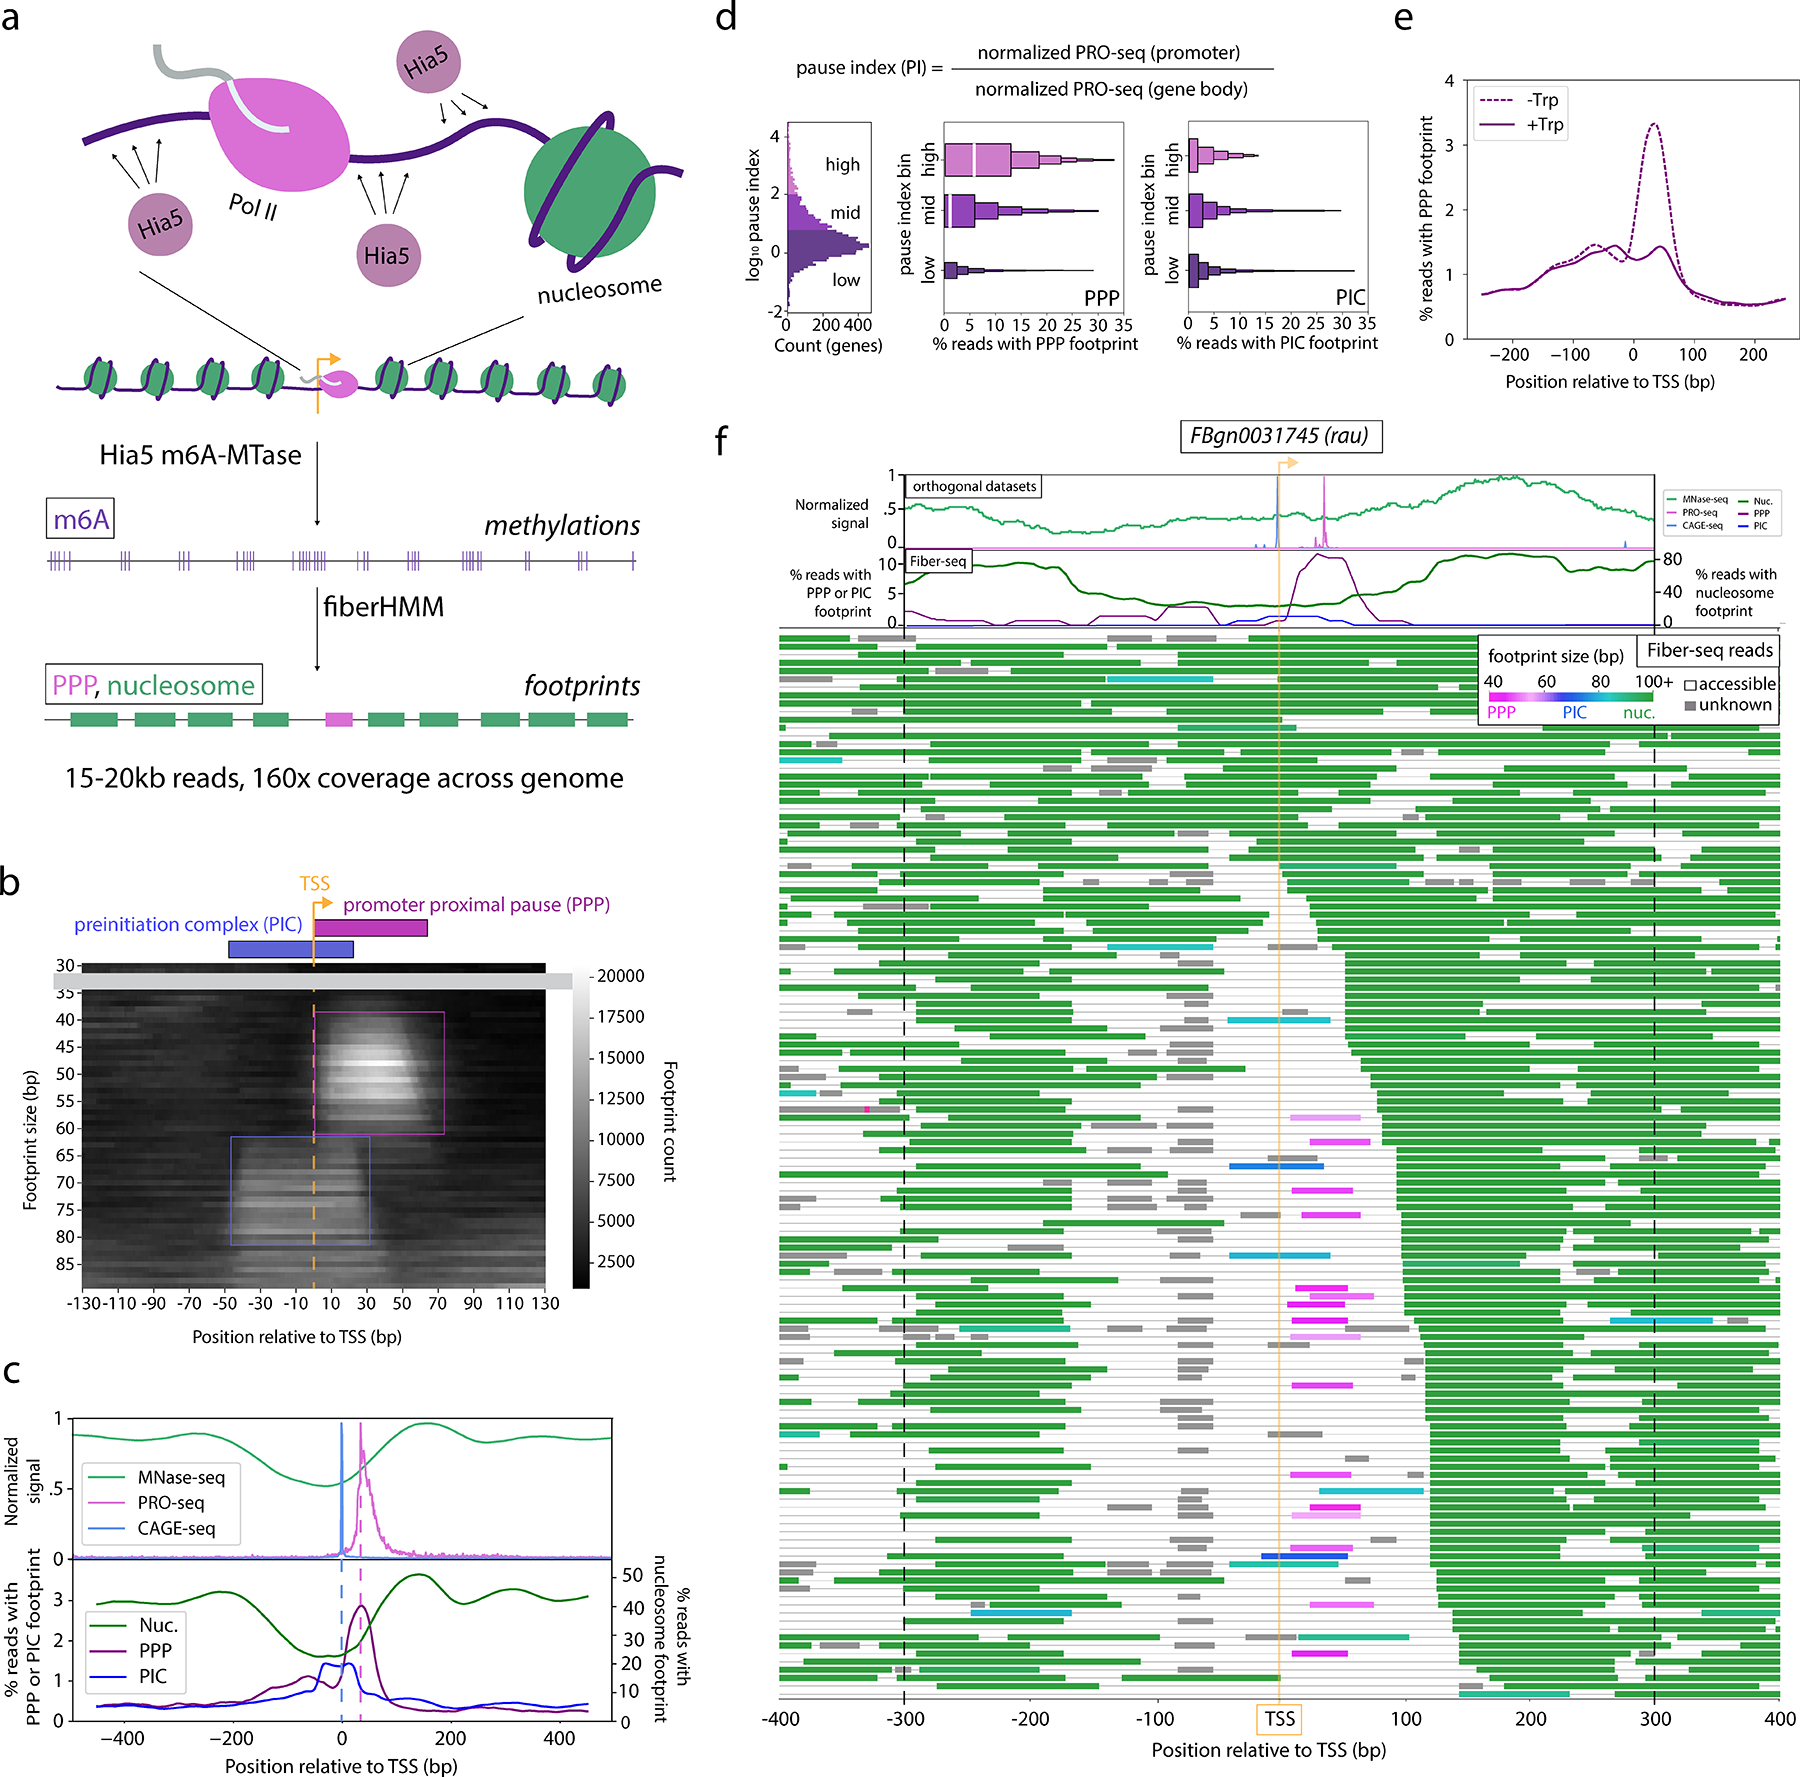
RNA polymerases must initiate and pause within a complex chromatin environment, surrounded by nucleosomes and other transcriptional machinery. This environment creates a spatial arrangement along individual chromatin fibers ripe for both competition and coordination, yet these relationships remain largely unknown owing to the inherent limitations of traditional structural and sequencing methodologies. To address this, we employed long-read chromatin fiber sequencing (Fiber-seq) in Drosophila to visualize RNA polymerase (Pol) within its native chromatin context with single-molecule precision along up to 30 kb fibers. We demonstrate that Fiber-seq enables the identification of individual Pol II, nucleosome, and transcription factor footprints, revealing Pol II pausing-driven destabilization of downstream nucleosomes. Furthermore, we demonstrate pervasive direct distance-dependent transcriptional coupling between nearby Pol II genes, Pol III genes, and transcribed enhancers, modulated by local chromatin architecture. Overall, transcription initiation reshapes surrounding nucleosome architecture and couples nearby transcriptional machinery along individual chromatin fibers.

Keywords: Fiber-seq; RNA Pol II; RNA Pol III; chromatin; nucleosome; promoter proximal pausing; single-molecule; transcription initiation.


Conflict of interest statement

Declaration of interests A.B.S. is a co-inventor on a patent relating to the Fiber-seq method (US17/995,058).

Figures

Figure 1:
Figure 1:. Identification of Pol II footprints in Fiber-seq
(a) Schematic of Fiber-seq. (From top to bottom) Drosophila S2 cells were treated with Hia5 m6A methyltransferase and then sequenced using PacBio SMRT sequencing, directly detecting the methylated bases using Fibertools. Unmethylated footprints were called using FiberHMM, resulting in ~15–20 kb footprinted Fiber-seq reads. (b) Heatmap depicting the enrichment of differently sized Fiber-seq footprints around transcription start sites (TSSs) of genes with a pause index ≥10. The expected position of the PPP and PIC are schematized above, and PPP and PIC footprint populations are indicated with a box. (c) Plot depicting (top) normalized MNase-seq, PRO-seq, and CAGE-seq signal and (bottom) the percent occupancy of nucleosome-, PPP-, and PIC-sized footprints at positions around TSSs of genes with a pause index ≥10. Dashed lines indicate CAGE-seq and PRO-seq peaks. (d) (left) Histogram of the distribution of pause indexes of all genes, binned as follows: “high” (PI ≥ 100), “mid” (100 > PI ≥ 10), “low” (10 > PI). Boxenplots showing the enrichment of (center) PPP and (right) PIC footprints in binned Fiber-seq reads. (e) Plot showing the percent occupancy of PPP-sized footprints in cells untreated (dashed) or treated for 30 minutes with 10 μM triptolide (solid). (f) Example Fiber-seq reads. (above) MNase-seq, PRO-seq, and CAGE-seq signal, and (middle) enrichment of nucleosome-, PPP-, or PIC-sized footprints. (below) Individual Fiber-seq reads with footprints colored by predicted identity (PPP = pink, PIC = blue, nucleosome = green, unknown = gray, black line = no footprint).
Figure 2:
Figure 2:. Pausing drives changes to downstream nucleosomes
(a) Fiber-seq reads from a low pause index gene and (b) a high pause index gene, with footprints colored by predicted identity (PPP = pink, PIC = blue, nucleosome = green, unknown = gray, black line = no footprint). (c) (Top) Plot showing the percent occupancy of nucleosome footprints in reads with an accessible TSS from genes binned by pause index: “high” (PI ≥ 100), “mid” (100 > PI ≥ 10), “low” (10 > PI). (Bottom) Plot showing the percent occupancy of nucleosome footprints from promoter-accessible reads with (solid) or without (dashed) a PPP footprint, sampled to include an equal count of reads with or without a PPP footprint from each gene. (d) Boxplot showing the position of nucleosomes relative to the TSS between accessible and sampled reads with (dashed) or without (solid) a PPP footprint. Nucleosomes were segmented using a Gaussian mixture model (GMM) based on a 95% posterior probability, with distributions compared with a two-sample t-test (n.s. signifies p > 0.05, *** signifies p-value < 10−13). (e) Boxplot showing the size of nucleosomes from reads with (dashed) or without (solid) a PPP footprint. Distributions were compared using a two-sample t-test (n.s. signifies p>0.05, *** signifies p-value < 10−14). (f) Barplot showing the relative percentage of absent nucleosome footprints in reads with a PPP footprint and reads without a PPP footprint. Errorbars represent the confidence interval derived from the bootstrapped distribution of the ratio of reads with or without a each nucleosome footprint in reads with or without a PPP footprint. (g) Cartoon summarizing the changes to nucleosome position and stability associated with the PPP. (h) Sample of Fiber-seq reads from a representative locus, with footprints colored by predicted identity (PPP = pink, PIC = blue, nucleosome = green, unknown = gray). Reads with a shifted +1 nucleosome, defined as starting between 70 and 150 bp downstream of the TSS, are indicated with a line. (i, h) Boxplots showing the distance to the +1 nucleosome footprint across reads with (j) or without (h) a PPP footprint. Reads are binned by pause index, indicated in the adjacent histogram: “high” (pink, PI ≥ 100), “mid” (purple, 100 > PI ≥ 10), “low” (dark purple, 10 > PI). Distances from −Trp and +Trp samples are plotted in color in gray respectively. Significance is indicated between +Trp and −Trp pairs (two-sample t-test, n.s. signifies p>0.05, * signifies p < 0.05, ** signifies p < 0 .01, *** signifies p < 0.0001). (k) Barplot showing the fold enrichment of elongating Pol II footprints within gene bodies over intergenic regions, divided into reads with no PPP and no shifted +1 nucleosome (top), a PPP and a shifted +1 nucleosome (middle), or no PPP and a shifted +1 nucleosome (bottom). Pairwise significance between bins is indicated (two-sample t-test, n.s. signifies p > 0.7, * signifies p-value < 0.03, ** signifies p-value < 0.007).
Figure 3:
Figure 3:. Pausing sterically inhibits initiation
(a) Sample Fiber-seq reads from a locus with simultaneous PPP and PIC footprints, with footprints colored by predicted identity (PPP = pink, PIC = blue, nucleosome = green, unknown = gray, black line = no footprint). (top) Corresponding PRO-seq (pink) and CAGE-seq (blue) signal. (b) Bar plot, showing the Fisher’s exact test odds ratio of PPP and PIC footprint co-occupancy on a single read. Genes are binned based on the distance between their primary PRO-seq and CAGE-seq peaks. Significance is indicated above (Fisher’s exact test, n.s. signifies p > 0.05, * signifies p-values from p < 0.05 to p < 10−25).
Figure 4:
Figure 4:. Transcription initiation is coupled based on proximity
(a) Sample Fiber-seq reads illustrating co-accessibility and PPP/PIC co-occupancy at two loci. Fiber-seq footprints are colored by predicted identity (PPP = pink, PIC = blue, nucleosome = green, unknown = gray, black line = no footprint).. (b) Barplot showing the Fisher’s exact test odds ratio of PPP/PIC footprint co-occupancy on reads overlapping promoter pairs binned by distance. Significance is indicated above. (Fisher’s exact test, n.s. signifies p > 0.05, * signifies p-values from p < 0.001 to p < 10−12). (c) Barplot showing the Fisher’s exact test odds ratio of PPP/PIC footprint co-occupancy on reads overlapping enhancer-promoter pairs binned by distance. Significance is indicated above the plot. (Fisher’s exact test, n.s. signifies p>0.05, * signifies p-values ranging from p < 0.001 to p < 10−9). (d) Barplot depicting the Fisher’s exact test odds ratio of PPP/PIC footprint co-occupancy on reads overlapping genes in different or the same topologically associating domain (TAD). Error bars correspond to the confidence interval calculated from 10,000x sampling iterations. Pairwise (two-sample t-test, **** signifies p-value < 10−193) and individual (Mean of sample Fisher’s exact test results, n.s. signifies p > 0.05, * signifies p < .05) significance is indicated above. (e) (bottom) Fiber-seq reads overlapping a SuHW binding site, with footprints colored by size (red = <90 bp footprints, green = >90 bp footprints, green = nucleosome, black line = no footprint). (top) Corresponding ChIP-seq signal. (f) Barplot depicting the Fisher’s exact test odds ratio of PPP/PIC footprint co-occupancy on reads overlapping genes separated by a ChIP-seq peak of an insulator binding protein. Reads are divided based on the illustrated state of the insulator, with significance indicated (Fisher’s exact test, ** signifies p < 10−5 and *** signifies p < 10−45)
Figure 5:
Figure 5:. Coupling of transcription activity between nearby Pol III genes
(a) Heatmap depicting the enrichment of differently sized Fiber-seq footprints relative to tRNA TSSs. The expected position of TFIIIB, TFIIIC, terminating Pol III, and the A- and B-box are indicated above the plot. Boxes indicate enriched footprint populations. (b) Plots showing the percent enrichment of 30–90 bp footprints relative to the TSSs of families of tRNA genes. (c) Percent enrichment of 30–90 bp footprints relative to the TSS of individual isoleucine (top) or tyrosine (bottom) tRNA genes. (d) Barplot depicting the Fisher’s exact test odds ratio of tRNA transcription associated footprint co-occupancy between pairs of tRNAs binned by distance, with significance indicated above (Fisher’s exact test, n.s. signifies p > 0.05, ** signifies p-value < 10−4, **** signifies p-value < 10−85). (e) Boxplot of the distribution of transcription frequency scores for tRNA genes separated from another tRNA gene, binned by distance. Pairwise significance is indicated (two-sample t-test, * signifies p-value < 0.05). (f) Barplot depicting the Fisher’s exact test odds ratio of 5S rRNA transcription-associated footprint co-occupancy between pairs of 5S rRNAs binned by count of intermediate 5S rRNA copies. Significance is indicated above (Fisher’s exact test, n.s. signifies p > 0.05, ** signifies p-value < 10−4, **** signifies p-value < 10−251). (g) Bar plot depicting the Fisher’s exact test odds ratio of tRNA transcription-associated footprint co-occupancy with PPP/PIC footprints between pairs of tRNA and Pol II genes binned by distance. Significance is indicated above (Fisher’s exact test, n.s. signifies p > 0.05, * signifies p-value < 0.05, ** signifies p-value < 0.01).

Update of

References

    1. Core L, and Adelman K (2019). Promoter-proximal pausing of RNA polymerase II: a nexus of gene regulation. Genes Dev. 33, 960–982. 10.1101/gad.325142.119. - DOI - PMC - PubMed
    1. Mayer A, Landry HM, and Churchman LS (2017). Pause & go: from the discovery of RNA polymerase pausing to its functional implications. Curr. Opin. Cell Biol. 46, 72–80. 10.1016/j.ceb.2017.03.002. - DOI - PMC - PubMed
    1. Petesch SJ, and Lis JT (2012). Overcoming the nucleosome barrier during transcript elongation. Trends Genet. 28, 285–294. 10.1016/j.tig.2012.02.005. - DOI - PMC - PubMed
    1. Farnung L, Ochmann M, Garg G, Vos SM, and Cramer P (2022). Structure of a backtracked hexasomal intermediate of nucleosome transcription. Mol. Cell 82, 3126–3134.e7. 10.1016/j.molcel.2022.06.027. - DOI - PubMed
    1. Wang H, Schilbach S, Ninov M, Urlaub H, and Cramer P (2023). Structures of transcription preinitiation complex engaged with the +1 nucleosome. Nat. Struct. Mol. Biol. 30, 226–232. 10.1038/s41594-022-00865-w. - DOI - PMC - PubMed

MeSH terms