. 2024 Aug 2;41(8):msae173.
doi: 10.1093/molbev/msae173.

Ecological Changes Exacerbating the Spread of Invasive Ticks has Driven the Dispersal of Severe Fever with Thrombocytopenia Syndrome Virus Throughout Southeast Asia

Affiliations

Ecological Changes Exacerbating the Spread of Invasive Ticks has Driven the Dispersal of Severe Fever with Thrombocytopenia Syndrome Virus Throughout Southeast Asia

Lester J Pérez et al. Mol Biol Evol. .

Abstract

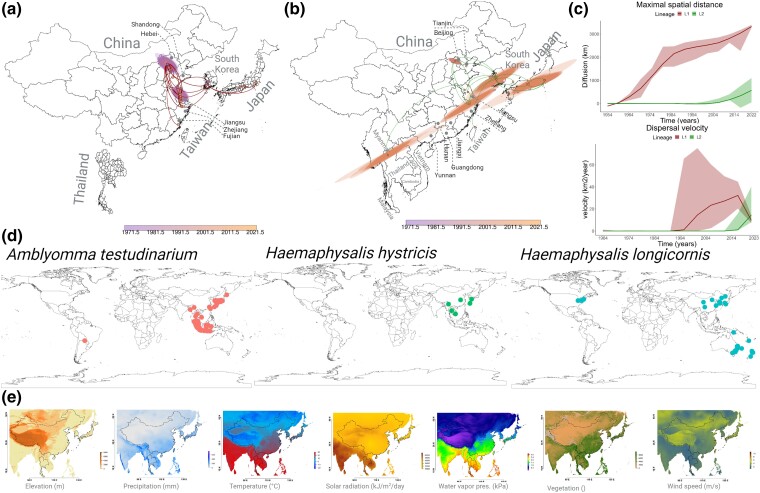
Severe fever with thrombocytopenia syndrome virus (SFTSV) is a tick-borne virus recognized by the World Health Organization as an emerging infectious disease of growing concern. Utilizing phylodynamic and phylogeographic methods, we have reconstructed the origin and transmission patterns of SFTSV lineages and the roles demographic, ecological, and climatic factors have played in shaping its emergence and spread throughout Asia. Environmental changes and fluctuations in tick populations, exacerbated by the widespread use of pesticides, have contributed significantly to its geographic expansion. The increased adaptability of Lineage L2 strains to the Haemaphysalis longicornis vector has facilitated the dispersal of SFTSV through Southeast Asia. Increased surveillance and proactive measures are needed to prevent further spread to Australia, Indonesia, and North America.

Keywords: climatic factors; ecological; evolution; phylodynamic; severe fever with thrombocytopenia syndrome virus.


Figures

Fig. 1.
Fig. 1.
Phylogenetic analysis of SFTSV genomic segments. Maximum likelihood trees represent the phylogeny of all nonredundant SFTSV genomes in GenBank for segments a) L, b) M, and c) S. After the PASC and lineage demarcation (see supplementary fig. S1, Supplementary Material online), we identified three primary clades per segment. Location of the strain's isolation (country) is color coded at the tips, while the inner and outer circles indicate the isolation host and the influence of sequence length on phylogeny, respectively. To enhance the clarity of host range visualization in the figure, tick has been collectively labeled as “Tick.” The figure highlights host from which a higher frequency of sequences (n > 15) have been obtained, while less frequently sampled hosts are grouped under the label “Others.” For a comprehensive view of all hosts from which genomic data have been collected, please see supplementary fig. S2, Supplementary Material online. In all cases, the data were integrated using the ggtreeExtra R package.
Fig. 2.
Fig. 2.
Mechanisms of SFTSV genetic diversity. a) Tanglegram comparison of maximum likelihood trees for genomic segments L vs. M (left), L vs. S (center), and M vs. S (right), highlighting topological incongruences (see supplementary fig. S3, Supplementary Material online for initial strain identification). Subsequent analysis using ultrametric trees and cophenetic distances computed by the prophogorn R package (PASC cutoff set at 2%, as detailed in supplementary fig. S1, Supplementary Material online) revealed no reassortant strains, though significant RF distances were noted. b) The detection of recombination breakpoints in L and M segments as determined by RDP5v5 and confirmed by the temporal evaluation of their parental strains (supplementary figs. S4 to S6, Supplementary Material online), visualized with Bootscan and presenting only those with clear signals and bootstrap values ≥75% (all recombinants found in the study are listed in supplementary fig. S4, Supplementary Material online and the temporal analysis of their parental strains are displayed in supplementary figs. S5 and S6, Supplementary Material online). c) Adaptive divergence assessed by nonsynonymous/synonymous rate differences (dN/dS) and amino acid entropy rates (Shannon entropy), mapped across three coding regions of annotated SFTSV proteins. Variability domains are indicated above the entropy bar graphs, with dN/dS ratios represented by dots. d) Comparative plot of the number of recombinant strains per segment against evolutionary rates estimated by BEASTv1.10.5, including the 95% HPD intervals.
Fig. 3.
Fig. 3.
Tick–host dynamics and evolutionary demography of SFTSV genomic segments. a to c) Time-scaled MCC phylogenies for SFTSV genomic segments L, M, and S, with sampling countries indicated by the color of the tips. The 95% posterior density intervals for the MRCA of each segment are denoted: M-segment, L-segment, and S-segment. d to f) SkyGrid plots showing changes in the effective population size of SFTSV over time. g) Vector diversity analysis determined by the frequency of ticks identified in the genomic metadata (each tick species is denoted). h) The historical tick population dynamics from 1900, presented with occurrence data (dots) and trend lines from loess regression models. Ticks' occurrence, collection date and coordinates were obtained from the GBIF (see Materials and Methods). Vertical dotted lines indicate the inception of the demographic expansion for each segment (red for M, blue for L, and green for S) as estimated by Bayesian SkyGrid analysis.
Fig. 4.
Fig. 4.
Detailed GLM phylogeographic analysis of SFTSV spread and influencing factors. a and b) GLMs uncover the relationships between SFTSV dispersal trajectory and different predictors, including environmental, ecological, and demographic factors (supplementary table S2, Supplementary Material online). The influence of each predictor on the virus spread was quantified by coefficient values and levels of significance. c) An MCC tree, identifying South Korea as the likely origin of the SFTSV proliferation. The analysis also identifies two predominant lineages: L1, with a significant presence in China, indicated by red, and L2, with significant dissemination in neighboring countries of Asia, denoted by green. d) Dynamic pathways of SFTSV of geographical movement denoted by Markov jump mappings. Only those transitions supported by a BF >20 are denoted. e) Transmission network of SFTSV summarized by the Markov jump event represented in a circular layout using the circlize package in R. This visualization facilitated the frequency and routes of virus importation, exportation, and intracountry dispersal. For inclusion probabilities and coefficients for all predictors, we refer to supplementary evaluation of predictors, Supplementary Material online.
Fig. 5.
Fig. 5.
Tracing the historical dispersal and landscape dynamics of SFTSV lineages in Eastern Asia. Dispersal history reconstructions for SFTSV lineages a) L1 and b) L2, as identified in continuous phylogeographic analysis. Branch colors on the MCC trees correspond to curves in the spatial phylogeography, nodes and associated 80% HPD regions are time colored (see scale bars). c) Metrics of maximal spatial distance and dispersal velocity for each lineage (denoted in the plots) are presented, including weighted dispersal velocities and diffusion coefficients, with 95% HPD intervals. d) Global distribution of the primary tick vectors identified in this study (A. testudinarium, H. hystricis, and H. longicornis) as drivers of SFTSV emergence and spread. e) Impact assessment of environmental variables on lineage dispersal characteristics, such as resistance, conductance, attraction, and repulsion. Detailed statistical analyses are available in supplementary tables S4 to S7, Supplementary Material online.

References

    1. Akagi K, Miyazaki T, Oshima K, Umemura A, Shimada S, Morita K, Senju H, Tashiro M, Takazono T, Saijo T, et al. . Detection of viral RNA in diverse body fluids in an SFTS patient with encephalopathy, gastrointestinal bleeding and pneumonia: a case report and literature review. BMC Infect Dis. 2020:20(1):281. 10.1186/s12879-020-05012-8. - DOI - PMC - PubMed
    1. Ayres DL, Cummings MP, Baele G, Darling AE, Lewis PO, Swofford DL, Huelsenbeck JP, Lemey P, Rambaut A, Suchard MA. BEAGLE 3: improved performance, scaling, and usability for a high-performance computing library for statistical phylogenetics. Syst Biol. 2019:68(6):1052–1061. 10.1093/sysbio/syz020. - DOI - PMC - PubMed
    1. Baele G, Lemey P, Bedford T, Rambaut A, Suchard MA, Alekseyenko AV. Improving the accuracy of demographic and molecular clock model comparison while accommodating phylogenetic uncertainty. Mol Biol Evol. 2012:29(9):2157–2167. 10.1093/molbev/mss084. - DOI - PMC - PubMed
    1. Beard R, Magee D, Suchard MA, Lemey P, Scotch M. Generalized linear models for identifying predictors of the evolutionary diffusion of viruses. AMIA Jt Summits Transl Sci Proc. 2014:2014:23–28. - PMC - PubMed
    1. Casel MA, Park SJ, Choi YK. Severe fever with thrombocytopenia syndrome virus: emerging novel phlebovirus and their control strategy. Exp Mol Med. 2021:53(5):713–722. 10.1038/s12276-021-00610-1. - DOI - PMC - PubMed

LinkOut - more resources