. 2024 Aug 27;15(1):7362.
doi: 10.1038/s41467-024-50618-0.

Community assessment of methods to deconvolve cellular composition from bulk gene expression

Collaborators, Affiliations

Community assessment of methods to deconvolve cellular composition from bulk gene expression

Brian S White et al. Nat Commun. .

Erratum in

  • Author Correction: Community assessment of methods to deconvolve cellular composition from bulk gene expression.
    White BS, de Reyniès A, Newman AM, Waterfall JJ, Lamb A, Petitprez F, Lin Y, Yu R, Guerrero-Gimenez ME, Domanskyi S, Monaco G, Chung V, Banerjee J, Derrick D, Valdeolivas A, Li H, Xiao X, Wang S, Zheng F, Yang W, Catania CA, Lang BJ, Bertus TJ, Piermarocchi C, Caruso FP, Ceccarelli M, Yu T, Guo X, Bletz J, Coller J, Maecker H, Duault C, Shokoohi V, Patel S, Liliental JE, Simon S; Tumor Deconvolution DREAM Challenge consortium; Saez-Rodriguez J, Heiser LM, Guinney J, Gentles AJ. White BS, et al. Nat Commun. 2024 Nov 12;15(1):9783. doi: 10.1038/s41467-024-53843-9. Nat Commun. 2024. PMID: 39532851 Free PMC article. No abstract available.

Abstract

We evaluate deconvolution methods, which infer levels of immune infiltration from bulk expression of tumor samples, through a community-wide DREAM Challenge. We assess six published and 22 community-contributed methods using in vitro and in silico transcriptional profiles of admixed cancer and healthy immune cells. Several published methods predict most cell types well, though they either were not trained to evaluate all functional CD8+ T cell states or do so with low accuracy. Several community-contributed methods address this gap, including a deep learning-based approach, whose strong performance establishes the applicability of this paradigm to deconvolution. Despite being developed largely using immune cells from healthy tissues, deconvolution methods predict levels of tumor-derived immune cells well. Our admixed and purified transcriptional profiles will be a valuable resource for developing deconvolution methods, including in response to common challenges we observe across methods, such as sensitive identification of functional CD4+ T cell states.


Conflict of interest statement

A.M.N. is a co-founder of CiberMed, Inc., and A.J.G. has consulted for CiberMed, Inc. J.S.R. received funding from GlaxoSmithKline and Sanofi and consultant fees from Travere Therapeutics and Astex Therapeutic. A.V. is currently employed by F. Hoffmann-La Roche Ltd. The remaining authors declare no competing interests.

Figures

Fig. 1
Fig. 1. Generation of in silico and in vitro admixtures of immune, stromal, and cancer cells and their use as validation data for a DREAM Challenge.
A Cell populations predicted within fine-grained and coarse-grained sub-Challenges indicated with red text and star or blue text and blue shading, respectively. Cell types aggregated together in coarse-grained sub-Challenge are connected via their blue shading (e.g., monocytes, myeloid dendritic cells, and macrophages were classified as monocytic lineage). Immune populations are depicted within the haematopoietic hierarchy, which represents differential trajectories and not necessarily levels of specificity. B Admixture generation and use for validation. (Left) Purified immune cell populations were obtained from vendors and volunteers. Purified stromal and cancer cell populations were obtained from cell lines. (Right) In vitro admixtures were created by mixing mRNA from purified cell populations in specified ratios (unconstrained or biologically reasonable) and then subjected to RNA-seq. In silico admixtures were created by first sequencing purified cells to define population-specific signatures and then taking a linear combination of those signatures using specified ratios (unconstrained or constrained according to biologically reasonable expectation). C Deconvolution methods executed in the cloud against in silico and in vitro admixtures yielded predictions that were then compared to the input ratios using cross-sample, within-cell type correlation (Figs. 2 and 3). Methods were ranked according to their cross-sample, within-cell type Pearson correlations (primary metric), with ties resolved using cross-sample, within-cell type Spearman correlations. D Method performance was also quantified according to cross-cell type, within-sample correlation (Fig. 4), specificity (i.e., the spillover prediction from a purified cell type into a different cell type; Fig. 5), and sensitivity (i.e., the limit of detection for a particular cell type; Fig. 6). AD Created with BioRender.com, released under a Creative Commons Attribution-NonCommercial-NoDerivs 4.0 International license.
Fig. 2
Fig. 2. Aggregate cross-sample performance of participant and comparator deconvolution methods.
Aggregate score (primary metric: Pearson correlation; secondary metric: Spearman correlation) of participant (first submission only) and comparator methods in (A) coarse- and (B) fine-grained sub-Challenges over bootstraps (n = 1000; Methods). Comparator methods (bold) are shown only if their published reference signatures include all cell types in each respective sub-Challenge: CIBERSORTx (coarse-grained only) and xCell. Boxplots display median (center line), 25th and 75th percentiles (hinges), and 1.5x interquartile range (whiskers). Methods ordered by median Pearson correlation in respective sub-Challenge. DNN deep neural network, ENS ensemble, NMF non-negative matrix factorization, NNLS non-negative least squares, OTH other, PI probabilistic inference, REG other regression, SUM summary, SVR support vector regression, UNK unknown/unspecified, Frac unnormalized fractions that need not sum to one, Norm normalized scores (comparable across cell types and samples), Prop proportions that sum to one. Source data are provided as a Source Data file.
Fig. 3
Fig. 3. Per-cell type performance of participant and comparator deconvolution methods.
A Pearson correlation of method (left axis) prediction versus known proportion from admixture for each cell type (bottom axis). Pearson correlation is first averaged over validation dataset and then over bootstraps (n = 1000; Methods) and subsequently averaged over coarse- and fine-grained sub-Challenges for cell types occurring in both. Black entry indicates cell type not predicted by corresponding method. Bottom two rows are the mean and maximum correlation, respectively, for corresponding cell type across methods. Rightmost column is mean correlation for corresponding method across predicted cell types. Highest correlations for each cell type highlighted in bold italics. B Performance (Pearson correlation; x axis) of comparator baseline methods and participant methods ranking within the top three in either or both sub-Challenges (y axis) for each cell type (facet label). Distribution of Pearson correlations over bootstraps (n = 1000; Methods), computed as average over validation datasets and subsequently over coarse- and fine-grained sub-Challenges for cell types occurring in both. Blank row indicates cell type not reported by the corresponding method. Comparator methods in bold. Boxplots display median (center line), 25th and 75th percentiles (hinges), and 1.5x interquartile range (whiskers). In both panels, methods ordered according to their mean Pearson correlation across cell types (rightmost column in (A)), and cell types ordered according to their maximum Pearson correlation across methods (bottom row in (A)). Source data are provided as a Source Data file.
Fig. 4
Fig. 4. Aggregate cross-cell type performance of participant and comparator deconvolution methods.
Performance [Pearson correlation, Spearman correlation, and root mean square error (RMSE)] of methods capable of within-sample, cross-cell type comparison to ground truth proportions in (A) coarse- and (B) fine-grained sub-Challenges. Distribution over n = 166 samples (methods ordered by median Pearson correlation across samples in respective sub-Challenge). Comparator methods in bold. Boxplots display median (center line), 25th and 75th percentiles (hinges), and 1.5x interquartile range (whiskers). DNN deep neural network, ENS ensemble, NNLS non-negative least squares, OTH other, PI probabilistic inference, REG other regression, SUM summary, SVR support vector regression, UNK unknown/unspecified, Frac fraction, Norm normalized score (comparable across cell types and samples), Prop proportion. Source data are provided as a Source Data file.
Fig. 5
Fig. 5. Specificity of participant and comparator deconvolution methods.
A Normalized prediction of cell type indicated on x axis in purified sample indicated on y axis. B Distribution over methods of spillover into cell type indicated on y axis (averaged first over samples purified for any other cell type, then over sub-Challenges; Methods). Cell types ordered according to their median spillover. Distribution over cell types of spillover for each method in (C) coarse- and (D) fine-grained sub-Challenges. Methods ordered according to their median spillover. Comparator methods in bold. Boxplots display median (center line), 25th and 75th percentiles (hinges), and 1.5x interquartile range (whiskers). Source data are provided as a Source Data file.
Fig. 6
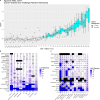
Fig. 6. Sensitivity of participant and comparator deconvolution methods.
A Aginome-XMU predictions for CD4+ T cells (y axis) for unconstrained admixtures including the level of CD4+ T cells indicated (x axis). Limit of detection (LoD) is the least frequency at and above which all admixtures are above background (i.e., statistically different from the baseline admixture of 0% spike in based on a raw / uncorrected, two-sided Wilcoxon p value), which is 6% in this case. Boxplots display median (center line), 25th and 75th percentiles (hinges), and 1.5x interquartile range (whiskers) over n = 10 in silico unconstrained spike-in admixtures. Limits of detection for indicated methods (rows) and cell types (columns) calculated using n = 10 in silico unconstrained spike-in admixtures in each of the (B) coarse- and (C) fine-grained sub-Challenges. Best/lowest LoD for each cell type highlighted in bold italics. Methods ordered according to their mean LoD. Comparator methods in bold. Source data are provided as a Source Data file.
Fig. 7
Fig. 7. Per-cell type performance of participant and comparator deconvolution methods across healthy and malignant datasets.
Performance (Pearson correlation; x axis) of methods (y axis) for each cell type (facet label). Methods include comparator baseline methods, participant methods ranking within the top three in either or both sub-Challenges, or methods having the best mean performance across datasets for any cell type. Performance indicated separately (by color) for Challenge validation (Healthy), in silico scRNA-seq-derived CRC [Pelka (CRC)], and in silico scRNA-seq-derived BRCA [Wu (BRCA)] datasets. Mean performance is calculated across these three datasets. Challenge validation performance is itself the mean performance across the eight healthy Challenge validation datasets (e.g., distinguished by in silico versus in vitro, as in Fig. S20). Methods ordered according to their mean performance across the three datasets and the cell types, and cell types ordered according to the max over methods of their mean performance across the three datasets. Source data are provided as a Source Data file.

References

    1. Petitprez, F. et al. Transcriptomic analysis of the tumor microenvironment to guide prognosis and immunotherapies. Cancer Immunol. Immunother.67, 981–988 (2018). - PMC - PubMed
    1. Petitprez, F. et al. Quantitative analyses of the tumor microenvironment composition and orientation in the era of precision medicine. Front. Oncol.8, 390 (2018). - PMC - PubMed
    1. Lun, X.-K. & Bodenmiller, B. Profiling cell signaling networks at single-cell resolution. Mol. Cell. Proteom.19, 744–756 (2020). - PMC - PubMed
    1. Goltsev, Y. et al. Deep profiling of mouse splenic architecture with CODEX multiplexed imaging. Cell174, 968–981.e15 (2018). - PMC - PubMed
    1. Giesen, C. et al. Highly multiplexed imaging of tumor tissues with subcellular resolution by mass cytometry. Nat. Methods11, 417–422 (2014). - PubMed

MeSH terms