Randomized Controlled Trial
. 2024 Aug 27;15(1):7358.
doi: 10.1038/s41467-024-51427-1.

Antibody Fc receptor binding and T cell responses to homologous and heterologous immunization with inactivated or mRNA vaccines against SARS-CoV-2

Affiliations
Randomized Controlled Trial

Antibody Fc receptor binding and T cell responses to homologous and heterologous immunization with inactivated or mRNA vaccines against SARS-CoV-2

Carolyn A Cohen et al. Nat Commun. .

Abstract

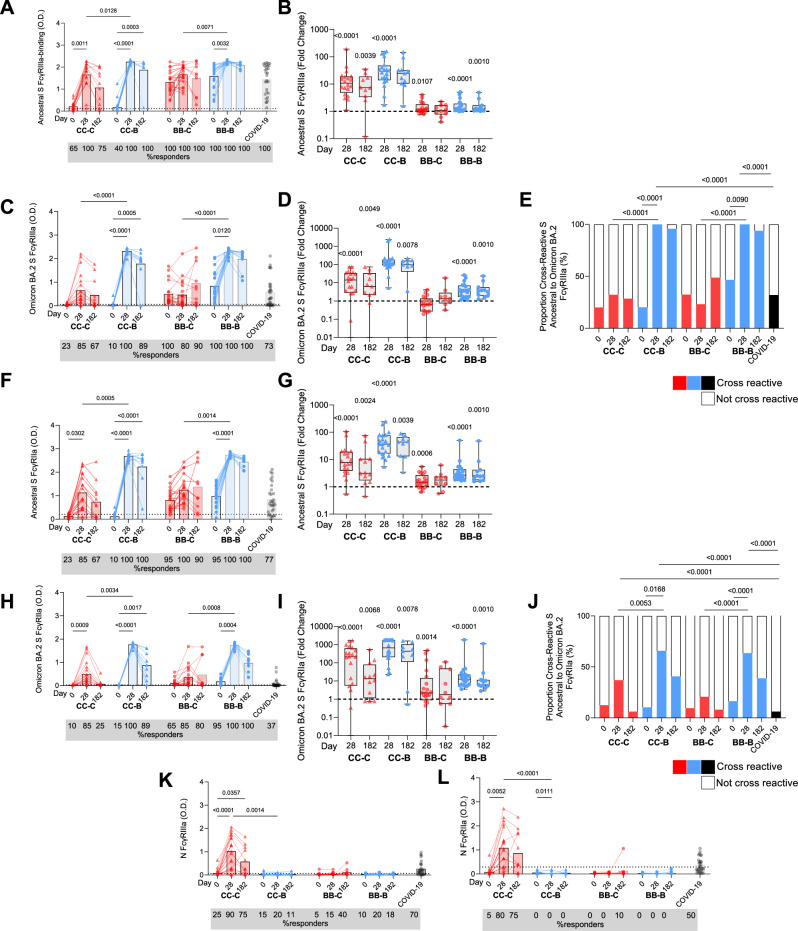
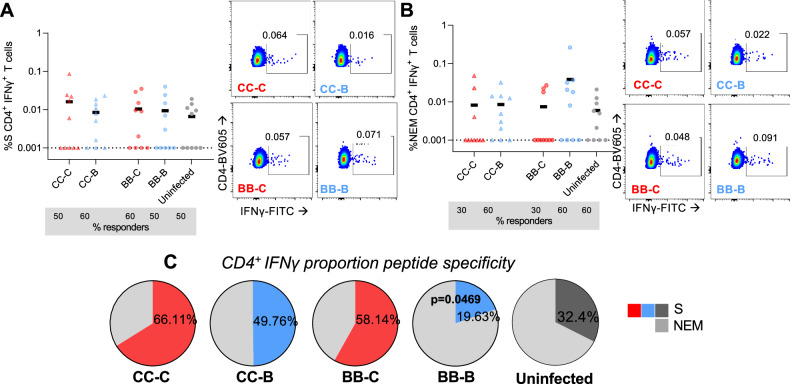
Whole virion inactivated vaccine CoronaVac (C) and Spike (S) mRNA BNT162b2 (B) vaccines differ greatly in their ability to elicit neutralizing antibodies but have somewhat comparable effectiveness in protecting from severe COVID-19. We conducted further analyses for a randomized trial (Cobovax study, NCT05057169) of third dose homologous and heterologous booster vaccination, i.e. four interventions CC-C, CC-B, BB-C and BB-B. Here, we assess vaccine immunogenicity beyond neutralizing function, including S and non-S antibodies with Fc receptor (FcR) binding, antibody avidity and T cell specificity to 6 months post-vaccination. Ancestral and Omicron S-specific IgG and FcR binding are significantly higher by BNT162b2 booster than CoronaVac, regardless of first doses. Nucleocapsid (N) antibodies are only increased in homologous boosted CoronaVac participants (CC-C). CoronaVac primed participants have lower baseline S-specific CD4+ IFNγ+ cells, but are significantly increased by either CoronaVac or BNT162b2 boosters. Priming vaccine content defined T cell peptide specificity preference, with S-specific T cells dominating B primed groups and non-S structural peptides contributing more in C primed groups, regardless of booster type. S-specific CD4+ T cell responses, N-specific antibodies, and antibody effector functions via Fc receptor binding may contribute to protection and compensate for less potent neutralizing responses in CoronaVac recipients.


Conflict of interest statement

BJC has consulted for AstraZeneca, Fosun Pharma, GSK, Haleon, Moderna, Roche, and Sanofi Pasteur. LMP, JSMP, SAV have patented (2021800455096 and 17/997,434) for the use of ORF8 as diagnostics of SARS-CoV-2 infection. MM produced ORF8 by patent process based on US Patents 8,507,220 and 8,586,826. The authors report no other potential conflicts of interest.

Figures

Fig. 1
Fig. 1. Antibody FcR binding and cross-reactivity by third dose booster vaccination.
Vaccine (blue for B/red for C) and control infection responses (black) for FcγRIIIa (AE, K) and FcγRIIa (FJ, L) binding against ancestral Spike (A, B, F, G), Omicron BA.2 Spike (C, D, H, I) and Nucleocapsid (K, L) SARS-CoV-2 proteins. (A, C, F, H, K, L) Data is presented as n = 20 individual responses after background subtraction at day 0 and day 7, and at day 182 n = 12 in CC-C, n = 9 in CC-B, n = 10 in BB-C n = 11 in BB-B, and n = 30 COVID-19 infected controls. Bars represent mean values. Dotted lines crossing the y-axis represent the limit of detection (LOD, mean +2 SD of 44 pre-pandemic controls). The proportion of the group with responses above LOD are shown in grey boxes. Significant differences between groups was assessed with the Kruskal–Wallis test and Dunn’s multiple comparisons (one-sided). (E, J) The average proportion of Ancestral cross reactive response to Omicron BA.2 with (E) FcγRIIIa or (J) FcγRIIa binding. B, D, G, I The fold change antibody response to (B, G) ancestral Spike and (D, I) Omicron BA.2 Spike. Data is shown as individual fold changes with box and whiskers showing the median, upper and lower quartiles, and minimum and maximum responses. Dashed lines at y = 1 represent no fold change. Significant changes determined by One Sample Wilcoxon’s signed-rank test (two-sided) against a hypothetical mean of 1.
Fig. 2
Fig. 2. Cell-based antibody effector functions by third dose booster vaccination.
Antibody-dependent cell cytotoxicity by degranulation in vaccine groups (blue for B/red for C) (A, B) shown as %CD107a+ NK92 cells after subtracting average background GP120 response, and normalizing to maximum CD16 response (32.8%) against ancestral Spike (A) and ancestral Nucleocapsid (B), and day 28 representative FACS plots shown. Antibody-dependent cell phagocytosis by % protein-bound fluorescent beads of THP-1 monocytes. Data shown as %Bead+ THP-1 cell population (EF) individual response with average background (GP120) subtracted response against ancestral Spike (E) and Nucleocapsid (F) and as representative histograms of day 28 response. Donor responses of n = 20 per group at day 0 and 28, and at day 182 n = 12 in CC-C, n = 8 in CC-B, n = 10 in BB-C and n = 12 in BB-B, are linked by lines with bars showing mean values per time point per group. Statistically significant differences measured by Kruskal–Wallis test with Dunn’s multiple comparisons (one-sided) (A, B, E, F). Average cross-reactive percentage of ancestral Spike ADCC (C) and ADCP (G) response to Omicron BA.2. Correlations between Ancestral Spike, Omicron BA.2 Spike, and Ancestral Nucleocapsid ADCC and FcγRIIIa-binding (D) and ADCP and FcγRIIa-binding (H) response. Spearman’s (two-sided) correlation with r and p values are embedded with lines showing linear regression.
Fig. 3
Fig. 3. Antibody avidity and T follicular helper cells by third dose booster vaccination.
IgG avidity in vaccine recipients (blue for B/red for C) against (A) ancestral Spike (B) Omicron BA.2 Spike and (C) Nucleocapsid. Avidity is calculated for IgG “responders” from Supplementary Fig. 2. In ancestral CC-C day 0 n = 8, day 28 n = 19, day 182 n = 13; CC-B day0 n = 4, day 28 n = 18, day 182 n = 9; BB-C day 0 and 28 n = 20, day 182 n = 9; BB-B day 0 and 28 n = 20, day 182 n = 11. In Omicron BA.2 CC-C day 0 n = 2, day 28 n = 16, day 182 n = 11; CC-B day 0 n = 1, day 28 n = 18, day 182 n = 8; BB-C day 0 n = 13, day 28 n = 20, day 182 n = 9; BB-C day 0 n = 15, day 28 n = 20, day 182 n = 11. In Nucleocapsid CC-C day 0 n = 5, day 28 n = 19, day 182 n = 8; CC-B, BB-C, BB-B is either not detected (ND) or n = 1. D The average proportions of ancestral S avidity cross-reactive to Omicron BA.2 S. E Total Tfh by CXCR5+ CD45RA- CD4+ T cells and (F) PD1+ ICOS+ activated total Tfh, with representative FACS plots from day 7 post booster. (ABCEF) Data is presented as individual responses with the same donor linked by lines and mean values in black dashes. (A, B, C) Dotted lines represent 50% avidity, and the % of the group participants with responses about 50% avidity are in grey boxes. ND = not detected. Differences between groups calculated using Kruskal–Wallis test with Dunn’s multiple comparisons (one-sided). The correlation between day 7 activated Tfh and day 28 IgG avidity against (G) ancestral S and (H) Omicron BA.2 S. Black lines represent correlations between samples with Spearman’s (two-sided) correlation calculated and r and p values shown. Coloured lines represent correlations between responses in each vaccine group. I Fold change day 7 Tfh and day 28 IgG avidity in each group shown as box and whiskers with all points, median, upper and lower quartiles, minimum and maximum values shown. Dotted lines at 1 indicate no change and significant changes by One Sample Wilcoxon test shown (two-sided). Differences between cellular (E) and serological fold changes (I) calculated using Kruskal-Wallis (one-sided) tests.
Fig. 4
Fig. 4. CD4+ T cell responses to spike and Nucleocapsid, Envelope and Membrane peptide pools.
Paired pre (day 0) and post vaccination (day 7 and 28) PBMCs (n = 10 per vaccine group/timepoint blue for B/red for C, n = 10 pre-pandemic controls in grey) were tested by ICS and stained for CD4+ IFNγ+ T cells in response to an (A, B) S and (C, D) Nucleocapsid, Envelope and Membrane (NEM) overlapping peptide pool. Data is shown as (A, C) representative FACS plots including positive control PMA and negative control DMSO no peptide, and (B, D) individual values with matched donors linked by lines and black dashes representing mean values. n = 3 samples were excluded due to low cell viability ( < 30%) from CC-C day 7 (n = 2) and BB-C day 7 (n = 1). Dotted lines represent the LOD at 0.00028% based on the lowest positive value following subtraction of matched DMSO no peptide background responses. % of the group with responses above the LOD, i.e. “responders” are shown in grey boxes. Statistical differences were assessed using Kruskal–Wallis test with Dunn’s multiple comparisons (one-sided). E The mean proportion S (red or blue) and NEM (grey) IFNγ response, with percentage S shown. Wilcoxon’s matched pairs test (two-sided) was used to determine differences between S and NEM response. The fold change response to S and NEM (F). Data is presented as individual fold changes with box and whiskers showing median, upper and lower quartiles and minimum and maximum values. Dashed line at y = 1 represents no fold change of response. % donors with fold changes >1 are presented in the grey box. Statistical fold changes are calculated using One Sample Wilcoxon signed rank test against 1 (two-sided). Differences between S and NEM fold changes were calculated using Wilcoxon’s matched pairs test (two-sided), B, D, F.
Fig. 5
Fig. 5. Long-term memory post vaccination T cell responses.
Day 182 post vaccination CD4+ IFNγ+ T cell response for (A) S (B) or NEM peptides in donors who received homologous or heterologous booster doses with inactivated and mRNA vaccines against COVID-19 (n = 10 per group blue for B/red for C) and n = 10 uninfected controls (grey). Data is shown as individual IFNγ values after DMSO background subtraction. The dotted lines represent the LOD as the lowest positive value after DMSO subtraction, CD4+ = 0.001%. The percentage of the group with responses above the LOD are shown in grey boxes. Comparisons between third dose vaccine groups made using the Mann–Whitney U test (two-sided) with no significant differences observed. C The mean proportion (%) of CD4+ IFNγ responses directed toward S (red, blue or dark grey) or NEM (light grey) peptides, with percentage S shown. Comparisons between S and NEM responses made using Wilcoxon’s matched test (two-sided).
Fig. 6
Fig. 6. Cytokine polyfunctionality of S and NEM specific T cell responses.
Proportion of CD4+ IFNγ+ response producing IFNγ alone (light) or multiple Th1 cytokines (IFNγ + TNF darkest, IFNγ + IL2 medium, or IFNγ + TNF + IL2 dark) at day 0, 7 and 28 post vaccination (blue for B/red for C) against S (A, B) or NEM (C, D) peptides (from Fig. 4). (A, C) Participants with IFNγ responses above the negative DMSO cut-off and 30% viability cut off were included (S CC-C D0 n = 5, D7 n = 4, D28 n = 9; CC-B D0 n = 4, D7 n = 6, D28 n = 8; BB-C D0 n = 9, D7 n = 8, D28 n = 9; BB-B D0 n = 10, D7 n = 9, D28 n = 10; NEM CC-C D0 n = 6, D7 n = 8, D28 n = 10; CC-B D0 n = 5, D7 n = 2, D28 n = 8; BB-C D0 n = 5, D7 n = 7, D28 n = 8; BB-B D0 n = 4, D7 n = 8, D28 n = 5). Comparisons between vaccine groups were made using the Mann–Whitney U test (two-sided). FACS plots show a representative response at D28. (B) S and (D) NEM spider plots showing the mean polyfunctional responses for each group the Kruskal–Wallis test (one-sided) was used to find no significant differences between vaccine groups.
Fig. 7
Fig. 7. PD-1 phenotype of CD4+ IFNγ T cell responses post vaccination.
Proportion of CD4+ IFNγ+ response to (A) S and (B) NEM expressing IFNγ and PD-1. (A, B) Data presented as individual values from donors at all 4 time points with IFNγ responses above the DMSO cut-off, with bars and error bars showing the mean ± SD. In CC-C, day 0 n = 5, day 7 n = 4, day 28 n = 5, day 182 n = 7; in CC-B day 0 n = 4, day 7 n = 8, day 28 n = 4, day 182 n = 6; BB-C day 0 n = 9, day 7 n = 8, day 28 n = 9, day 182 n = 5; BB-B day 0 n = 10, day 7 n = 9, day 28 n = 10 and day 182 n = 5. Representative FACS plots from D7 post vaccination showing peak PD-1 levels of IFNγ+ T cells responses. Comparisons between timepoints were made using Kruskal–Wallis test (one-sided), and between vaccine groups using Mann–Whitney U test (two-sided).

References

    1. Mok, C. et al. Comparison of the immunogenicity of BNT162b2 and CoronaVac COVID-19 Vaccines in Hong Kong. Respirology, (2021). - PMC - PubMed
    1. McMenamin, M. E. et al. Vaccine effectiveness of one, two, and three doses of BNT162b2 and CoronaVac against COVID-19 in Hong Kong: a population-based observational study. Lancet Infect Dis22, 1435–1443 (2022). 10.1016/S1473-3099(22)00345-0 - DOI - PMC - PubMed
    1. Tsang, N. N. Y., So, H. C., Cowling, B. J., Leung, G. M. & Ip, D. K. M. Effectiveness of BNT162b2 and CoronaVac COVID-19 vaccination against asymptomatic and symptomatic infection of SARS-CoV-2 omicron BA.2 in Hong Kong: a prospective cohort study. Lancet Infect Dis23, 421–434 (2023). 10.1016/S1473-3099(22)00732-0 - DOI - PMC - PubMed
    1. Cameroni, E. et al. Broadly neutralizing antibodies overcome SARS-CoV-2 Omicron antigenic shift. Nature602, 664–670 (2022). 10.1038/s41586-021-04386-2 - DOI - PMC - PubMed
    1. Wang, S. et al. Manipulating the selection forces during affinity maturation to generate cross-reactive HIV antibodies. Cell160, 785–797 (2015). 10.1016/j.cell.2015.01.027 - DOI - PMC - PubMed

Publication types

MeSH terms