. 2024 Aug 27;15(1):7226.
doi: 10.1038/s41467-024-51411-9.

Innate immune responses against mRNA vaccine promote cellular immunity through IFN-β at the injection site

Affiliations

Innate immune responses against mRNA vaccine promote cellular immunity through IFN-β at the injection site

Seongryong Kim et al. Nat Commun. .

Abstract

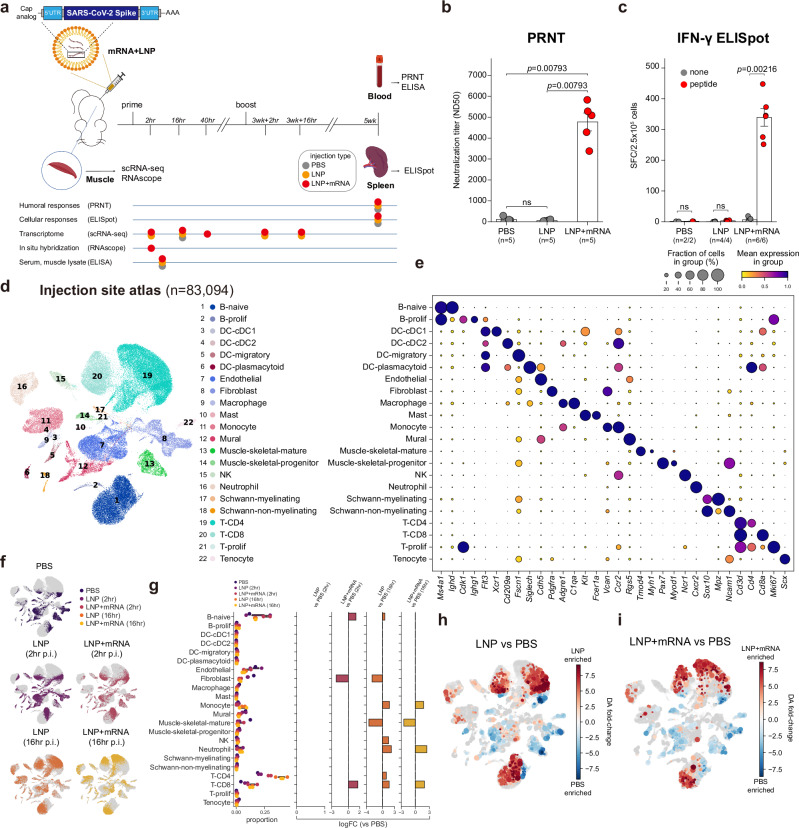
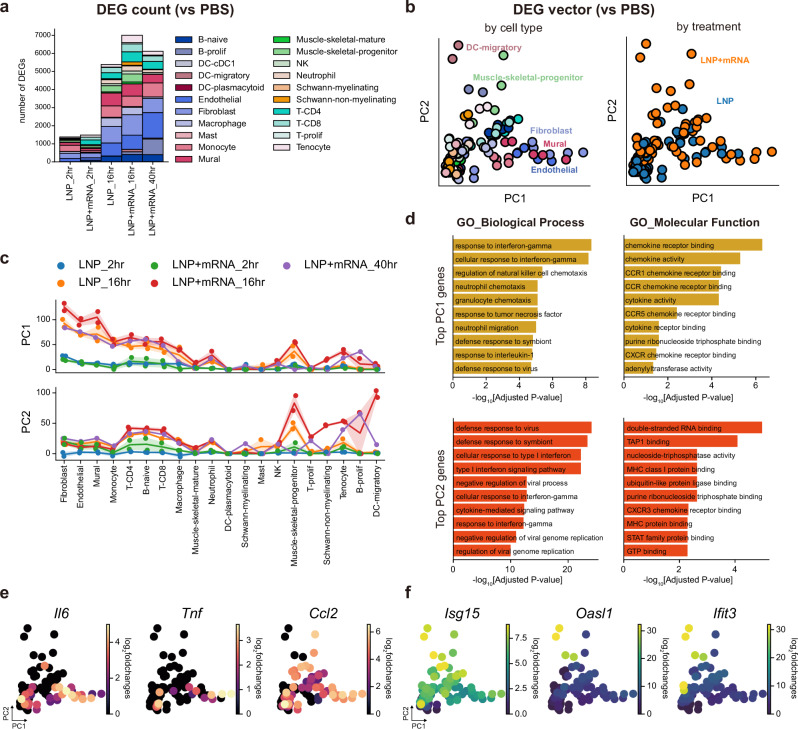
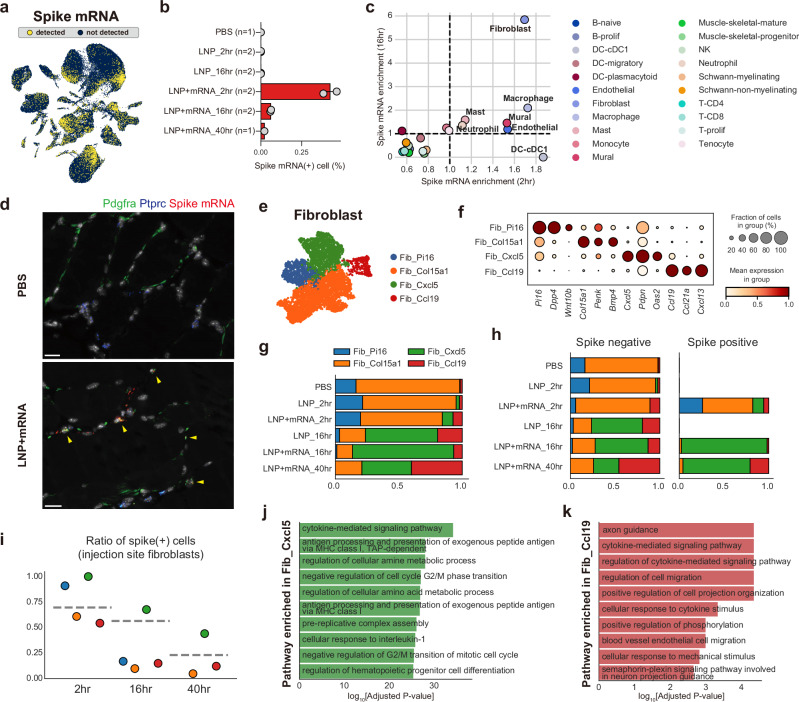
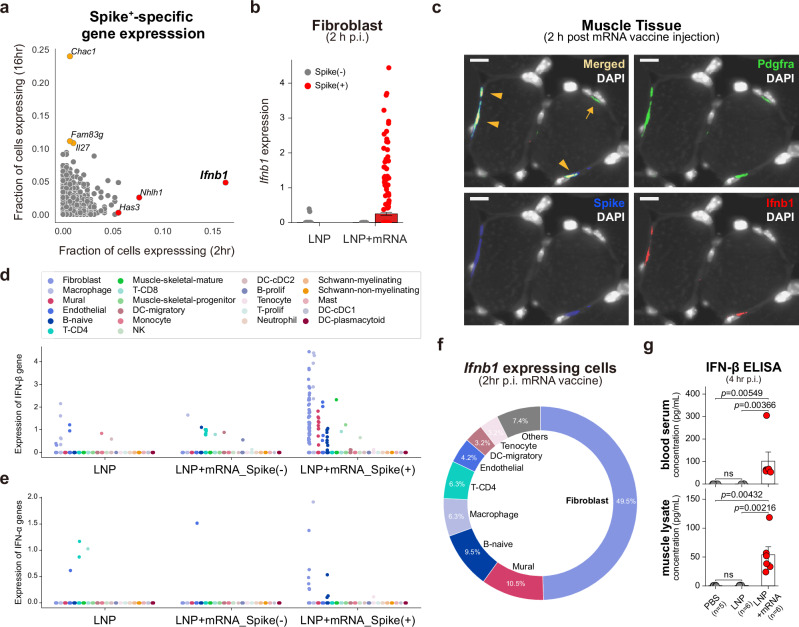
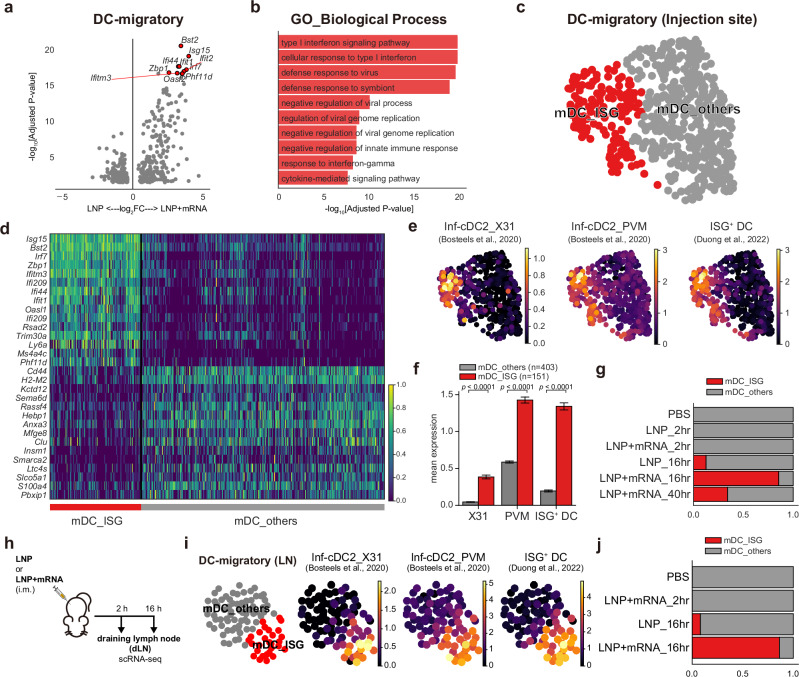
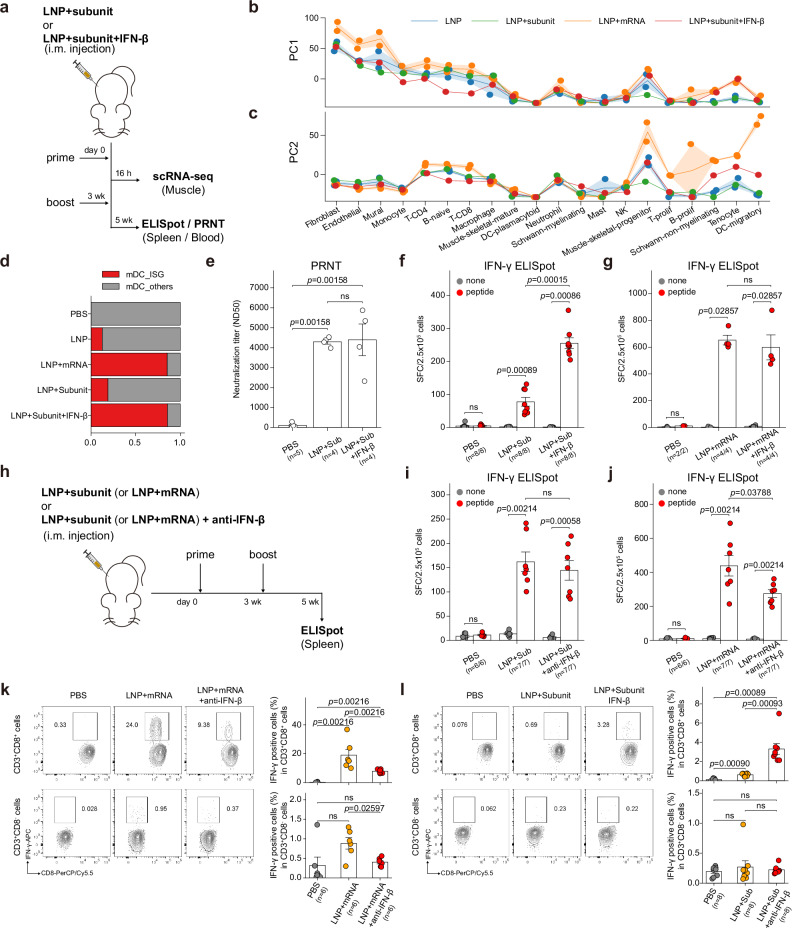
mRNA vaccines against SARS-CoV-2 have revolutionized vaccine development, but their immunological mechanisms are not fully understood. Here, we investigate injection site responses of mRNA vaccines by generating a comprehensive single-cell transcriptome profile upon lipid nanoparticle (LNP) or LNP-mRNA challenge in female BALB/c mice. We show that LNP-induced stromal pro-inflammatory responses and mRNA-elicited type I interferon responses dominate the initial injection site responses. By tracking the fate of delivered mRNA, we discover that injection site fibroblasts are highly enriched with the delivered mRNA and that they express IFN-β specifically in response to the mRNA component, not to the LNP component of mRNA vaccines. Moreover, the mRNA-LNP, but not LNP alone, induces migratory dendritic cells highly expressing IFN-stimulated genes (mDC_ISGs) at the injection site and draining lymph nodes. When co-injected with LNP-subunit vaccine, IFN-β induces mDC_ISGs at the injection site, and importantly, it substantially enhances antigen-specific cellular immune responses. Furthermore, blocking IFN-β signaling at the injection site significantly decreases mRNA vaccine-induced cellular immune responses. Collectively, these data highlight the importance of injection site fibroblasts and IFN-β signaling during early immune responses against the mRNA vaccine and provide detailed information on the initial chain of immune reactions elicited by mRNA vaccine injection.


Conflict of interest statement

The authors declare no competing interests.

Figures

Fig. 1
Fig. 1. Single-cell atlas of mRNA vaccine injection-site responses.
a Experimental and sample preparation schemes used in this study. b Serum titers of neutralizing antibodies measured with the PRNT assay, showing median neutralizing doses (ND50) values compared between the groups with biological replicates. Data are presented as mean values ±SEM. c Results from IFN-γ ELISpot assay. Spleen cells (2.5 × 105 cells/well) were challenged with negative control (none), or a peptide pool of SARS-CoV-2 spike protein (peptide), and the number of IFN-γ spot-forming cells (SFCs) was counted and displayed. Average counts of SFCs from technical duplicates are plotted, and the displayed data points indicate biological replicates. Data are presented as mean values ±SEM. d Uniform manifold approximation and projection (UMAP) representation of injection site scRNA-seq data annotated with cell types. e A dot plot representation of cell types and their representative marker genes identified in the injection-site scRNA-seq data. Dot sizes are proportional to the fraction of cells expressing marker genes, and dot colors represent min-max normalized average expression levels of marker genes in each cell type. f Injection site scRNA-seq data are shown according to the treatment conditions and p.i. time points. g Proportions of cell types in each treatment time and p.i. time point. The left-most panel shows raw portions of each cell type, and the panels on the right side indicate results from differential cell composition analysis. Only the log-fold change values passing the false discovery rate cut-off (<0.05) are shown in the bar graphs. h, i Results from differential abundance testing are overlaid on cellular landscape. Red colors indicate local cell neighborhoods enriched in (h) LNP treatment samples (2 h, 16 h), and (i) LNP + mRNA treatment samples (2 h, 16 h), against PBS-treated samples. Dot sizes are proportional to the sizes of the cellular neighborhoods. All statistical evaluations were conducted with two-tailed Mann–Whitney U tests (ns: nonsignificant). Schematic images were created with BioRender.com.
Fig. 2
Fig. 2. Major axes of the transcriptional responses elicited by mRNA vaccine injection.
a Bar plots showing the number of cell type–wise DEGs in each treatment condition and time point (vs PBS injected sample). b Scatter plot representation of DEG vectors. Each dot represents a DEG vector of a cell type in each sample (vs PBS injected). The x and y axes represent each DEG’s projection on the PC1 and PC2 axes of the maximal responses (16 h p.i. response after mRNA vaccine injection). Dot colors denote cell type identities (left) and treatment conditions (right). c Line plots showing PC1 (top) and PC2 (bottom) projections of DEG vectors. Colors of lines and dots represent treatment conditions and p.i. times of DEG vectors. Line plot indicates mean values, and the error bands indicate 95% confidence intervals. d, Bar plots representing the results from pathway enrichment analysis, which was conducted on the top 100 genes contributing to PC1 (top panel) or PC2 axes (bottom panel). Biological Process (left) and Molecular Function (right) gene sets from the Gene Ontology (2023) were used for functional enrichment analysis. Adjusted P values (two-tailed, Benjamini-Hochberg adjustment) from the enrichment analysis were log-transformed, and their negative values are represented on the x axis of each bar plot. e, f DEG vectors plotted according to their PC1 projections (x-axis) and PC2 projections (y-axis). Dot colors represent log2 fold changes of (e) pro-inflammatory cytokine genes or (f) IFN-stimulated genes in the DEG vectors.
Fig. 3
Fig. 3. Enrichment of mRNA vaccine transcripts in injection-site fibroblasts.
a Spike mRNA-detected cells depicted on the UMAP plot of the injection-site scRNA-seq atlas. Yellow colored dots indicate spike mRNA-detected cells (spike mRNA count >1). b Fraction of spike mRNA-detected cells in the injection-site scRNA-seq data in each treatment and time point condition. Data are presented as mean values ±SEM. c Identification of spike mRNA–enriched cell types. Average spike mRNA counts (log-transformed) of the cell types were normalized across the cell types in each sample. The normalized values of spike mRNA (spike mRNA enrichment) in each time point are represented on the x-axis (enrichment in 2 h p.i.) and y-axis (enrichment in 16 h p.i.) of the scatter plot. Dot colors represent cell type identities. d Representative RNA-ISH image acquired from saline-injected (top) or mRNA-vaccine (bottom) 16 h p.i. muscle tissues. The images were selected from biological replicates of mRNA-vaccine injected samples (n = 2) and control samples (n = 2). Green, blue, and red indicate detection signals for Pdgfra, Ptprc, and Spike mRNA transcripts, respectively. Yellow arrowheads indicate fibroblasts with the spike mRNAs. Scale bars indicate 20 µm. e, f Fibroblast populations in the injection-site scRNA-seq atlas are represented in (e) a UMAP plot, and (f) their representative markers are depicted with a dot plot. g Fractions of fibroblast subpopulations according to treatment conditions and p.i. time points. h Fractions of fibroblast populations in spike mRNA–detected or non-detected fibroblasts from each treatment condition. For PBS- or LNP-treated samples, all fibroblasts were negative for mRNA spike, so not plotted on the spike-positive side. i Ratio of spike-positive cells in each fibroblast population. The y-axis of the plot indicates fractions of spike mRNA–detected cells in each fibroblast population, and the x-axis of the plot indicates p.i. time points after mRNA vaccine treatment. j, k Results from pathway enrichment analysis (GO_Biological Process), conducted on the DEGs of (j) Fib_Cxcl5 and (k) Fib_Ccl19. DEGs (vs rest) were defined as genes with adjusted P < 0.05 and log2FC > 1. P values were calculated from two-tailed Wilcoxon rank-sum test and were adjusted with Benjamini-Hochberg method.
Fig. 4
Fig. 4. mRNA-specific induction of IFN-β in injection-site fibroblasts.
a Expression profiles of spike- non-expressed genes in spike+ fibroblasts. Fibroblasts without spike mRNA transcripts from the injection-site scRNA-seq data were merged, and genes with an expressing cell ratio <0.01 were designated as the non-expressed genes in spike- fibroblasts. The expression profiles of the spike- non-expressed genes were evaluated in spike+ fibroblasts from either 2 h p.i. or 16 h p.i. samples of mRNA vaccine injection, and their expressing cell ratios are denoted on the x-axis (2 h p.i.) and the y-axis (16 h p.i.) of the scatter plot. b Ifnb1 expression (log-transformed) in each of the injection-site fibroblasts from 2 h p.i. samples of LNP or LNP+mRNA injection. Red indicates spike+ fibroblasts (n = 289 from LNP+mRNA injection), and gray dots represent spike- fibroblasts (n = 1601 from LNP injection, n = 43 from LNP + mRNA injection). Data are presented as mean values ±SEM. c Representative RNA-ISH image acquired from mRNA-vaccine 2 h p.i. muscle tissue. Images were selected from biological replicates of mRNA-vaccine injected samples (n = 4). Green, blue, and red indicate detection signals for Pdgfra, Spike, and Ifnb1 transcripts, respectively. Orange arrowheads indicate co-localization of the fluorescent signals, which implies spike+ fibroblasts expressing Ifnb1 transcripts, and the orange arrow indicates a spike- fibroblast not expressing Ifnb1 transcript. Scale bars indicate 10 µm. d, e Expression of (d) IFN-β transcripts (Ifnb1 gene) and (e) IFN-α transcripts (sum of the 14 IFN-α transcripts) in the injection-site scRNA-seq data from 2 h p.i. samples of LNP and LNP+mRNA. The 2 h p.i. injection site cells were split according to the treatment condition, detection of spike mRNA, and cell type identities. The y-axis represents log-transformed counts of the transcripts. f The fraction of cell types in the cells with Ifnb1 transcripts. g Measured levels of IFN-β in (top) blood and (bottom) muscle samples using ELISA. All the samples were collected 4 h after injections. Data are presented as mean values ±SEM. Statistical evaluations were conducted with two-tailed Mann–Whitney U tests (ns: nonsignificant).
Fig. 5
Fig. 5. mRNA-specific induction of type I IFN responses in mDCs.
a Volcano plot showing DEGs between the mDCs from 16 h p.i. injection-site scRNA-seq data of LNP and LNP+mRNA injection. The x-axis represents log2FC of genes (positive value indicates higher expression in LNP + mRNA), and the y-axis represents −log10 values of the adjusted P values (two-tailed, Benjamini-Hochberg adjustment). b Top 10 terms from the pathway enrichment analysis (GO_Biological Process) on the upregulated DEGs of LNP+mRNA (adjusted P < 0.05 and log2FC > 1). c UMAP representation of mDC clusters. d Marker genes of the mDC clusters are displayed on a heatmap, with rows indicating representative genes and columns corresponding to cells in each mDC cluster. e, f Average expression of the transcriptional signatures of IFN-responsive dendritic cells from previous studies,, displayed (e) on the UMAP plot of mDC populations or (f) as a bar plot. Data are presented as mean values ±SEM. Statistical evaluations were performed with the Mann–Whitney U test (two-tailed, ****P < 1 × 10−4). g Fraction of mDC clusters in each injection-site scRNA-seq sample. h Experimental scheme: Mice were given intramuscular injections of LNP or LNP + mRNA and the draining lymph nodes were collected 2 or 16 h after the shot. i Average expression of the IFN-responsive dendritic cell signatures in lymph node mDC populations, as in (e). j Fraction of mDC clusters in each dLN scRNA-seq data. Schematic images were created with BioRender.com.
Fig. 6
Fig. 6. Injection-site IFN-β guides cellular immune responses against mRNA vaccine.
a Experimental and sample preparation scheme: Mice were immunized with intramuscular injection of LNP+subunit or LNP+subunit+IFN-β. Two injections were given (prime and boost shot) with 3 weeks between shots. Injection-site muscles were resected 16 h after the prime shot, and spleen tissue for the ELISpot assay was sampled 2 weeks after the boost shot. b, c PC projections of the cell type–wise DEG vectors (vs PBS injection) of 16 h p.i. samples. (b) PC1 projections and (c) PC2 projections of the DEG vectors are plotted as line plots. Line plot indicates mean values, and the error bands indicate 95% confidence intervals. d Fraction of injection-site mDC clusters in each treatment condition. e PRNT assay conducted on mice intramuscularly injected with PBS, LNP+subunit, or LNP+subunit+IFN-β. Results from IFN-γ ELISpot assay. f, g Effects of IFN-β i.m. co-injection were evaluated in (f) LNP+subunit and (g) LNP+mRNA (mRNA vaccine) vaccination strategies. h Experimental scheme: Mice were immunized with intramuscular injection of LNP+subunit or LNP+mRNA, with or without anti-IFN-β blocking antibody. Shots were given twice and the spleen samples for ELISpot assay were collected 2 weeks after the boost shot. i, j Results from the IFN-γ ELISpot assay. Effects of IFN-β blocking antibody i.m. co-injection were evaluated in (i) LNP+subunit and (j) LNP+mRNA vaccination strategies. k, l Antigen-specific T cell responses at 35 days after vaccination as determined by flow cytometry analysis. Effects of (k) IFN-β blockade and (l) IFN-β addition are evaluated in (top panels) CD8+ and (bottom panels) CD8- T cells. All the data in bar plots are presented as mean values ±SEM. All statistical evaluations were conducted with two-tailed Mann–Whitney U tests (ns: nonsignificant). Schematic images were created with BioRender.com.

References

    1. Pardi, N. et al. Nucleoside-modified mRNA vaccines induce potent T follicular helper and germinal center B cell responses. J. Exp. Med.215, 1571–1588 (2018). - DOI - PMC - PubMed
    1. Pardi, N. et al. Zika virus protection by a single low-dose nucleoside-modified mRNA vaccination. Nature543, 248–251 (2017). - DOI - PMC - PubMed
    1. Richner, J. M. et al. Modified mRNA vaccines protect against Zika virus infection. Cell169, 176 (2017). - DOI - PubMed
    1. Corbett, K. S. et al. SARS-CoV-2 mRNA vaccine design enabled by prototype pathogen preparedness. Nature586, 567–571 (2020). - DOI - PMC - PubMed
    1. Sahin, U. et al. COVID-19 vaccine BNT162b1 elicits human antibody and TH1 T cell responses. Nature586, 594–599 (2020). - DOI - PubMed

MeSH terms