. 2024 Aug 27;15(1):7402.
doi: 10.1038/s41467-024-51581-6.

Galectins induced from hemocytes bridge phosphatidylserine and N-glycosylated Drpr/CED-1 receptor during dendrite pruning

Affiliations

Galectins induced from hemocytes bridge phosphatidylserine and N-glycosylated Drpr/CED-1 receptor during dendrite pruning

Hsin-Ho Sung et al. Nat Commun. .

Abstract

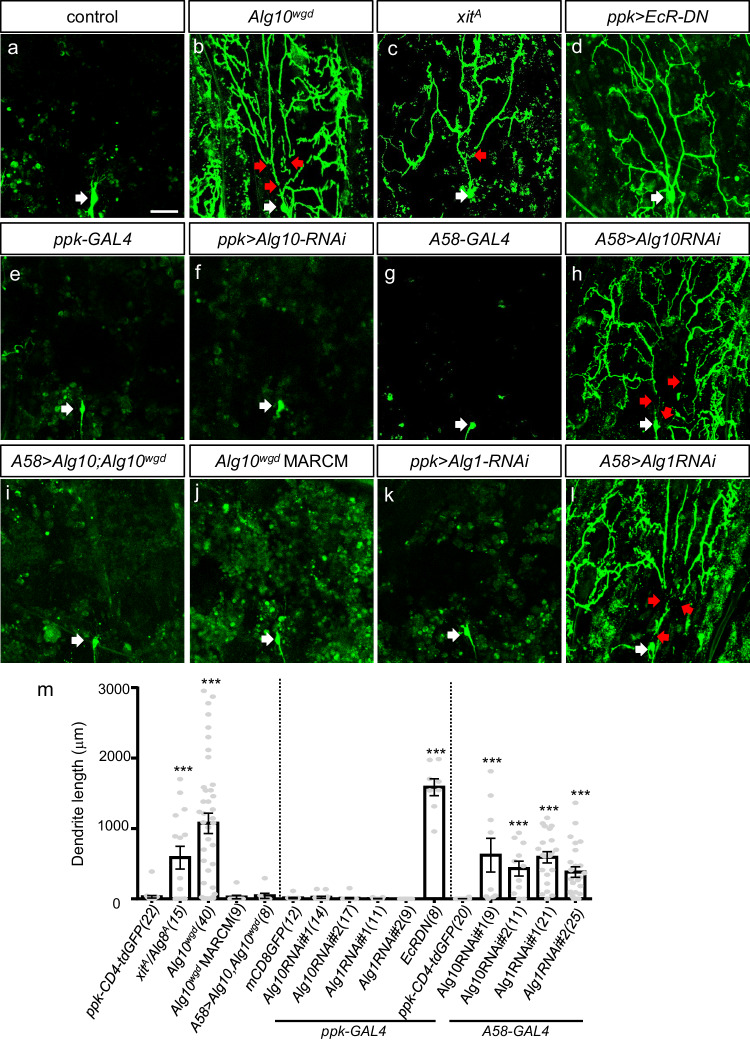
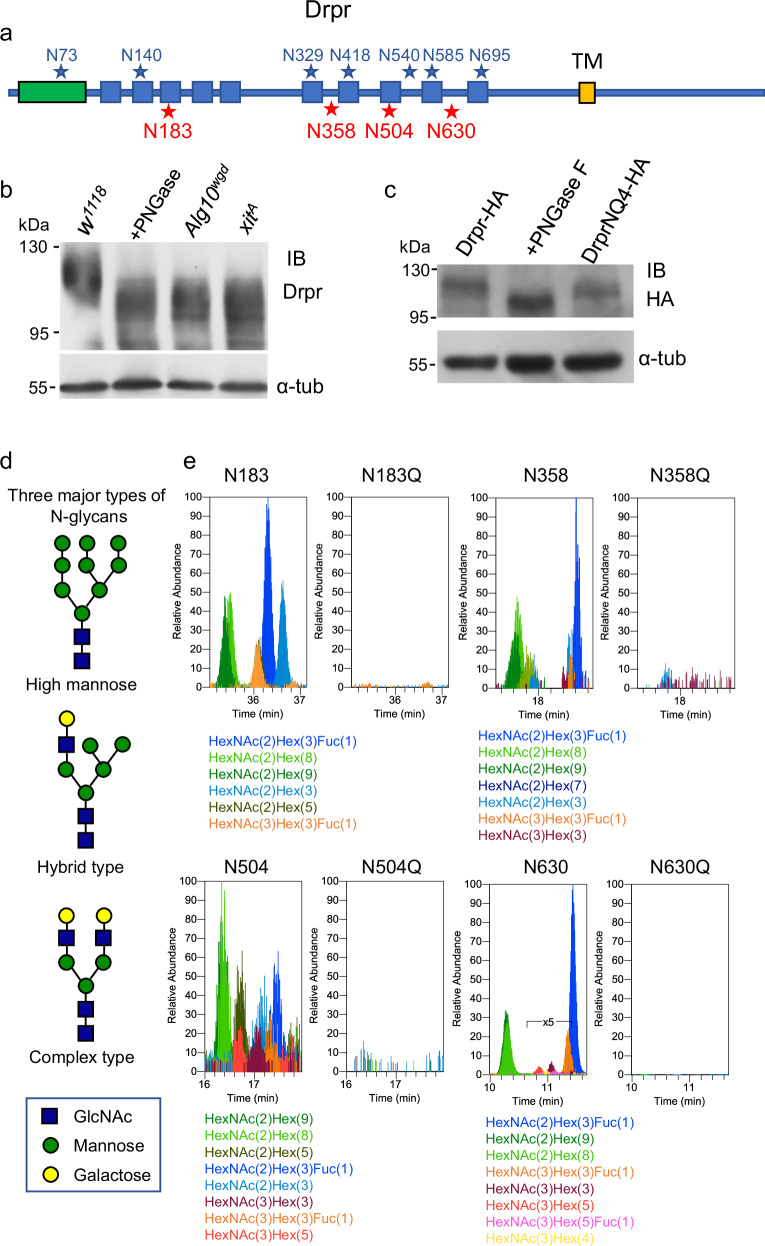
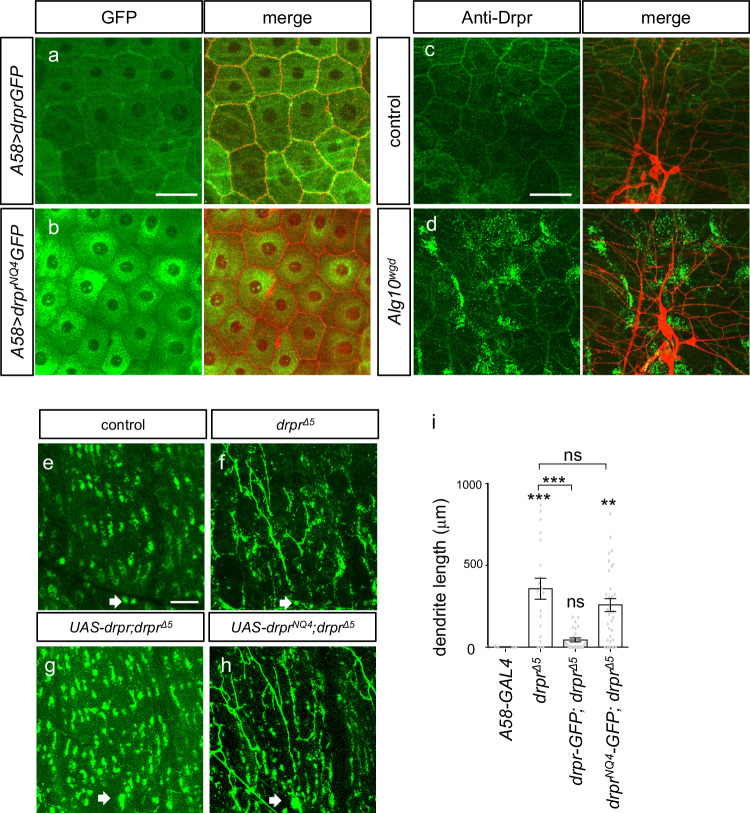
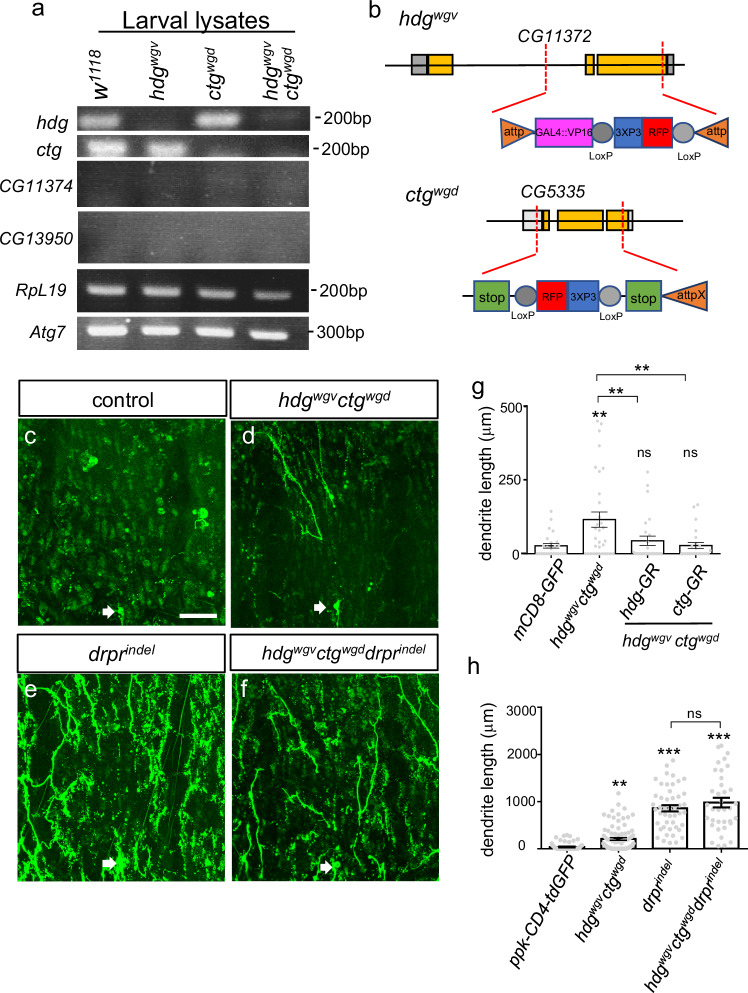
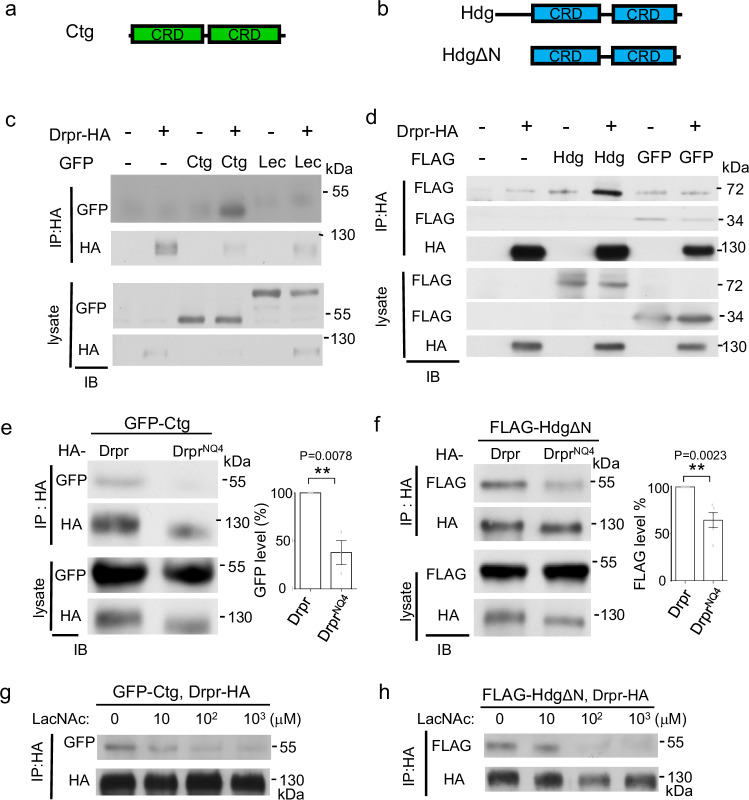
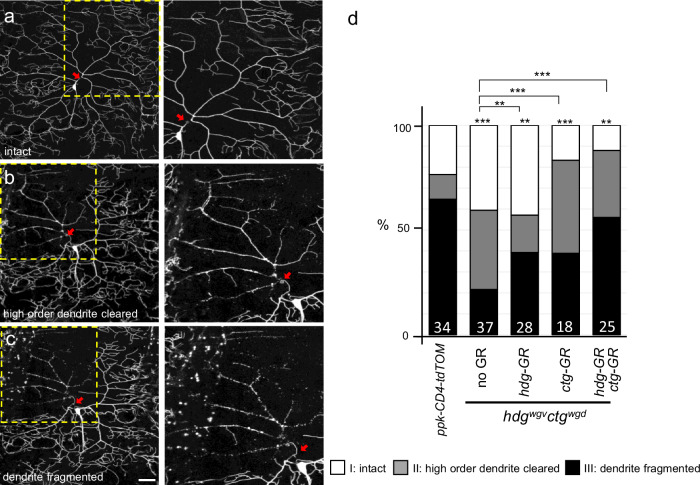
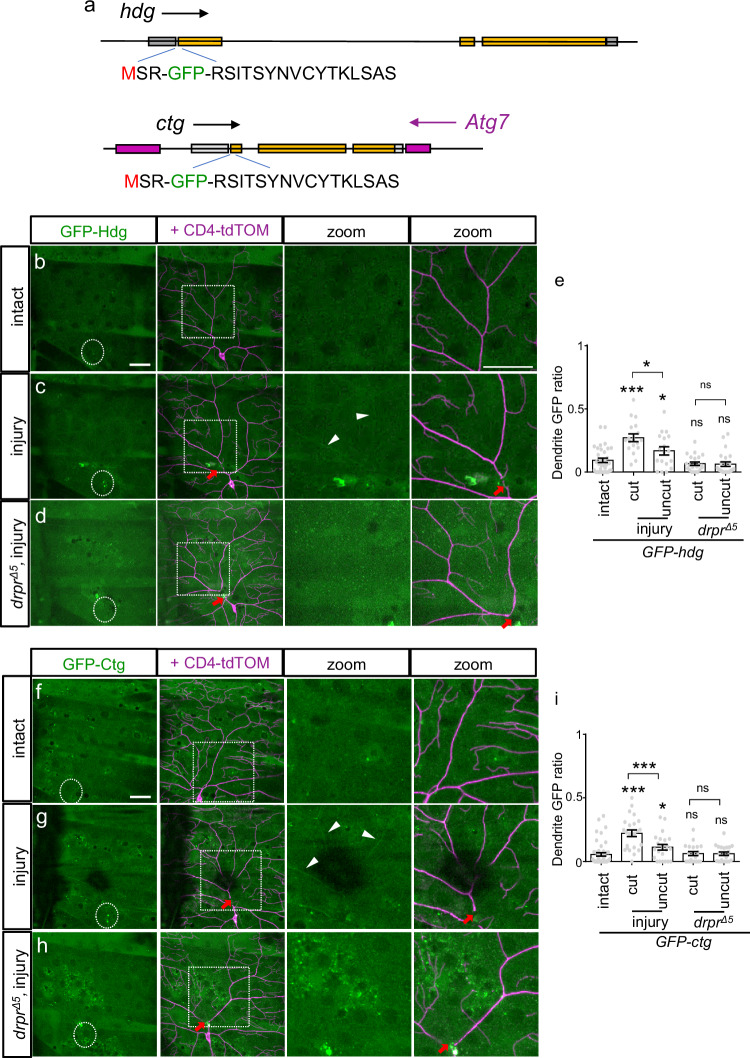
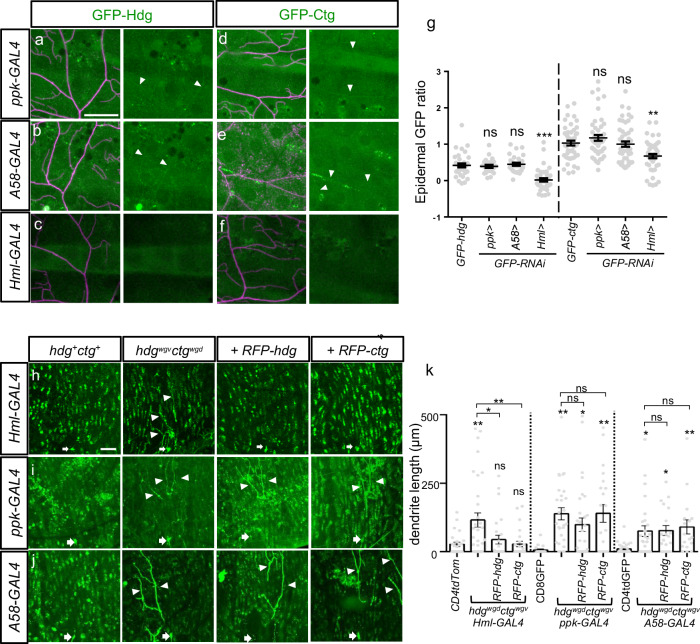
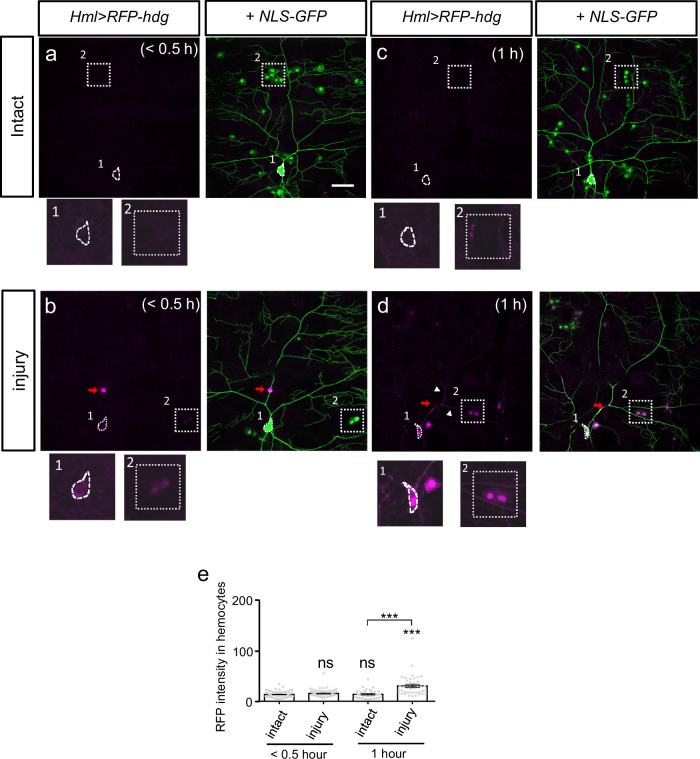
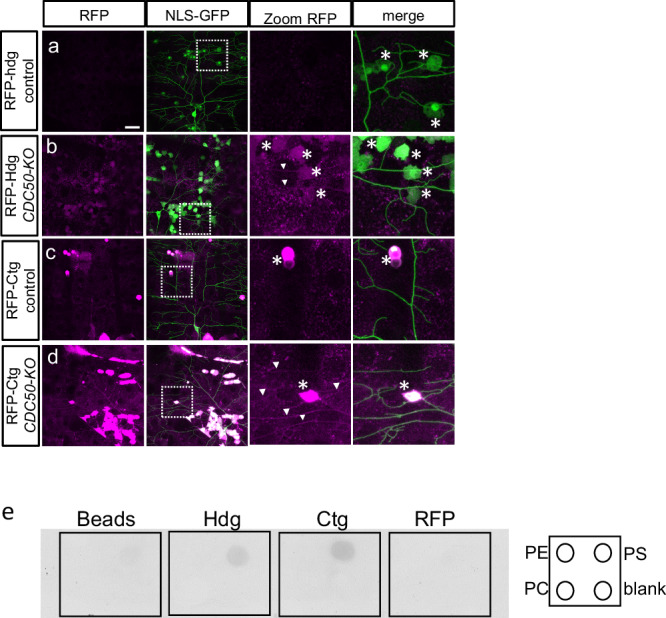
During neuronal pruning, phagocytes engulf shed cellular debris to avoid inflammation and maintain tissue homeostasis. How phagocytic receptors recognize degenerating neurites had been unclear. Here, we identify two glucosyltransferases Alg8 and Alg10 of the N-glycosylation pathway required for dendrite fragmentation and clearance through genetic screen. The scavenger receptor Draper (Drpr) is N-glycosylated with complex- or hybrid-type N-glycans that interact specifically with galectins. We also identify the galectins Crouching tiger (Ctg) and Hidden dragon (Hdg) that interact with N-glycosylated Drpr and function in dendrite pruning via the Drpr pathway. Ctg and Hdg are required in hemocytes for expression and function, and are induced during dendrite injury to localize to injured dendrites through specific interaction with exposed phosphatidylserine (PS) on the surface membrane of injured dendrites. Thus, the galectins Ctg and Hdg bridge the interaction between PS and N-glycosylated Drpr, leading to the activation of phagocytosis.


Conflict of interest statement

The authors declare no competing interests.

Figures

Fig. 1
Fig. 1. N-glycosylation in epidermal cells regulates dendritic pruning.
al Confocal images showing dendrite pruning phenotypes of C4da neurons at 16-18 hours APF. All image sizes are 300 µm x 300 µm and the scale bar in (a) is 50 µm. White arrows indicate cell bodies. Red arrows indicate severing sites. ac C4da neurons labeled by GFP expressed from ppk-CD4-tdGFP in control (a), Alg10wgd (b), and xitA (c) lines. df, k ppk-GAL4 control (e) or driving expression of EcR-DN (ppk > EcR-DN) (d), Alg10-RNAi#1 (f), or Alg1-RNAi#1 (k). Dendrites are labeled by GFP expressed from UAS-mCD8GFP. gi, l A58-GAL4 control (g) or driving expression of Alg10-RNAi#1 (h), Alg10 in Alg10wgd (i), or Alg1-RNAi#1 (l). Dendrites are labeled by GFP expressed from ppk-CD4-tdGFP. j Alg10wgd MARCM neuron generated in the line 5-40-GAL4, UAS-mCD8GFP, sop-FLP; Tub-GAL80, FRT2A/Alg10wgd FRT2A. m Three composite bar graphs (separated by dashed lines) showing quantification for average unpruned dendrite length (mean ± SEM) from confocal images (n≥ 5 larvae for each genotype). The number in the end of each label indicates the number of samples qualified. Statistical significance was determined relative to the control (first genotype in each graph) by Student’s t test, two tailed with * representing p < 0.05, ** for p < 0.01, and *** for p < 0.001.
Fig. 2
Fig. 2. Drpr is N-glycosylated.
a Schematic diagram showing the full-length Drpr protein with its various domains (EMI domain, green; EGF repeats, blue; and transmembrane domain, yellow) and N-glycosylation sites, as determined by MS. Blue stars denote paucimannose or high-mannose modifications and red stars denote hybrid and/or complex N-glycan modifications. b Western blot showing N-glycosylated Drpr at higher molecular-weight positions in w1118 control pupal lysates, and at lower molecular-weight positions in PNGase F-treated lysates, or in lysates prepared from Alg10wgd and xitA homozygous pupae. c Western blot showing Drpr-HA signals in transfected S2 cells, which shift to lower molecular-weight positions upon PNGase F treatment. DrprNQ4-HA signal migrated to the position between those of Drpr-HA and PNGase F-treated Drpr-HA. b, c the experiments were repeated at least 3 times independently with similar results. d Schematic diagrams showing three major types of N-glycans: high mannose, hybrid and complex. Blue squares: N-Acetylglucosamine (GlcNAc), green circles: mannose, and yellow circles: galactose. e Overlaid extracted ion chromatograms of the N-glycopeptides identified by LC-MS/MS for each of the four sites (N183, N358, N504, N630) of Drpr and DrprNQ4. The 5 most abundant (or 3 for N630) glycoforms along with those identified as carrying HexNAc≥3 were plotted and listed in the order of signal intensities.
Fig. 3
Fig. 3. N-glycosylation regulates Drpr localization and function.
a, b Confocal images showing localizations of Drpr-GFP (a) or DrprNQ4-GFP (b), with their expression driven by A58-GAL4 in epidermal cells at larval stages. GFP signals in green and DE-cadherin in red in merged images. Scale bar in (a), 50 µm. c, d Confocal images showing endogenous Drpr signals in w1118 (c) or Alg10wgd (d) larval epidermal cells. Scale bar in (c), 50 µm. ad repeated at least 3 times independently with similar results. eh Confocal images showing ppk-CD4-tdGFP dendrites at 14 hours APF in control (e), drprΔ5 (f), or the UAS-drpr-GFP (g) or UAS-drprNQ4-GFP (h) transgene driven by A58-GAL4 in the drprΔ5 mutant. White arrows indicate cell bodies. Scale bar in (e), 50 µm. i Bar graph showing quantification for average dendrite length (mean ± SEM) at 14 hours APF (32≥n ≥ 9 for each genotype). One-way ANOVA followed by Tukey’s post-hoc test was used to determine statistical significance, with ** for p < 0.01, *** for p < 0.001, and ns for no significant difference relative to control or to drprΔ5. p < 0.0001 in (i).
Fig. 4
Fig. 4. ctg and hdg function in the drpr pathway for dendritic pruning.
a Detection of hdg/CG11372, ctg/CG5335, CG11374, CG13950, RpL19, and Atg7 mRNA expressions by RT-PCR in larval lysates prepared from the w1118, hdgwgv, ctgwgd and hdgwgv ctgwgd lines. The experiment was repeated twice independently with similar results. b Schematics showing the designs to generate the hdgwgv and ctgwgd alleles by CRISPR-Cas9. Yellow and gray boxes represent coding regions and the untranslated regions of CG11372 and CG5335, respectively. In hdgwgv, part of intron 1 and exons 2 and 3 were replaced by GAL4-VP16 and 3xP3-RFP sequences. In ctgwgd, sequences from exon 1 to exon 3 were replaced by 3xP3-RFP and stop codons. The 3xP3-RFP cassette (red/blue boxes) in both alleles were removed by recombination of flanking LoxP sequences (gray circles). The attp and attpX sequences (orange triangles) for chromosomal landing and stop codons are also shown. cf Confocal images showing dendrites of C4da neurons at 14 hours APF for the ppk-CD4-tdGFP control (c), hdgwgv ctgwgd (d), drprindel (e), and hdgwgv ctgwgd drprindel (f) lines. White arrows indicate cell bodies. Scale bar in (c), 50 μm. g, h Quantification of unpruned dendritic lengths (mean ± SEM) at 14 hours APF for C4da neurons labeled by GFP from co-expressed UAS-mCD8-GFP, 32≥n≥ 25 in each genotype (g) or ppk-CD4-tdGFP, 88≥n≥ 36 in each genotype(h). Statistical significance was determined by one-way ANOVA with Tukey’s post-hoc test, with * representing p < 0.05, ** for p < 0.01, *** for p < 0.001, and ns for no significant difference. p = 0.0001 in (g), and p < 0.0001 in (h).
Fig. 5
Fig. 5. LacNAc-dependent interaction of Ctg and HdgΔN with Drpr.
a, b Schematic diagrams showing full-length Ctg (a), and full-length Hdg and N-terminus-truncated HdgΔN (b). c, d S2 cells were transfected with drpr-HA and GFP-ctg or GFP-Lec24Db (c), or with drpr-HA and FLAG-hdg or FLAG-GFP (d). Cell lysates immunoprecipitated (IP) with HA antibodies were subjected to Western blot (IB) analyzes by GFP, HA or FLAG antibodies. e, f S2 cells were transfected with GFP-ctg and drpr-HA or drprNQ4-HA (e) or with FLAG-hdgΔN and drpr-HA or drprNQ4-HA (f). Cell lysates were subjected to immunoprecipitation by HA antibodies and to Western blot analyzes using HA, GFP and FLAG antibodies. Bar graphs showing quantification of GFP-Ctg, e or FLAG-HdgΔN, f level normalized to respective Drpr-HA or DrprNQ4-HA level, with averages (mean ± SEM) shown from Western blots. Statistical significance was determined by Student’s t test, two tailed with ** representing p < 0.01. p = 0.0076 in (e), and p = 0.00227 in (f). g, h Western blots showing transfected S2 cell lysates immunoprecipitated by HA antibodies for Drpr-HA in the presence of 0, 10, 100 and 1000 μM of 3’-O-sialic acid-LacNAc. The HA immunoprecipitates were immunoblotted with anti-GFP for GFP-Ctg (g) or anti-FLAG for FLAG-HdgΔN (h). ch the experiments were repeated at least 3 times independently with similar results.
Fig. 6
Fig. 6. ctg and hdg function in dendritic degeneration post dendrotomy.
ac Confocal images of C4da neurons labeled by ppk-CD4-tdTom expression, showing an example of intact dendrites without degeneration (a), an example of higher-order branch clearance (b), or an example of higher-order dendrite clearance plus lower-order segment fragmentation (c) at 5.5-6.5 hours post dendrotomy. Red arrows indicate the injury sites. The areas encompassed by yellow dashed lines are shown as zoomed-in images at right. Scale bar in (c), 50 µm. d Quantification of dendrites that remained intact (white bars), higher-order branch clearance (gray bars) or lower-order segment fragmentation (black bars) at 5.5–6.5 hours post dendrotomy. The number in each bar graph indicates the number of samples qualified. Chi-square analyzes were used to determine statistical significance, with *** representing p < 0.001, ** representing p < 0.01, and ns for no significant difference.
Fig. 7
Fig. 7. Dendritic localization of Hdg and Ctg upon dendrotomy.
a Schematics showing the designs of the GFP-hdg (top) and GFP-ctg (bottom) knock-in alleles. In both alleles, the GFP sequence was inserted after the Met start codon with two linkers SR and RSITSYNVCYTKLSAS. bd, fh Confocal images showing signals of GFP-Hdg (bd) at 1.5 hours post-dendrotomy, and GFP-Ctg (fh) at 3.5 hours post-dendrotomy in body segments without dendrotomy (b, f), with dendrotomy (c, g), or with dendrotomy in drprΔ5 (d, h). Dendrites were marked by ppk-CD4-tdTOM expression and boxed areas have been enlarged at right. Red arrows indicate ablation sites, white arrowheads indicate GFP signals at ablated branches, and white dashed circles indicate cell bodies. Scale bars in (b) and (f) are 50 µm. e, i Quantification of GFP intensities at intact and injured dendrites. Cut and uncut branches from the injured dendrites were separately scored. The epidermal GFP intensity was subtracted from the dendritic GFP signal intensities, which then was normalized to the epidermal GFP intensity to be shown as ratios (mean ± SEM). 34≥n ≥18 for each genotype in (e), and 46≥n ≥20 for each genotype in (i). One-way ANOVA with Tukey’s post-hoc test was performed to determine statistical significance by comparing to the intact dendrite or by comparing between cut and uncut branches of the same dendrites, and shown as * representing p < 0.05, ** for p < 0.01, *** for p < 0.001, and ns for no significant difference. p = 0.0041 in (e), and p < 0.0001 in (i).
Fig. 8
Fig. 8. Hdg and Ctg are induced in hemocytes upon dendrotomy.
af Confocal images of C4da neurons labeled by ppk-CD4-tdTom in the GFP-hdg knock-in line at 1.5 hours post-dendrotomy (ac), or in the GFP-ctg knock-in line at 3.5 hours post-dendrotomy (df). UAS-GFP-RNAi transgene was driven by ppk-GAL4 (a, d), A58-GAL4 (b, e) or Hml-GAL4 (c, f). Scale bar in (a), 50 µm. g Two composite bar graphs (separated by dashed line) show quantification for relative GFP intensities (mean ± SEM) at the epidermal cell level to a non-GFP control background. 51≥n ≥24 for each genotype. One-way ANOVA followed by Tukey’s post-hoc test was used to determine statistical significance, with ** for p < 0.01, *** for p < 0.001, and ns for no significant difference relative to GFP-hdg or GFP-ctg. p < 0.0001 in GFP-hdg dataset, and p < 0.0001 in GFP-ctg dataset. hj Confocal images of C4da neurons at 14 hours APF in control hdg+ ctg+, hdgwgvctgwgd double mutant, or double mutant carrying UAS-RFP-hdg or UAS-RFP-ctg transgene driven by Hml-GAL4 (h), ppk-GAL4 (i) or A58-GAL4 (j). Scale bar in (h), 50 µm. White arrows indicate cell bodies and arrowheads indicate unpruned dendrites. k Bar graphs show quantification for dendritic length (mean ± SEM) from confocal images. 36 ≥ n ≥ 17 for each genotype. Statistical significance relative to the control (First bar in each graph denotes dendrite marker) was determined by one-way ANOVA followed by Tukey’s post-hoc test, with * representing p < 0.05, ** representing p < 0.01, *** for p < 0.01, and ns for no significance. p = 0.0008 in Hml-Gal4 rescuing dataset, p = 0.0019 in ppk-GAL4 rescuing dataset, p = 0.0012 in A58-GAL4 rescuing dataset.
Fig. 9
Fig. 9. Hdg induction in hemocytes upon dendrotomy.
ad Confocal images showing C4da neurons labeled by ppk-CD4-tdGFP expression, and hemocytes with Hml-GAL4-driven RFP-hdg and NLS-GFP expressions. Confocal images were taken at 0-0.5 hours(a, b) or 1 hour (c, d) post-dendrotomy in two adjacent hemisegments of the same larva, with (a, c) for neurons not subjected to dendrotomy, and (b, d) for neurons subjected to dendrotomy. Red arrows indicate the injury sites and white arrowheads indicate RFP signal at dendrites. The areas within white dashed lines are shown in zoomed-in images at bottom, with “1” for cell body, and “2” for representative hemocytes. Scale bar in (a), 50 µm. e Quantitative analysis of RFP signal intensities (mean ± SEM) in hemocytes of Hml > RFP-hdg larvae at 0–0.5 hours and 1 hour with or without dendrotomy. 79≥n≥40 for each genotype. Statistical significance relative to the intact control was determined by one-way ANOVA followed by Tukey’s post-hoc test, with *** for p < 0.001, and ns for no significance. P < 0.0001 in (e).
Fig. 10
Fig. 10. Hdg and Ctg interact with PS.
ad Confocal images of C4da neurons labeled by ppk-CD4-tdGFP expression and hemocytes labeled by Hml-GAL4-driven NLS-GFP. Asterisks indicate hemocytes and white arrowheads indicate dendritic RFP signal. Boxed areas have been enlarged at right. a, b Hml-GAL4-driven expression of RFP-hdg or c, d RFP-ctg in hemocytes. a, c Wild-type CDC50 control and b, d CDC50 knockout. ad the experiments were repeated at least 3 times independently with similar results. e Membrane strips dotted with PE, PC, and PS were immuno-blotted with Flag-tagged Hdg, Ctg or RFP. A schematic showing the position of different lipids on the membrane strips. PE phosphatidylethanolamine, PC phosphatidylcholine, PS phosphatidylserine; and a blank control.

Similar articles

Cited by

References

    1. Luo, L. & O’Leary, D. D. Axon retraction and degeneration in development and disease. Annu Rev. Neurosci.28, 127–156 (2005). 10.1146/annurev.neuro.28.061604.135632 - DOI - PubMed
    1. Schuldiner, O. & Yaron, A. Mechanisms of developmental neurite pruning. Cell Mol. Life Sci.72, 101–119 (2015). 10.1007/s00018-014-1729-6 - DOI - PMC - PubMed
    1. Soyon Hong, V. F. B.-G. et al. Complement and microglia mediate early synapse loss in Alzheimer mouse models. Science352, 712–716 (2016). 10.1126/science.aad8373 - DOI - PMC - PubMed
    1. Wishart, T. M. Synaptic Vulnerability in Neurodegenerative Disease. J. Neuropathol. Exp. Neurol.65, 733–739 (2006). 10.1097/01.jnen.0000228202.35163.c4 - DOI - PubMed
    1. Zhou, Z., Hartwieg, E. & Horvitz, H. R. CED-1 is a transmembrane receptor that mediates cell corpse engulfment in C-elegans. Cell104, 43–56 (2001). 10.1016/S0092-8674(01)00190-8 - DOI - PubMed

LinkOut - more resources