. 2024 Aug 27;15(1):7372.
doi: 10.1038/s41467-024-50925-6.

Tyrosine phosphorylation of both STAT5A and STAT5B is necessary for maximal IL-2 signaling and T cell proliferation

Affiliations

Tyrosine phosphorylation of both STAT5A and STAT5B is necessary for maximal IL-2 signaling and T cell proliferation

Jian-Xin Lin et al. Nat Commun. .

Abstract

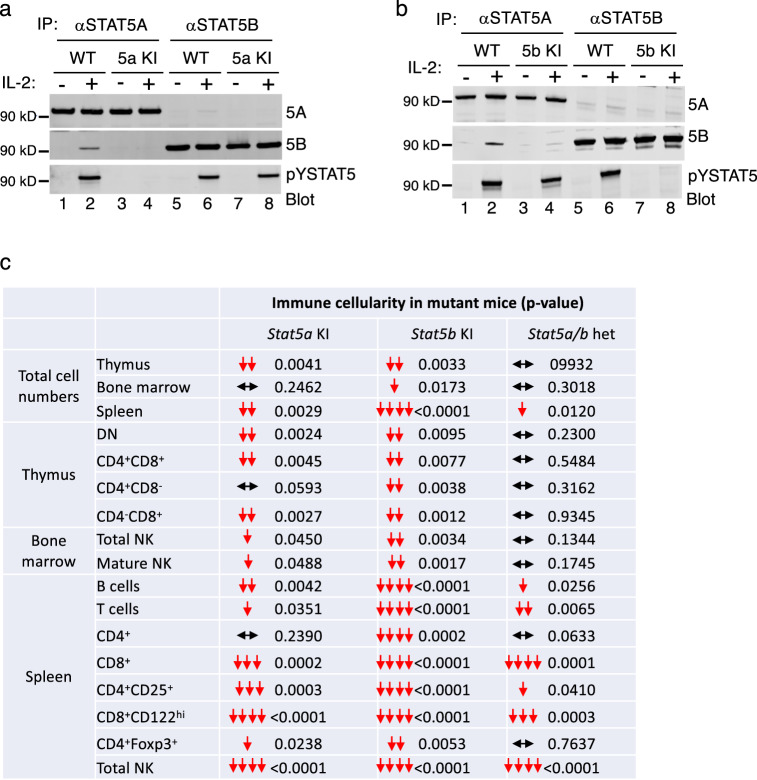
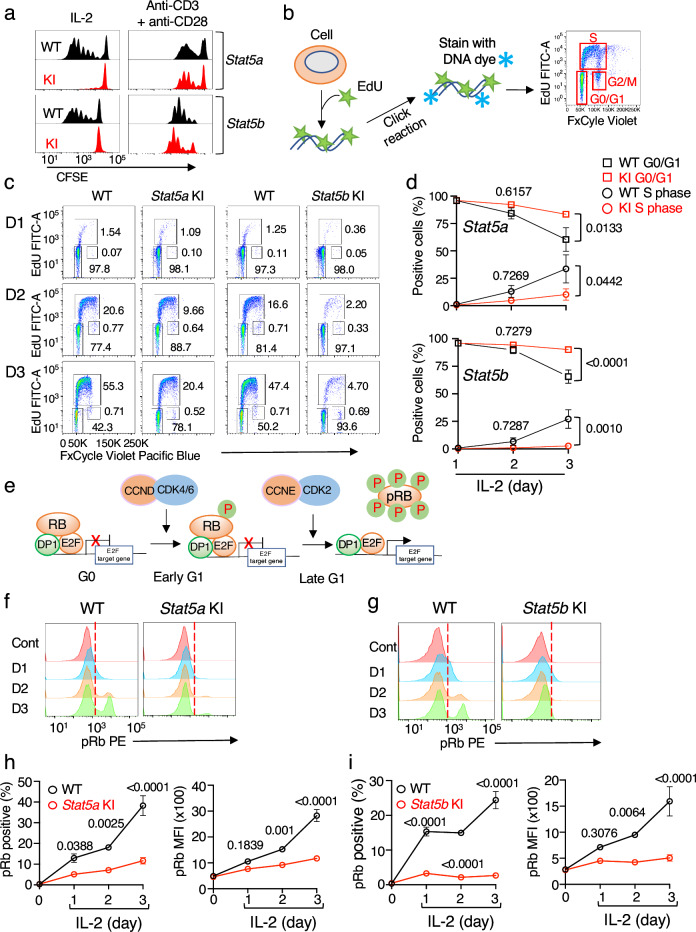
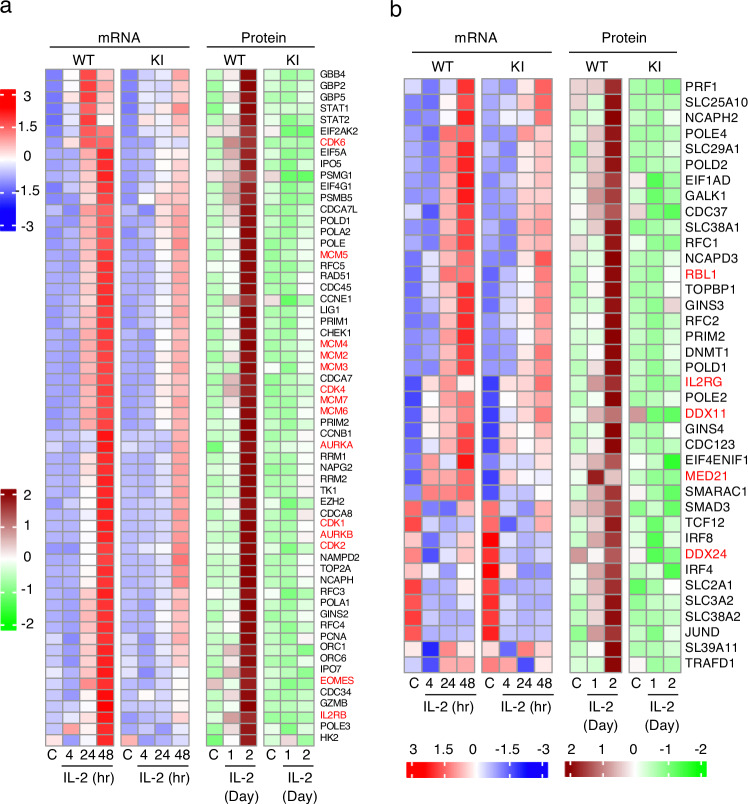
Cytokine-mediated STAT5 protein activation is vital for lymphocyte development and function. In vitro tyrosine phosphorylation of a C-terminal tyrosine is critical for activation of STAT5A and STAT5B; however, the importance of STAT5 tyrosine phosphorylation in vivo has not been assessed. Here we generate Stat5a and Stat5b tyrosine-to-phenylalanine mutant knockin mice and find they have greatly reduced CD8+ T-cell numbers and profoundly diminished IL-2-induced proliferation of these cells, and this correlates with reduced induction of Myc, pRB, a range of cyclins and CDKs, and a partial G1→S phase-transition block. These mutant CD8+ T cells also exhibit decreased IL-2-mediated activation of pERK and pAKT, which we attribute in part to diminished expression of IL-2Rβ and IL-2Rγ. Our findings thus demonstrate that tyrosine phosphorylation of both STAT5A and STAT5B is essential for maximal IL-2 signaling. Moreover, our transcriptomic and proteomic analyses elucidate the molecular basis of the IL-2-induced proliferation of CD8+ T cells.


Conflict of interest statement

The authors declare no competing interests.

Figures

Fig. 1
Fig. 1. Normal STAT5 protein expression but fewer T, B, and NK cells in Stat5a KI and especially in Stat5b KI mice.
a, b Immunoblots of anti-STAT5A, anti-STAT5B, and anti-pSTAT5 antibodies. a Immunoprecipitation of total cell lysates from control or IL-2-stimulated WT and Stat5a KI T cells with anti-STAT5A and anti-STAT5B, respectively, and blotting with antibodies to STAT5A, STAT5B, and pYSTAT5. b Immunoprecipitation of total cell lysates from control or IL-2 stimulated WT and Stat5b KI T cells followed by blotting with anti-STAT5A, anti-STAT5B, and anti-pYSTAT5. Source data for a and b are provided as a Source Data File. c Summary of cellularity of Stat5a KI, Stat5b KI, and Stat5a/b heterozygous thymocytes, bone marrow NK cells, and splenic T, B, and NK cells. The numbers are the p-values that are derived from Fig. 2b, d, f, h, j, Supplementary Fig. 2a, c, d, f, h, j, l, and Supplementary Fig. 3a, c, e, g (In the source data file, the raw data are shown separately for each of these main and Supplementary Figs. rather than for c); the red arrows show statistically significant decreases in cells in KI as compared to WT mice, and the horizontal black arrow lines indicate populations that are not significantly different in KI and WT. Source data are provided as a Source Data File.
Fig. 2
Fig. 2. Fewer CD8+ T cells, and decreased CD4+CD25+ and CD8+CD122hi T cell numbers in Stat5a KI and Stat5b KI mice.
a Representative flow cytometric profiles of splenic CD4+ and CD8+ T cells in WT and Stat5a KI (top panels) and WT and Stat5b KI (bottom panels) mice. b Summary of the frequencies (left graph) and numbers (right graph) of splenic CD4+ and CD8+ T cells in WT and Stat5a KI and Stat5b KI mice (n = 13 for Stat5a WT CD4+ T cells, n = 12 for Stat5a KI CD4+ T cells, n = 12 for Stat5b WT CD4+ T cells, n = 12 for Stat5b KI CD4+ T cells, n = 13 for Stat5a WT CD8+ T cells, n = 12 for Stat5a KI CD8+ T cells, n = 11 for Stat5b WT CD8+ T cells, and n = 12 for Stat5b KI CD8+ T cells). c Representative flow cytometric profiles of splenic CD4+CD25+ T cells in WT and Stat5a KI (left panels) and WT and Stat5b KI (right panels) mice. d Summary of the frequencies (left graph) and numbers (right graph) of spleen CD4+CD25+ T cells in WT and Stat5a KI and Stat5b KI mice (n = 12 for both Stat5a WT and Stat5a KI mice and n = 6 for both Stat5b WT and Stat5b KI mice). e Representative flow cytometric profiles of spleen CD4+Foxp3+ T cells in WT and Stat5a KI (left panels) and WT and Stat5b KI (right panels) mice. f Summary of the frequencies (left graph) and numbers (right graph) of spleen CD4+Foxp3+ T cells in WT and Stat5a KI and Stat5b KI mice (n = 12 for Stat5a WT mice, n = 11 for Stat5a KI mice, n = 8 for both Stat5b WT and Stat5b KI mice). g Representative flow cytometric profiles of spleen CD8+CD122hi T cells in WT and Stat5a KI (left panels) and WT and Stat5b KI (right panels) mice. h Summary of the frequencies (left graph) and numbers (right graph) of spleen CD8+CD122hi T cells in WT and Stat5a KI and Stat5b KI mice (n = 13 for Stat5a WT, n = 11 for Stat5a KI, n = 11 for Stat5b WT, and n = 12 for Stat5b KI). i Representative flow cytometric profiles of T (left four panels) and CD8+ T cells (right four panels) in WT and Stat5a KI (upper panels) and Stat5b KI (lower panels) mice on day 7 after PBS or IL-2 injection. j Bar graphs showing numbers of CD3+ and CD3+CD8+ T cells in WT and Stat5a KI and Stat5b KI mice on day 7 after PBS (n = 3) or IL-2 injection (n = 5). The gating strategies for a, c, e, g, and i are shown in Supplementary Fig. 8. The numbers in a, c, e, g, and i are percentage of gated cells; in graphs b, d, f, h, and j, black and red open bars represent WT and mutants, respectively, and the error bars (SD) and p-values are shown, which were determined by multiple unpaired t test using two-stage step-up method of Benjamini, Krieger and Yekutieli. Source data for b, d, f, h, and j are provided as a Source Data File.
Fig. 3
Fig. 3. Defective IL-2-induced proliferation, reduced cell cycle progression, and lower levels of pRB in Stat5a KI and Stat5b KI CD8+ T cells.
a Representative flow cytometric profiles of two CFSE dilution experiments using freshly isolated WT (top and third panels), Stat5a KI (second panel), and Stat5b KI (bottom panel) CD8+ T cells were cultured with 500 IU/ml IL-2 for 4 days (left panels) or with plate bound anti-CD3 and soluble anti-CD28 for 3 days (right panels). b Schematic showing the Click-IT EdU assay and flow cytometric profiles of cells at the G0/G1, S, and G2/M phases of the cell cycle. c Representative flow cytometric profiles of two experiments show cell cycle progression of WT, Stat5a KI, and Stat5b KI splenic CD8+ T cells stimulated by 500 IU/ml of IL-2 using Click-iT EdU assays; the numbers are the percentages of gated populations. d Percentage of WT (black lines, n = 4), Stat5a KI (red lines in top graph, n = 4), and Stat5b KI (red lines in bottom graph, n = 3) cells at G0/G1 phase (EdU-FxCycle violet-), S phases (EdU+), and G2/M phases (EdU-FxCycle violet+). The error bars and p-values are shown, which were determined by Two-way ANOVA multiple comparisons using the Šídák hypothesis test. In d, each data point represents 4 biological replicates combined from two independent experiments, and each biological replicate was derived from the combined cells from two Stat5a KI mice or three Stat5b KI mice. e Schematic showing phosphorylation of RB by CCND/CDK4/6 at early G1 phase and then by CCNE/CDK2 at late G1 phase to release pRB from DP1-E2F and turn on DP1-E2F-mediated transcription of their target genes. f and g Representative flow cytometric profiles of pRB levels from two independent experiments in WT (left panels), Stat5a KI (f, right panel) and Stat5b KI (g, right panel) CD8+ T cells during a 3-day IL-2 stimulation. The vertical dashed lines indicate the gates for the percentages of cells in f and g. The gating strategies for a, c, f, and g are shown in Supplementary Fig. 9. h and i Data were combined from two independent experiments to show the percentage of pRB+ cells and pRB levels (MFI) in CD8+ T cells from WT littermate (black lines, n = 4 for Stat5a and Stat5b), Stat5a KI (h, red line, n = 4), and Stat5b KI (i, red line, n = 4) mice; error bars (SEM) and p-values are shown, which were determined by multiple unpaired t test using the Holm-Šídák method. Source data for d, h, and i are provided as a Source Data File.
Fig. 4
Fig. 4. Lower pERK and pAKT levels in STAT5 KI splenic CD8+ T cells stimulated by IL-2, with fewer CD8+CD44hiCD122hiCD49dlo virtual memory cells in these mice.
Time course experiments of IL-2-activated pSTAT5 (a, n = 4), pERK (b, n = 4), and pAKT (c, n = 4) in WT (black lines), Stat5a KI (top graphs, red lines), and Stat5b KI (bottom graphs, red lines) CD8+ T cells. Each data point represents 4 biological replicates combined from two independent experiments, and each biological replicate was derived from the combined cells from two Stat5a KI mice or three Stat5b KI mice. Error bars (SEM) and p-values are shown. Representative flow cytometric profiles of CD8+ T cells that were stained with antibodies to CD44 (d, n = 6), CD122 (f, n = 6), and CD49d (h, n = 6). Cell numbers of CD8+ T cells that express CD44 (e), CD122 (g), and CD44 and CD49d (i) in WT (black bars/circles), Stat5a KI and Stat5b KI (red bars/circles) cells. Also shown are error bars (SEM) and p-values determined by multiple unpaired t test using the Holm-Šídák method. j Representative flow cytometric profiles of CD8+CD44hiCD122lo and CD8+CD44hiCD122hi memory phenotype T cells in WT, Stat5a KI, and Stat5b KI mice. k Frequency of CD8+ memory phenotype T cells in WT (n = 7 for Stat5a WT and Stat5b WT, respectively), Stat5a KI (n = 7), and Stat5b KI (n = 7) mice. The gating strategies for d, f, h, and j are shown in Supplementary Fig. 10. The numbers in f are MFI values of gated area, and d, h, and j are percentage of gated cells; in graphs e, g, i, and k, black and red open bars represent WT and mutants, respectively, and the error bars (SEM) and p-values are shown, which were determined by multiple unpaired t test using the Holm-Šídák method. Source data for ac, e, g, i, and k are provided as a Source Data File.
Fig. 5
Fig. 5. Dysregulation of a broad range of IL-2-induced genes in Stat5 KI CD8+ T cells.
a Venn diagrams of the number of shared and uniquely expressed mRNAs whose expression was lower in Stat5a KI and/or Stat5b KI CD8+ T cells as compared to WT cells. b Bubble plot showing top 10 dysregulated genesets shared in Stat5a KI (red bubbles) and Stat5b KI (bluish green bubbles) CD8+ T cells in response to IL-2 stimulation. The -Log10 adjusted p-value is indicated by the size of the dots. c Shown are MYC_TARGET_V1, E2F_TARGET, G2M_TARGET, and MTORC1_TARGET genesets identified by GSEA. Data from cells stimulated by IL-2 for 48 hr were used to generate ac. d Heatmaps showing examples of dysregulated mRNAs in Stat5a KI and Stat5b KI CD8+ T cells in response to IL-2, including those for Transcription factors, DNA replication, DNA repair, Transcription, Translation, and Solute carriers. Myc, E2f1, E2f2, E2f3, and Tfdp1 are highlighted in red. e Violin plot of normalized IL-2-induced STAT5 binding peaks in Stat5a KI, Stat5b KI, and their corresponding WT CD8+ T cells. Source data for e are provided as a Source Data File. f Histographs (top) and heatmap (bottom) comparing IL-2-induced STAT5 binding peaks in WT vs. Stat5a KI and WT vs. Stat5b KI CD8+ T cells. g Scatter plots showing log2(FC) of mRNA (x axis) induced by IL-2 and log2(FC) of STAT5 binding (y axis) in WT versus Stat5a KI (top panel) and WT versus Stat5b KI (bottom panel) CD8+ T cells. Blue dots show low mRNA expression in WT cells, and red dots show higher mRNA expression in mutant cells. The number of genes is indicated.
Fig. 6
Fig. 6. Decreased expression of Myc, E2F1, CCND1, CCNA2, CCNE, CDK2, CDK4, CDK6, and CDK7 in IL-2-stimulated Stat5 KI CD8+ T cells.
a Schematic showing that expression of Myc leads to upregulation of E2F and E2F target genes, including Myc itself.) b and c Showing representative western blots of Myc expression from two experiments in freshly isolated WT and Stat5a KI (b) and WT and Stat5b KI (c) CD8+ T cells stimulated by IL-2 for indicated time points. Line graph on the right of each panel shows Myc levels normalized by blotting with anti-β-actin (b for Stat5a KI and c for Stat5b KI samples). Source data for b and c are provided as a Source Data File. d Heatmap showing selected cell-cycle related mRNAs whose expression was attenuated in Stat5a KI and Stat5b KI CD8+ T cells in response to IL-2 stimulation. e Percentage of cells expressing E2F1, CCND1, CCNA2, and CCNE, as indicated, in WT (black open bars), Stat5a KI (top panels, red open bars) and Stat5b KI (bottom panels, red open bars) CD8+ T cells simulated by IL-2; n = 4 for Stat5a WT, n = 5 for Stat5a KI, n = 4 for both Stat5b WT and Stat5b KI. f Percentage of cells expressing CDK7, CDK2, CDK4, and CDK6 in WT (black open bars), Stat5a KI (top panels, red open bars) and Stat5b KI (bottom panels, red open bars) CD8+ T cells simulated by IL-2. e, f Shown are combined data from two independent experiments using Stat5a CD8+ T cells (top panels) and Stat5b CD8+ T cells (bottom panels). Each data point represents 4 or 5 biological replicates (n = 4 for Stat5a WT, n = 5 for Stat5a KI, n = 5 for Stat5b WT and n = 4 for Stat5b KI) and each biological replicate was derived from the combined cells from three Stat5b KI mice. Also shown are error bars (SEM) and p-values determined by multiple unpaired t test using the Holm-Šídák method. Source data for b, c, e, and f are provided as a Source Data File. g Schematic showing CDK7 as a key component of CDK activating kinase (CAK) that phosphorylates DNA polymerase II to regulate gene transcription.
Fig. 7
Fig. 7. Dysregulated protein expression in Stat5a KI CD8+ T cells identified by global proteomics analysis.
a Heatmap showing mRNAs and proteins similarly dysregulated in Stat5a KI cells identified by RNA-seq and MS. CDK1, CDK2, CDK4, CDK6, MCM2, MCM3, MCM4, MCM5, MCM6, MCM7, AURKA, AURKB, IL2RB, and EOMES are highlighted in red. b Heatmap of selected mRNAs that were not dysregulated or only modestly dysregulated (FC < 2) in Stat5a KI CD8+ T cells, but whose corresponding protein levels were significantly lower in the KI cells as compared to WT cells in response to IL-2 stimulation. RBL1, IL2RG, DDX11, MED21, and DDX24 are highlighted in red.
Fig. 8
Fig. 8. Molecular basis of defective IL-2-induced proliferation in Stat5 KI CD8+ T cells.
Schematic showing that activation of MAPK, STAT5, and PI3K pathways by IL-2 in freshly isolated WT CD8+ T cells induces increased expression of genes at the mRNA and/or protein levels that are important for cell-cycle progression and proliferation, including IL-2Rβ, IL-2Rγ, solute carriers, transporters, nuclear pore components, as well as molecules involved in mitochondrial metabolism, transcription, DNA replication, DNA repair, translation, and protein degradation. The protein expression of IL-2-induced genes in these processes was defective in Stat5 KI cells. The genes shown in red were significantly induced by IL-2 (FC ≥ 2) in WT cells but had markedly diminished induction in Stat5 KI cells. Abbreviations: BER, base excision repair; NER, nucleotide excision repair; MMR, mismatch mediated repair; HR, homologous recombination, and NHEJ for non-homologous end-joining. This figure was generated using BioRender (BioRender agreement number AP26LFT6A4).

References

    1. Wakao, H., Gouilleux, F. & Groner, B. Mammary gland factor (MGF) is a novel member of the cytokine regulated transcription factor gene family and confers the prolactin response. EMBO J.13, 2182–2191 (1994). - PMC - PubMed
    1. Lin, J. X., Mietz, J., Modi, W. S., John, S. & Leonard, W. J. Cloning of human Stat5B. Reconstitution of interleukin-2-induced Stat5A and Stat5B DNA binding activity in COS-7 cells. J. Biol. Chem.271, 10738–10744 (1996). - PubMed
    1. Copeland, N. G. et al. Distribution of the mammalian Stat gene family in mouse chromosomes. Genomics29, 225–228 (1995). - PubMed
    1. Leonard, W. J., Lin, J. X. & O’Shea, J. J. The gamma(c) Family of Cytokines: Basic Biology to Therapeutic Ramifications. Immunity50, 832–850 (2019). - PubMed
    1. Lin, J. X. et al. The role of shared receptor motifs and common Stat proteins in the generation of cytokine pleiotropy and redundancy by IL-2, IL-4, IL-7, IL-13, and IL-15. Immunity2, 331–339 (1995). - PubMed

MeSH terms