. 2024 Aug 27;15(1):7263.
doi: 10.1038/s41467-024-51571-8.

RNA nanotherapeutics with fibrosis overexpression and retention for MASH treatment

Affiliations

RNA nanotherapeutics with fibrosis overexpression and retention for MASH treatment

Xinzhu Shan et al. Nat Commun. .

Abstract

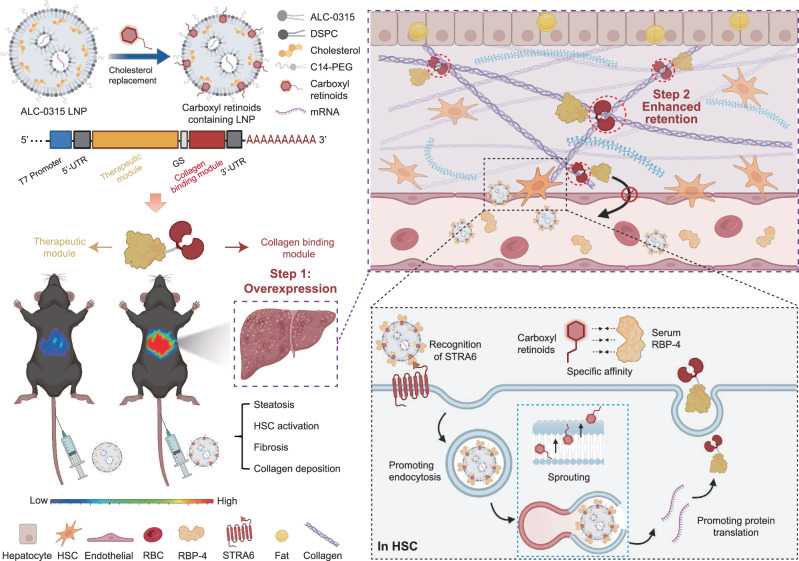
Metabolic dysfunction-associated steatohepatitis (MASH) poses challenges for targeted delivery and retention of therapeutic proteins due to excess extracellular matrix (ECM). Here we present a new approach to treat MASH, termed "Fibrosis overexpression and retention (FORT)". In this strategy, we design (1) retinoid-derivative lipid nanoparticle (LNP) to enable enhanced mRNA overexpression in fibrotic regions, and (2) mRNA modifications which facilitate anchoring of therapeutic proteins in ECM. LNPs containing carboxyl-retinoids, rather than alcohol- or ester-retinoids, effectively deliver mRNA with over 10-fold enhancement of protein expression in fibrotic livers. The carboxyl-retinoid rearrangement on the LNP surface improves protein binding and membrane fusion. Therapeutic proteins are then engineered with an endogenous collagen-binding domain. These fusion proteins exhibit increased retention in fibrotic lesions and reduced systemic toxicity. In vivo, fibrosis-targeting LNPs encoding fusion proteins demonstrate superior therapeutic efficacy in three clinically relevant male-animal MASH models. This approach holds promise in fibrotic diseases unsuited for protein injection.


Conflict of interest statement

M, X.Z.S., Z.Q.Z. have filed a patent for the development of the described FORT strategy. The remaining authors declare no competing interests.

Figures

Fig. 1
Fig. 1. Schematic illustration of fibrosis overexpression and retention (FORT) strategy for metabolic dysfunction-associated steatohepatitis (MASH) treatment.
Collagen binding domain (CBD) screened from the endogenous proteins was added to the C terminus of RLN with connection of Glycine-Serine linker (GS) and coded by mRNA. The therapeutic recombinant mRNAs were encapsulated with a fibrosis-targeted LNP and intravenously (i.v.) administrated for enhanced mRNA expression and fibrotic liver retention. To achieve enhanced mRNA expression, we fabricated a five component LNPs by substituting 25 mol% of cholesterol in ALC-0315 LNPs with a carboxylic retinoid, all-trans retinoic acid (ATRA), which shows over a ~ 10-fold increase in mRNA expression compared to traditional ALC-0315 LNPs in fibrotic and MASH models. Mechanistically, the carboxylic retinoid rearranges on LNPs surfaces during encapsulating mRNA, improving both endocytosis and endosomal release. The added CBD to the therapeutic proteins further extended liver retention. Thereby, the FORT strategy allows the fusion protein to be expressed and anchored in situ, creating a depot that enhances the anti-fibrotic response. GS Glycine-Serine linker, HSC hepatic stellate cell, RBC red blood cell, STRA6 stimulated by retinoic acid 6 (a surface receptor for transported retinoids). Figure 1 was created with BioRender.com released under a Creative Commons Attribution-NonCommercial-NoDerivatives 4.0 International License (CC BY-NC-ND 4.0).
Fig. 2
Fig. 2. Incorporation of carboxylic retinoids in LNPs increased mRNA expression in HSCs and fibrotic livers.
ac Comparison of mRNA expression delivered by representative LNP formulations in wild type (WT) livers and tetrachloride (CCl4) treated fibrotic livers 6 h after i.v. injection. mRNA encoding luciferase (mLuc) was used as reporter mRNA, 0.25 mg/kg in LNP formulations were administered, n = 3 mice. d Structures of different groups of retinoid derivatives incorporated into original LNP formulation as a partial substitution of cholesterol. e In vitro expression of mRNA delivered by retinoid derivative LNPs (RD-LNPs) formulations in LX-2 cells, primary hepatocytes and lipid-overload primary hepatocytes. Twenty-four hours after incubation of 70 ng mRNA LNPs, the expression was measured using plate reader. Expression fold changes over ALC-0315 formulations were calculated and presented (n = 5 in LX-2 cell line, n = 3 in hepatocytes,). Brightfield images show the morphology of WT (middle) and lipid over-load (bottom) primary hepatocytes, scale bar represents 100 μm. f Schematic illustration of CCl4 induced liver fibrosis mice model. g Expression of mLuc 24 h after i.v. injection of the representative RD-LNPs and the original ALC-0315 LNPs (0.25 mg/kg, n = 3 mice). Quantification of the expression was presented on the right. h, i The mRNA expression kinetics delivered by the original ALC-0315 formulation and 25% ATRA formulations were compared in CCl4-treated (6 week) fibrosis mice. Expression was measured by In Vivo Imaging System at multiple time points after injection. Quantification was presented on the right (0.25 mg/kg, n = 3 mice). j Comparison of expression between the original ALC-0315 and ATRA formulations in hamster MASH models at a dose of 0.25 mg/kg. The expression was measured at 6 h after injection, n = 3 mice, one representative animal from each group were listed. Data were represented as mean ± SEM. Statistical significance was calculated through two-tailed unpaired Student’s t-test (c, j), One-way ANOVA with Dunnett test (g) and Two-way ANOVA with Sidak test (h). Figure 2a, b, d and f were created with BioRender.com released under CC BY-NC-ND 4.0. Source data are provided as a “Source Data” file.
Fig. 3
Fig. 3. Mechanisms of the improved mRNA expression of ATRA LNPs.
a mCre delivery activates tdTomato expression. The mice were treated with CCl4 for 4 weeks before LNPs dosing. b Representative FACS analysis of tdTomato+ cells in different cells within fibrotic livers. Three mice were dosed mCre LNPs 48 h before sacrifice. c Quantification of tdTomato+ cells in cell population (n = 3). d Representative staining of luciferase and α-smooth muscle actin (α-SMA) after dosing with mLuc LNPs in fibrotic livers. Scale bar: 100 μm. Experiments were repeated three times independently with similar results. e Cellular internalization of LNPs with inhibition of various internalization pathways. LNP(W/O): n = 4; siSTRA6 and dynasore: n = 8; MBCD: n = 7; poly I: n = 5; WMN and CytD: n = 3; nocodazole: n = 2. Dose-response curve for the interaction between LNPs and RBP-4 protein. n = 5 in (f), n = 5 for Retinol, n = 3 for ATRA in (g). h Characterization of ATRA distribution within LNPs. Data (symbols) and fit (lines) were presented. The core-shell structure of LNP and the percentage of distribution in inner core and outer shell. i Representative confocal images show the release of mRNA (Cy5) from LNPs (BODIPY) (n = 3). Scale bar: 10 μm. j Z-score heatmap representing relative quantifications of phosphatidyl choline (PC) in the endosomes of hepatocytes and activated fibroblasts (ranked by unsaturation %, n = 3). k Schematic of the lipid bilayer mimicking the endosome membranes. l Lipid composition for the mimicked endosomal membrane of hepatocytes and fibroblasts; m The fusion efficiency of LNPs with the two membranes (n = 3). n Representative trace of the Texas red labeled LNPs fusing with the mimicked membranes. o The recorded fusion time (n = 467 for ALC-0315; n = 491 (soft) and 783 (rigid) for ATRA; n = 29,705 (soft) and 212 (rigid) for retinol). p The hypothesis for increased internalization and endosomal escape of ATRA LNPs. Data were represented as mean ± SEM, “n” indicates biologically independent samples. Statistical significance was calculated through two-tailed unpaired Student’s t-test (c, f, g) and One-way ANOVA with Tukey test (e, i). Figure 3a, h, k and p were created with BioRender.com released under CC BY-NC-ND 4.0. Source data are provided as a “Source Data” file.
Fig. 4
Fig. 4. Rational design of mRNA encoded RLN-CBD fusion proteins and verification of their ECM binding capacity.
a Schematic illustration of the structure of mRNA encoded RLN-CBD fusion protein. The ORF encodes the pro-RLN (B, C, A chain) and the CBD domain connected by a flexible GS linker. The mRNA was in vitro transcribed with the linearized plasmid as the template. mRNA was then encapsulated into ATRA LNPs, transfected into HSCs and subsequently expressed the pro-RLN-CBD. The pro-RLN was then processed to a mature secretable RLN-CBD protein; b Lists of 11 endogenous CBDs screened in our study. c Cryo-electron microscopy and particle size characterization of fusion protein coded mRNA formulated with ATRA LNP (RLN-Pep K LNP for representative), scale bar represents 100 nm. Experiment was repeated three times independently with similar results. d Schematic illustration for the enzyme-linked immunosorbent assay (ELISA) method used to assess the collagen binding capacity of the fusion proteins expressed from mRLN-CBD LNPs. e The binding of RLN-CBD fusion proteins to collagen measured by ELISA. Binding capacity was calculated by absorbance at 450 nm deducted the value of binding to bovine serum albumin (BSA) and further divided with the concentration of proteins in the supernatant (n = 3 independent experiments, mean ± SEM). Statistical significance was calculated through one-way ANOVA with Dunnett’s multiple comparison test. Figure 4a and d were created with BioRender.com released under CC BY-NC-ND 4.0. Source data are provided as a “Source Data” file.
Fig. 5
Fig. 5. mRLN-PLGF1 formulated in ATRA LNPs showed enhanced retention with preserved bio-activity.
a Schematic representations of fused and un-modified RLN. b The predicted molecular models and dynamic simulations of fused and un-modified RLN. c RLN and fusion proteins levels in the supernatant of HSCs transfected with mRNA ATRA LNPs, measured by ELISA of mouse RLN (n = 4). d The binding of fused and un-modified RLN to collagens as measured by ELISA, with the binding to bovine serum albumin as control (n = 3). e Affinity of fused and un-modified RLN against collagen II. The fitted Kd values are shown. f Schematic representation of the pharmacokinetics of RLN after i.v. administration of ATRA mRNA LNPs. Liver and blood were harvested at multiple time points after mRNA LNP treatment. g Kinetics of mRNAs-encoded fused and un-modified RLN in liver and blood (1.5 mg/kg, n = 5). h The area under curve of (g). i Allocation ratio of expressed RLN-PLGF1 and RLN-Fc in liver and blood 1 day and 3 days post treatment. Systemic levels of inflammatory cytokines at different times after LNP treatment, n = 4 mice in (j) and n = 3 mice in (k). l Cyclic AMP (cAMP) levels in THP-1 and RAW264.7 cells 12 h after fused and unmodified mRLN LNP treatment (1 μg mRNA/mL, n = 3). m Relative mRNA expression of α-Sma and Tgf-β in 3T3 cells 24 h after treatment of mRLN or mRLN-PLGF1 LNPs (1 μg mRNA/mL, n = 4). n, o Representative staining and quantification of α-SMA 48 h after fused and unmodified RLN mRNA LNPs treatment (1 μg mRNA/mL). Scale bar represents 20 μm (n = 3 independent experiments with similar results). p Dose-response curve for the interaction between RLN or RLN-PLGF1 and 3T3 cells with and without collagen IV (fitted from 3 independent experiments in Supplementary Fig. 30). Data were presented as mean ± SEM, “n” indicates biologically independent samples. Statistical significance was calculated through One-way ANOVA with Dunnett test (c, d, lo), Two-way ANOVA with Sidak test (g, j, k). Figure 5a, f and p were created with BioRender.com released under CC BY-NC-ND 4.0. Source data are provided as a “Source Data” file.
Fig. 6
Fig. 6. Anti-fibrosis effects of mRLN-PLGF1 LNPs in CCl4-induced fibrotic or methionine/choline deficient (MCD) diet induced MASH models.
a Schematic representations of the CCl4-induced liver fibrosis models and treatment schedules for ATRA LNP formulated mRLN or mRLN-CBDs (1.5 mg/kg mRNA). b Serum alanine transaminase (ALT) and aspartate transaminase (AST) from CCl4-induced fibrotic mice with all treatment groups after 4 doses treatment (n = 8 mice). c Liver index (liver weight/body weight%) of all treatment groups from CCl4-induced liver fibrotic mice model (n = 8 mice). Representative IF staining of α-SMA (d), Masson’s trichrome (e), Sirius red (f), scale bar represents 250 μm. g Quantification of (df). The quantification was performed in three randomly selected fields per mouse (from n = 8 mice per group). h Hematoxylin-eosin (H&E) staining in CCl4-induced liver fibrotic mice with all treatment groups after treatment (n = 8 mice), scale bar represents 100 μm. i Schematic representations of the MCD diet induced MASH mouse model and treatment timeline for ATRA LNP formulated mRLN and mRLN-PLGF1 (1.5 mg/kg mRNA). j Liver index (liver wight/body weight %) of all treatment groups from MCD diet induced MASH models (n = 5 mice). k Serum ALT and AST of all treatment groups from MCD mice (n = 5 mice). Representative histochemical staining of Sirius red (l), Masson’s trichrome (m), H&E (n) and Oil Red O (o) in MCD mice with all treatment groups (n = 5 mice), scale bar represents 250 μm in (l, m), 100 μm in (n). p Quantification of the coverage% area of collagen in (l) and (m) and lipid accumulation area in (o). The quantification was performed in three randomly selected fields per mouse (n = 5 mice). Data were presented as mean ± SD, “n” indicates biologically independent samples. Statistical significance was calculated through One-way ANOVA with Dunnett test. Figure 6a and i were created with BioRender.com released under CC BY-NC-ND 4.0. Source data are provided as a “Source Data” file.
Fig. 7
Fig. 7. Low-dose combination of mRLN-PLGF1 and mIL-10-PLGF1 delivered by ATRA LNPs for treating hamsters with MASH.
a Schematic representations of the CDHFD induced MASH hamster models and the treatment schedules for single and combinatorial administrations of ATRA LNP formulated mRLN-PLGF1 and mIL-10-PLGF1 through jugular vein. Hamsters on CDHFD with sham surgery in the jugular vein were served as a control. b The schematic structures of RLN-PLGF1 and IL-10-PLGF1 recombinant proteins. c Representative in vivo ultrasound imaging of livers from the CDHFD-induced MASH hamsters from all treatment groups at 0, 6, 12 and 18 d post the first dose treatment. Higher intensity and heterogeneity of the hepatic echogenicity reflected the more aggressive fibrosis conditions. Serum total cholesterol/triacylglycerol (TG and TC) in (d), serum ALT and AST in (e) from CDHFD induced MASH hamsters in all treatment groups at 0, 6, 12, 18 d post the first dose treatment (n = 5 hamsters). Representative histochemical stains for all the treatment groups from CDHFD-induced MASH hamsters, including Masson’s trichrome (f), Sirius red (g), Oil Red O (h) and H&E (i) staining (n = 5 hamsters), scale bar represents 250 μm in (f, g), 100 μm in (h, i); j Quantification of the coverage% area of collagen in (f), (g) and fat accumulation area in (h). The quantification was performed in three randomly selected fields per hamster in (f, g and i), one randomly selected field in (h), (n = 5 hamsters per group, n = 3 fields per hamster); k TG and TC level in liver after treatment (n = 5 hamsters); l Relative mRNA expression of biomarkers for fibrogenesis, fibrodegradation, lipid-β-oxidation and lipid de novo synthesis in liver of CDHFD induced MASH hamsters with all treatment groups after treatment (n = 5 hamsters). Data were presented as mean ± SD, “n” indicates biologically independent samples. Statistical significance was calculated through One-way ANOVA with Dunnett test. Figure 7a and b were created with BioRender.com released under CC BY-NC-ND 4.0. Source data are provided as a “Source Data” file.

References

    1. Huby, T. & Gautier, E. L. Immune cell-mediated features of non-alcoholic steatohepatitis. Nat. Rev. Immunol.22, 429–443 (2022). 10.1038/s41577-021-00639-3 - DOI - PMC - PubMed
    1. Musso, G., Cassader, M. & Gambino, R. Non-alcoholic steatohepatitis: emerging molecular targets and therapeutic strategies. Nat. Rev. Drug Discov.15, 249–274 (2016). 10.1038/nrd.2015.3 - DOI - PubMed
    1. Dufour, J. F., Caussy, C. & Loomba, R. Combination therapy for non-alcoholic steatohepatitis: rationale, opportunities and challenges. Gut69, 1877–1884 (2020). 10.1136/gutjnl-2019-319104 - DOI - PMC - PubMed
    1. Yang, T. et al. Therapeutic HNF4A mRNA attenuates liver fibrosis in a preclinical model. J. Hepatol.75, 1420–1433 (2021). 10.1016/j.jhep.2021.08.011 - DOI - PubMed
    1. Rizvi, F. et al. Murine liver repair via transient activation of regenerative pathways in hepatocytes using lipid nanoparticle-complexed nucleoside-modified mRNA. Nat. Commun.12, 613 (2021). 10.1038/s41467-021-20903-3 - DOI - PMC - PubMed

MeSH terms

LinkOut - more resources