. 2024 Oct;25(10):4281-4310.
doi: 10.1038/s44319-024-00232-4. Epub 2024 Aug 27.

Drp1 splice variants regulate ovarian cancer mitochondrial dynamics and tumor progression

Affiliations

Drp1 splice variants regulate ovarian cancer mitochondrial dynamics and tumor progression

Zaineb Javed et al. EMBO Rep. 2024 Oct.

Abstract

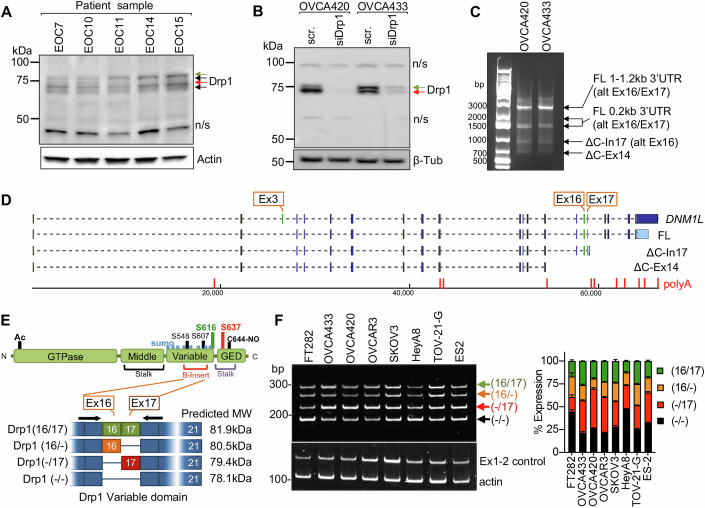
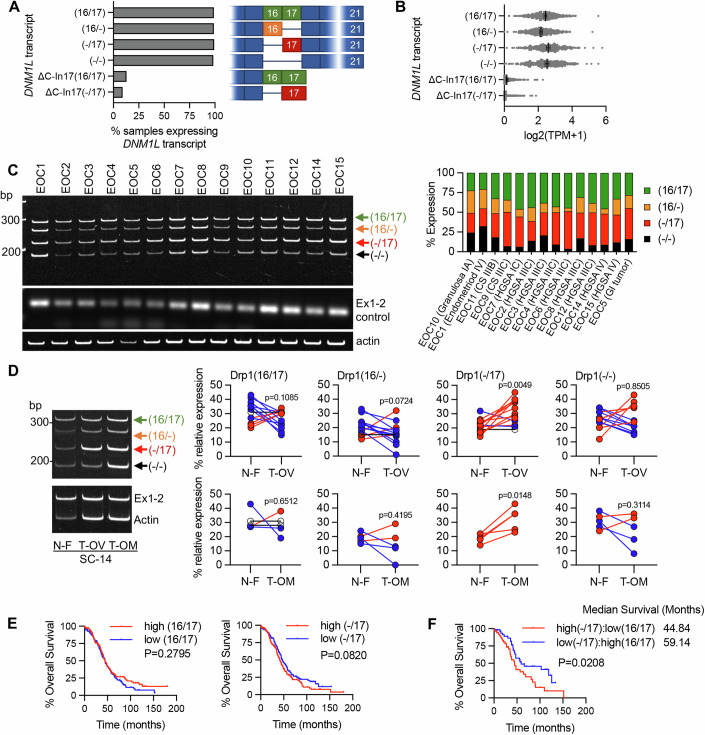
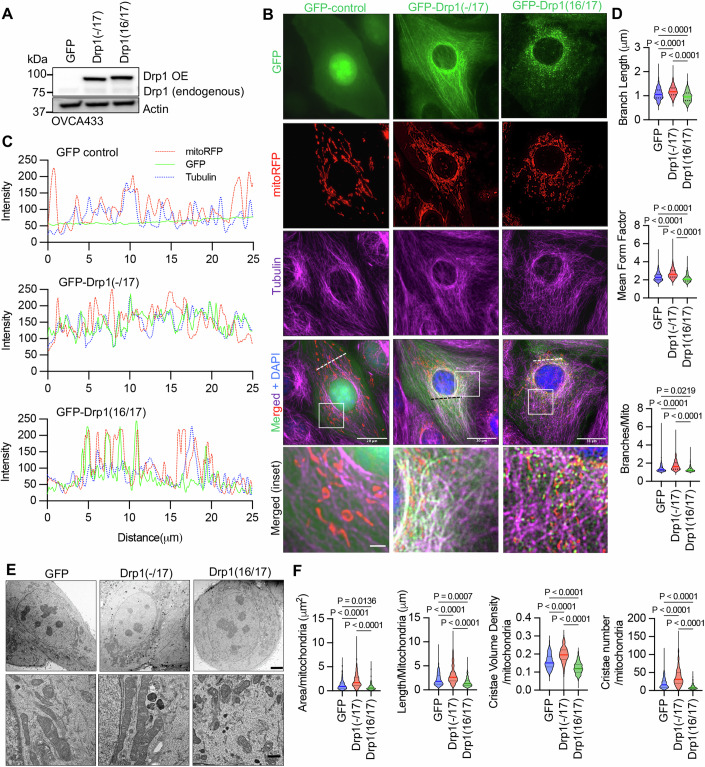
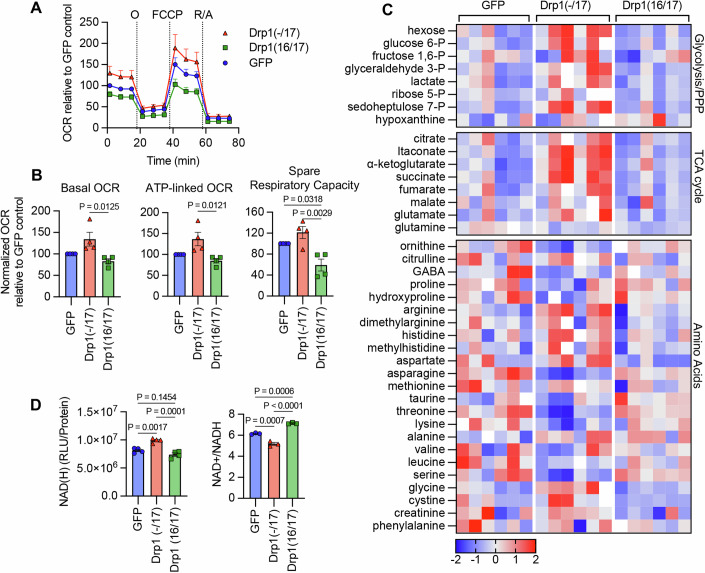
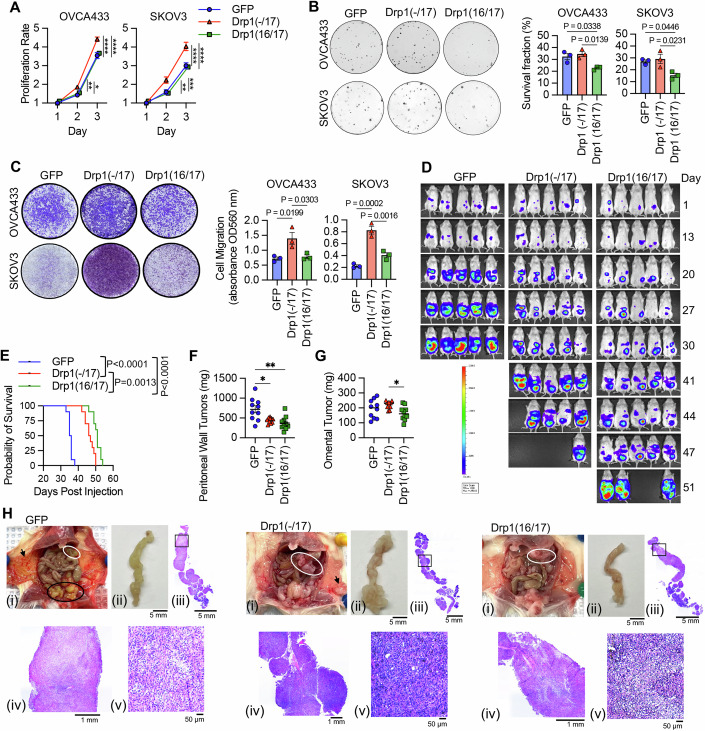
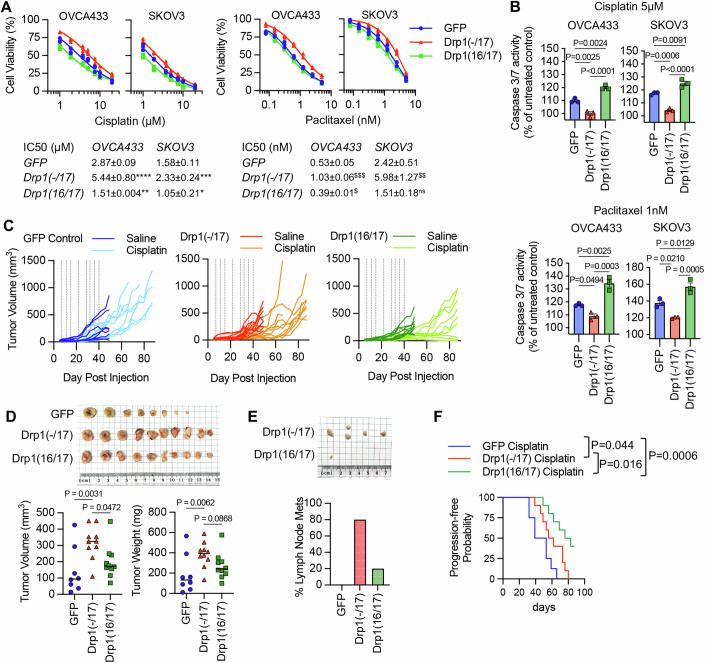
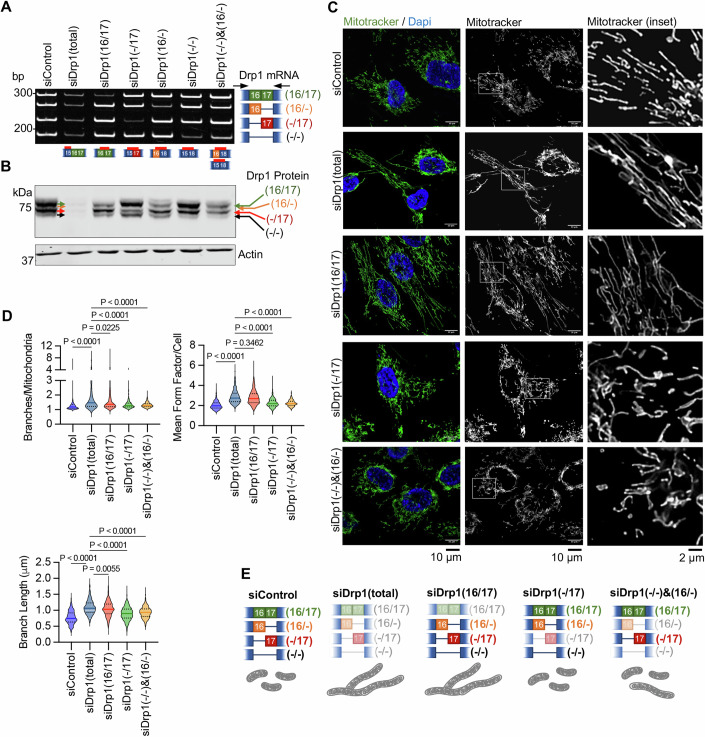
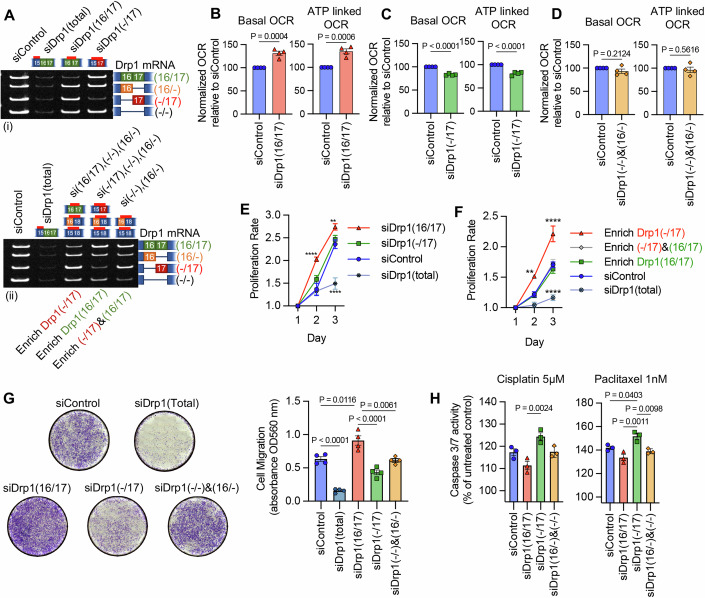
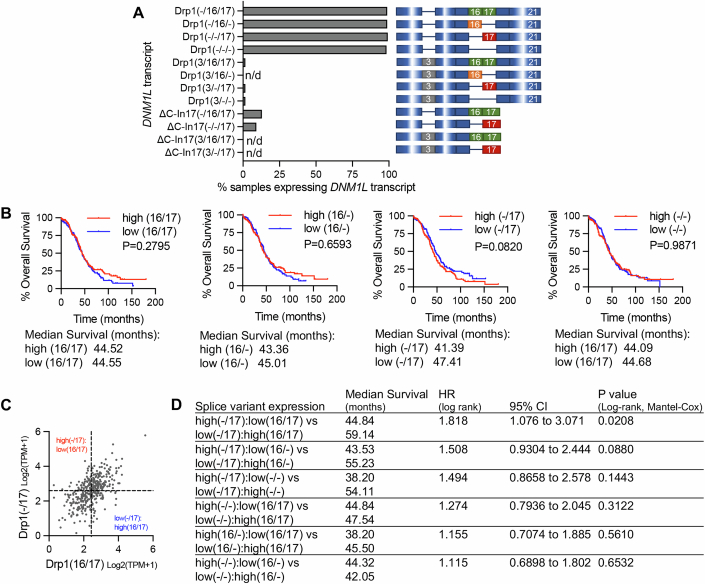
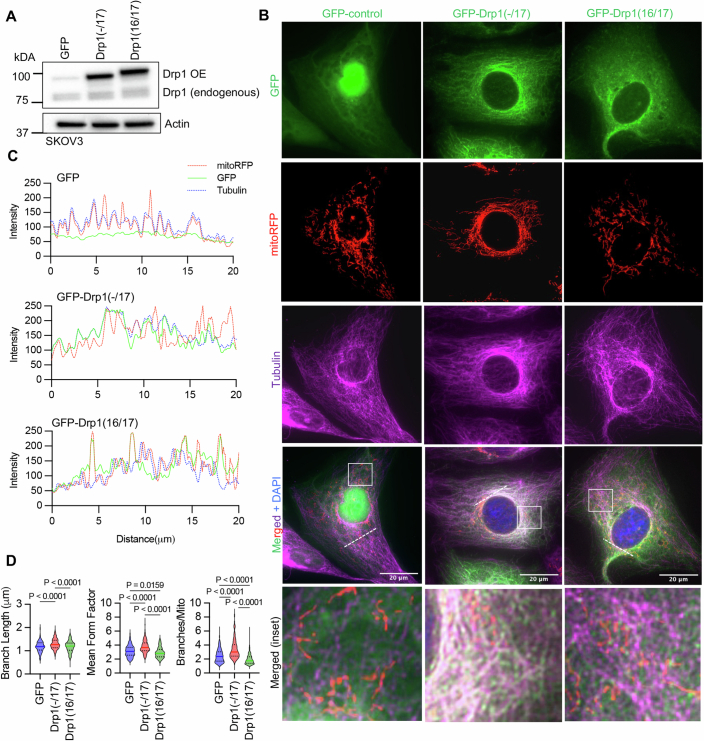
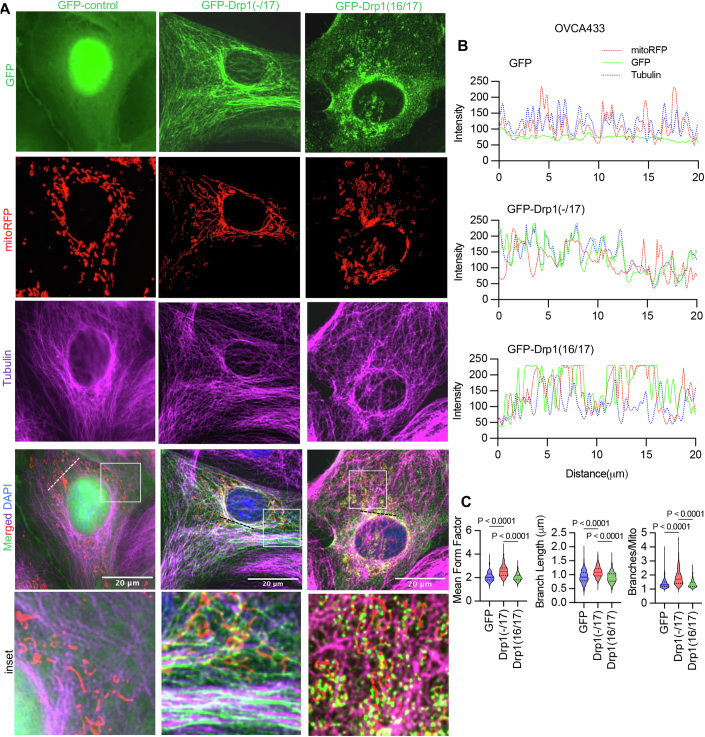
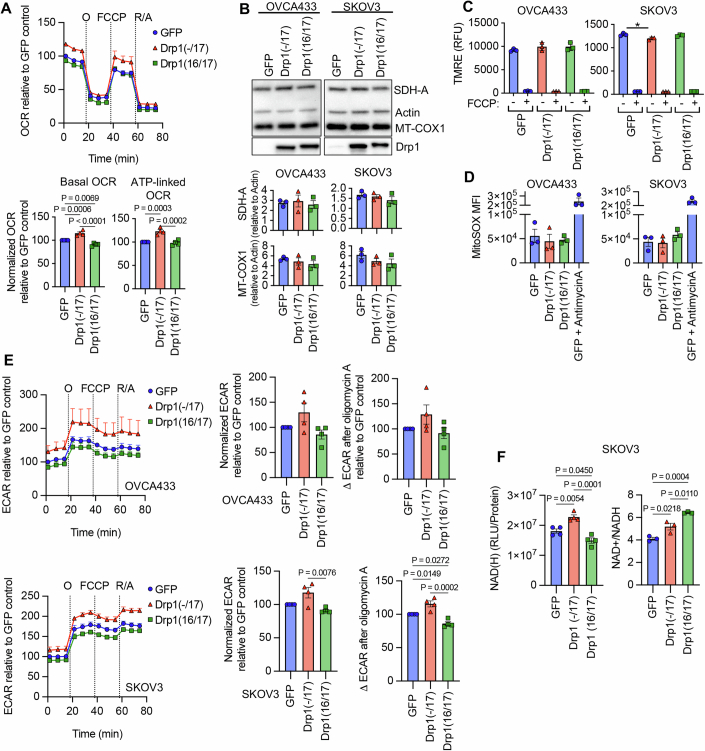
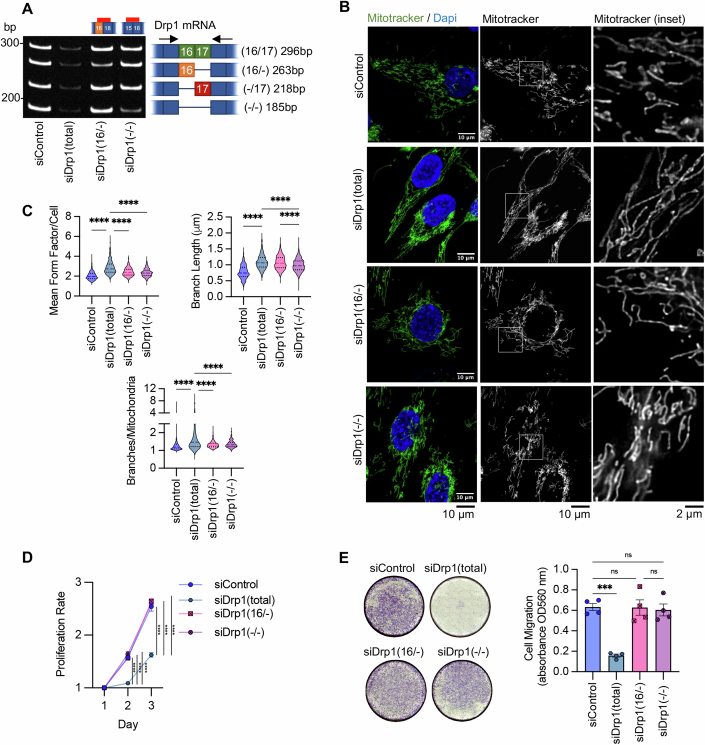
Aberrant mitochondrial fission/fusion dynamics are frequently associated with pathologies, including cancer. We show that alternative splice variants of the fission protein Drp1 (DNM1L) contribute to the complexity of mitochondrial fission/fusion regulation in tumor cells. High tumor expression of the Drp1 alternative splice variant lacking exon 16 relative to other transcripts is associated with poor outcome in ovarian cancer patients. Lack of exon 16 results in Drp1 localization to microtubules and decreased association with mitochondrial fission sites, culminating in fused mitochondrial networks, enhanced respiration, changes in metabolism, and enhanced pro-tumorigenic phenotypes in vitro and in vivo. These effects are inhibited by siRNAs designed to specifically target the endogenously expressed transcript lacking exon 16. Moreover, lack of exon 16 abrogates mitochondrial fission in response to pro-apoptotic stimuli and leads to decreased sensitivity to chemotherapeutics. These data emphasize the pathophysiological importance of Drp1 alternative splicing, highlight the divergent functions and consequences of changing the relative expression of Drp1 splice variants in tumor cells, and strongly warrant consideration of alternative splicing in future studies focused on Drp1.

Keywords: DNM1L; Alternative Splice Variants; Drp1; Mitochondrial Fission; Ovarian Cancer.


Conflict of interest statement

The authors declare no competing interests.

Figures

Figure 1
Figure 1. Ovarian cancer cells express splice variants of Drp1/DNM1L.
(A) Western blot analysis of Drp1 protein expression in patient ascites-derived epithelial ovarian cancer cells (EOC), with the following histological classification: EOC7: HGSA stage IC; EOC10: granulosa tumor IV; EOC 11: carcinosarcoma stage IIIB; EOC14: HGSA stage IV; EOC15: HGSA stage IV. Arrows point to the predicted molecular weight protein (green arrow) and a lower molecular weight band (red arrow), that is prominently expressed in EOCs from patient ascites (Drp1 antibody: ABT155). (B) Drp1 protein variants (arrows) were identified in OVCA420 and OVCA433 cells by western blotting using the N-terminal anti-Drp1 monoclonal antibody ab184247. Specificity to Drp1 was assessed by siRNA-mediated knock-down. Potential non-specific bands (n/s) are indicated. One representative blot from three independent replicates is shown. (C) 3’ RACE and subsequent sequencing of PCR products reveals that OVCA420 and OVCA433 cells express multiple DNM1L transcripts variants, including full-length (FL) transcripts with alternatively spliced exons 16 and 17, and C-terminal truncated transcripts at exon 14 (ΔC-Ex14) and intron 17 (ΔC-In17). (D) Schematic of transcript variants identified in OVCA420 and OVCA433 cells by 5’ and 3’ RACE (from panel C), including alternative splicing of the variable domain exons 16 and 17 (panel C: alt Ex 16/17); variable lengths of 3’UTRs (panel C: FL 1–1.2 kb, 0.2 kb 3’UTR), and utilization of alternate proximal polyadenylation, resulting in two C-terminal truncation variants, terminating in Intron 17 (ΔC-In17) and exon 14 (ΔC-Ex14). ΔC-In17 has two variants due to exon 16 alternative splicing and has a predicted STOP codon following a novel coding sequence for 16 amino acids within intron 17. (E) Schematic representation of functional domains and areas of post-translational modification of the Drp1/DNM1L protein. The location of alternative spliced exons 16 and 17 is in the variable B-insert domain. Numbers in brackets of transcript names denote included exons of the variable domain, dash denotes exon is spliced out. (F) RT-PCR with primers flanking the variable domain illustrates the relative expression of the four DNM1L variable domain splice variants derived from alternative splicing of exons 16 and 17 in ovarian cancer cell lines (mean ± SEM from three independent cultures). Primers in exon 1–2 are used to detect total Drp1. Source data are available online for this figure.
Figure 2
Figure 2. Drp1/DNM1L transcript variant expression in ovarian cancer specimens.
(A) Frequency of Drp1/DNM1L transcript variant expression in ovarian serous cystadenocarcinoma TCGA specimens, focusing on full-length variable domain (16/17) transcripts and C-terminal truncations terminating in Intron 17 (ΔC-In17). Data represent the percentage of specimens displaying TPM values >0.5 for each DNM1L transcript variant. (B) Expression levels of DNM1L transcript variants expressed as log2(TPM + 1) values from 368 individual ovarian serous cystadenocarcinoma TCGA patient samples (median with 95% CI). (C) RT-PCR was used to show the relative expression of DNM1L variable domain splice variants in a panel of patient ascites-derived EOCs. Histologic classification and stage indicated in graph (right; CS carcinosarcoma, HGSA high-grade serous adenocarcinoma, GI gastrointestinal). (D) Representative RT-PCR (left) of DNM1L variable domain splice variant expression from normal fallopian tube (N-F), and matched ovarian (T-OV) and omental tumors (T-OM). The relative expression of splice variant transcript Drp1(-/17) is consistently higher in ovarian tumor and omental tumor compared to matched normal fallopian tube specimens (blots see Appendix Fig. S2; blue lines indicate decreased expression, red lines indicate increased expression, and black lines indicate no change in expression relative to matched normal fallopian tube tissue, N-F vs T-OV n = 13, N-F vs T-OM n = 5; paired t-test). (E) Overall survival of TCGA ovarian cancer patients based on DNM1L variant expression. Samples were split at median log2 TPM into high (n = 184) and low expression (n = 184; log-rank Mantel-Cox test). (F) Overall survival comparison between samples displaying mutually exclusive high Drp1(-/17)/low Drp1(16/17) (n = 52) and low Drp1(-/17)/high Drp1(16/17) (n = 52) expression (low and high cutoffs based on median log2(TPM + 1); log-rank Mantel-Cox test). Source data are available online for this figure.
Figure 3
Figure 3. Drp1(-/17) displays decreased association with mitochondria, and its expression increases the mitochondrial length and cristae density relative to Drp1(16/17).
(A) Western blot analysis of Drp1 expression following overexpression (OE) of GFP vector control, GFP-Drp1(-/17) or GFP-Drp1(16/17) in OVCA433 cells. (B) Representative epifluorescence images of mitochondrial morphology and Drp1 distribution in OVCA433 cells. (Green: GFP or GFP-tagged Drp1, Red: mito-RFP to label mitochondria, Magenta: anti-Tubulin antibody, Blue: DAPI). Drp1(-/17) shows a distinct pattern of co-localization with Tubulin, while Drp1(16/17) displays localization to mitochondrial fission puncta. Scale bar: 20 μm, scale bar inset 2 μm. (C) Representative histograms of fluorescence intensity (from dotted line in panel B images) illustrate that Drp1(-/17) (green) is more closely aligned with Tubulin (blue) and less so with mitochondria (red). In contrast, GFP-Drp1(16/17) fluorescence peaks coincide with mitochondrial (red) peaks, reflective of association with mitochondrial fission puncta. (D) Drp1(-/17) expressing cells display elongated and branched mitochondrial networks compared to cells expressing Drp1(16/17). Quantification of mitochondrial morphology based on mito-RFP labeling by three independent descriptors (mitochondria analyzer, ImageJ; GFP control n = 498 cells, Drp1(-/17) n = 568 cells, Drp1(16/17) n = 553 cells; median + IQR, one-way ANOVA mean form factor P < 0.0001; one-way ANOVA branch length P < 0.0001; one-way ANOVA Branches/mito P < 0.0001. Tukey’s post test P values are shown). (E) Representative TEM images of OVCA433 cells demonstrate that Drp1(-/17) expressing cells have more fused mitochondria with greater cristae organization and volume compared to cells expressing Drp1(-1/7) or GFP control. Scale bar: 4 μm (upper panels) and 800 nm (lower panels). (F) Quantification of mitochondrial morphology and cristae from TEM images (GFP control n = 156 cells, Drp1(-/17) n = 160 cells, Drp1(16/17) n = 157 cells; median + IQR, one-way ANOVA area/mitochondria P < 0.0001; one-way ANOVA cristae volume density P < 0.0001; one-way ANOVA length/mitochondria P < 0.0001; one-way ANOVA cristae number/mitochondria P < 0.0001. Tukey’s post test P values are shown). Source data are available online for this figure.
Figure 4
Figure 4. Expression of Drp1(-/17) splice variant increases mitochondrial respiration and TCA cycle metabolites.
(A) Expression of Drp1(-/17) increases oxygen consumption rates (OCR) in OVCA433 cells as assessed by Seahorse extracellular flux analysis and the mitochondrial stress test (O: oligomycin A, R/A: rotenone/antimycin A; OCR is normalized to cell viability and expressed relative to GFP control, mean ± SEM of four biological replicates each derived from the average of 2–4 technical repeats). (B) Basal OCR, ATP-linked OCR, and spare respiratory capacity are increased in OVCA433 cells expressing Drp1(-/17) compared to Drp1(16/17). Data were expressed relative to GFP control (mean ± SEM of four biological replicates, each derived from the average of 2–4 technical repeats, one-way ANOVA basal OCR P = 0.0144; ATP-linked OCR P = 0.0131; spare respiratory capacity P = 0.0034; Tukey’s post test P values shown). (C) Relative metabolite content of OVCA433 cells stably expressing GFP control, GFP-Drp1(-/17) or GFP-Drp1(16/17) as assessed by untargeted LC-HRMS (n = 6, heatmap reflects z-scores of analyte/ISTD peak area values). (D) Total NAD(H) levels are increased in response to Drp1(-/17) expression relative to OVCA433 cells expressing GFP control or Drp1(16/17), while the ratio of NAD + /NADH is significantly decreased (NAD(H): mean ± SEM of four biological replicates each derived from the average of three technical repeats, one-way ANOVA P = 0.0002; NAD + /NADH: mean ± SEM of four biological replicates each derived from the average of three technical repeats one-way ANOVA P < 0.0001; Tukey’s post test P values shown). Source data are available online for this figure.
Figure 5
Figure 5. Compared to Drp1(16/17), expression of Drp1(-/17) promotes proliferation and migration, maintains clonogenic survival and drives omental tumor burden of ovarian cancer cells.
(A) Drp1(-/17) expression increases proliferation of OVCA433 and SKOV3 cells. Cell proliferation was assessed by FluoReporter dsDNA quantification, and proliferation rate expressed as increase in the cell density relative to day 1 (mean ± SEM of three biological replicates each derived from the average of four technical repeats, OVCA433: two-way ANOVA group factor variance P < 0.0001, Tukey’s post test *P = 0.0034, **P = 0.0044, and ****P < 0.0001; SKOV3: two-way ANOVA group factor variance p < 0.0001, Tukey’s post test **P = 0.0049, ***P = 0.0007, and ****P < 0.0001). (B) Drp1(16/17) expression lowers single-cell clonogenic survival in both OVCA433 and SKOV3 cells. Cells (100/well) were seeded onto six-well plates and stained with crystal violet after 7–10 days in culture. Colonies were quantified using ImageJ. Representative image of one technical replicate shown (mean ± SEM of three biological replicates each derived from the average of six technical repeats, one-way ANOVA OVCA433 P = 0.0128; SKOV3 P = 0.0201. Tukey’s post test P values shown). (C) Drp1(-/17) expressing cells are more migratory than Drp1(16/17) or GFP control cells. Cell migration was assessed using the Boyden chamber transwell assay. Images are representative of three independent assays (mean ± SEM of three biological replicates each derived from the average of two technical repeats, one-way ANOVA OVCA433 P = 0.0155; SKOV3 P = 0.0003. Tukey’s post test P values shown). (D) Peritoneal tumor burden was monitored using bioluminescence imaging at indicated days after NSG mice were injected with 1 × 106 SKOV3 cells expressing GFP control, Drp1(-/17) or Drp1(16/17) (5 representative mice/group shown). (E) Survival of mice injected IP with SKOV3 cells expressing GFP control, Drp1(-/17) or Drp1(16/17) (n = 10 mice/group, Log-rank Mantel-Cox test P values shown; median survival GFP: 33.5 days, Drp1(-/17): 46.5 days, Drp1(16/17): 51 days). (F) Peritoneal tumor weight was measured after removal at necropsy when mice met endpoint (n = 10, median, Kruskal–Wallis P = 0.0046, uncorrected Dunn’s test *P = 0.0448, **P = 0.0011). (G) Omental tumor weight was measured after removal at necropsy when mice met endpoint (n = 10, median, Kruskal–Wallis P = 0.0576, uncorrected Dunn’s test *P = 0.017). (H) Representative image of mice with tumors from SKOV3 cells expressing GFP control, Drp1(-/17) or Drp1(16/17). (i) GFP-expressing cells primarily formed peritoneal tumors near the injection site (Black outline) and peritoneal wall (arrow), while Drp1(-/17) expressing cells primarily formed tumors in the omentum (white outline). Gross omental tumors (ii) and sectioned omenta followed by H& E staining (iii–v) demonstrate that Drp1(-/17) expressing cells form multiple nodular tumors along the omentum. Source data are available online for this figure.
Figure 6
Figure 6. Drp1 splice variant expression affects chemosensitivity of ovarian cancer cells.
(A) Expression of Drp1(-/17) decreases sensitivity to cisplatin and paclitaxel. Dose-response curves were derived from cell viability assays (FluoReporter dsDNA quantification) of OVCA433 and SKOV3 cells expressing GFP vector control, Drp1(-/17) and Drp1(16/17) in response to cisplatin and paclitaxel treatment (72 h; IC50s calculated from three independent experiments, mean ± SD, one-way ANOVA, Dunnet’s post test comparison to GFP control, P values for Cisplatin: *P = 0.0306, **P = 0.0202, ***P = 0.0061, ****P = 0.001; P values for Paclitaxel: $P = 0.0179, $$P = 0.0028, $$$P < 0.0001). (B) Cells expressing Drp1(-/17) display abrogated apoptosis in response to cisplatin (5 μM) or paclitaxel (1 nM) treatment after 24 h, as assessed using Caspase-Glo 3/7 assay (mean ± SEM of three biological replicates each derived from the average of 3–4 technical repeats, one-way ANOVA cisplatin OVCA433 P = < 0.0001, SKOV3 P = < 0.0001; paclitaxel OVCA433 P = 0.0003, SKOV3 P = 0.0006. Tukey’s post test P values shown). (C) Drp1(16/17) expression leads to Cisplatin sensitivity of SKOV3 cells in vivo. Subcutaneous tumor growth of SKOV3 cells expressing GFP control, Drp1(-/17) or Drp1(16/17) was monitored following injected into female CrTac:NCr-Foxn1nu mice (tumor volume of individual tumors shown, 2 tumors per mouse, n = 4–5 mice). Saline or cisplatin (5 mg/kg) was administered IP at indicated days (vertical lines on graphs). 4/10 tumors in the Dpr1(16/17) group responded to cisplatin treatment, while all GFP and Drp1(-/17) expressing tumors progressed with treatment. (D) Final tumor volume and weight of SKOV3 subcutaneous tumors from saline-treated groups. All mice were euthanized at the same endpoint (day 49; n = 8, GFP; n = 10, Drp1(-/17); n = 10, Drp1(16/17); median shown, tumor volume Kruskal–Wallis P = 0.0211, uncorrected Dunn’s test P values shown; tumor weight Kruskal–Wallis P = 0.0102, uncorrected Dunn’s test P values shown). (E) Drp1(-/17) expressing SKOV3 cells develop lymph node metastases in subcutaneous tumor model. Lymph node metastases were resected in the saline-treated groups at day 49 (cisplatin-treated group see Appendix Fig. S6B). Graph shows the percentage of mice with lymph node metastases. (F) Progression-free probability of cisplatin-treated mice demonstrates that Drp1(16/17) promotes cisplatin sensitivity of SKOV3 cells. Tumor progression was determined as tumor burden reached volume >200 mm3 (n = 8 tumors, GFP; n = 10, Drp1(-/17); n = 10 Drp1(16/17); Log-rank Mantel-Cox test P values shown, median probability GFP: 46 days, Drp1(-/17): 59 days, Drp1(16/17): 79.5 days; final tumor weight at endpoint see Appendix Fig. S6A). Source data are available online for this figure.
Figure 7
Figure 7. Specific knock-down of endogenous Drp1 splice variants using siRNA and effects on mitochondrial morphology.
(A) RT-PCR demonstrating variant-specific knock-down of endogenous Drp1 using splice variant-specific siRNA in SKOV3 cells. One representative gel from three independent replicates shown. (B) Changes in Drp1 protein levels following splice variant-specific siRNA-mediated knock down of Drp1 protein in SKOV3 cells were visualized after resolving proteins on 7.5% SDS-PAGE followed by western blotting (antibody: ab184247). One representative blot from 3 independent replicates is shown. (C) Representative epifluorescence images of mitochondrial morphology upon splice variant-specific siRNA Drp1 knockdown in SKOV3 cells. (Green: mitotracker green, Blue: DAPI). The disruption of endogenous Drp1 splice variant expression differentially modifies mitochondrial dynamics. siDrp1(16/17) most closely replicates the elongated mitochondrial morphology observed following knock-down of all Drp1 variants (siDrp1-total). Scale bar: 10 μm. (D) Quantification of mitochondrial morphology represented by three independent descriptors using ImageJ mitochondria analyzer (siControl n = 560 cells, siDrp1(total) n = 334, siDrp1(16/17) n = 630, siDrp1(-/17) n = 655, siDrp1(−/−)&(16/-) n = 555; median + IQR, one-way ANOVA mean form factor P < 0.0001; one-way ANOVA branch length P < 0.0001; one-way ANOVA branches/mito P < 0.0001. Tukey’s post test was performed to assess differences between groups and P values for comparisons to siDrp1(total) are shown). (E) Schematic representation of siRNA-mediated knock-down of Drp1 splice variants and effects on endogenous splice variant expression and mitochondrial morphology. Source data are available online for this figure.
Figure 8
Figure 8. Targeted knock-down of endogenous Drp1 splice variants in SKOV3 cells differentially affect mitochondrial respiration, proliferation, and migration.
(A) RT-PCR demonstrating knock-down of Drp1 using single splice variant-specific siRNA or combination of siRNAs to enrich for specific Drp1 splice variant expression. One representative gel from independent replicates shown. (B) Basal and ATP-dependent oxygen consumption rates (OCR) improved upon siRNA-mediated knockdown of Drp1(16/17) splice variant, which increases the Drp1(-/17):Drp1(16/17) ratio. Mitochondrial respiration was assessed using Seahorse extracellular flux analysis and the mitochondrial stress test. Data expressed relative to siControl, mean ± SEM of four biological replicates each derived from the average of three technical repeats, unpaired t-test P values shown. (C) Conversely, specific knockdown of Drp1(-/17) decreased basal and ATP OCR (mean ± SEM of four biological replicates each derived from the average of three technical repeats, unpaired t-test P values shown). (D) Mitochondrial respiration remains unchanged when enriching for equal levels of Drp1(-/17) and Drp1(16/17) expression by a combination of Drp1(16/-) and (Drp1(−/−) knock-down. (mean ± SEM of four biological replicates each derived from the average of three technical repeats, unpaired t-test P values shown). (E) Single variant knock-down of Drp1(16/17) increases proliferation rate of SKOV3 cells relative to siControl (n = 3, mean  ± SEM, two-way ANOVA group factor variance P < 0.0001, Tukey’s post test P values for comparisons to siControl shown, **P = 0.0086, ****P < 0.0001). (F) Drp1(-/17) variant enrichment with combination knock-down increases the proliferation rate of SKOV3 cells relative to siControl. Cell proliferation was assessed by FluoReporter dsDNA quantification and proliferation rate expressed as an increase in the cell density relative to day 1 (n = 3, mean ± SEM, two-way ANOVA group factor variance P < 0.0001, Tukey’s post test P values for comparisons to siControl shown, **P = 0.0012, ****P < 0.0001). (G) Endogenous Drp1 splice variants differentially affect cell migration in SKOV3 cells. Knock-down of Drp1(16/17) increases migration, while Drp1(-/17) knock-down reduces cell migration relative to siControl cells. After siRNA-mediated knock-down, cell migration was assessed using a Boyden chamber transwell assay. Images are representative of four independent assays (n = 4, mean ± SEM, one-way ANOVA ****P < 0.0001. Tukey’s multiple comparison post test P values shown). (H) Cells with single variant knock-down of Drp1(16/17) have reduced apoptotic response to cisplatin (5 μM) or paclitaxel (1 nM) treatment compared to knock-down of Drp1(-/17). Apoptosis was assessed using Caspase-Glo 3/7 assay after 24 h of treatment (mean ± SEM of three biological replicates each derived from the average of three technical repeats, one-way ANOVA cisplatin P = 0.0040; paclitaxel P = 0.0016, Tukey’s multiple comparison post test P values shown). Source data are available online for this figure.
Figure EV1
Figure EV1. Drp1/DNM1L transcript variant expression in ovarian cancer specimens from TCGA.
(A) Frequency of Drp1/DNM1L transcript variant expression, including alternatively spliced exons 3, 16, and 17 (3/16/17) transcripts and C-terminal truncation terminating in Intron 17 (ΔC-In17). Dash denotes exon is spliced out. Data represent the percentage of specimens displaying log2 TPM + 1 values >0.5 for each DNM1L variant. (B) Overall survival of TCGA patients based on DNM1L variant expression. Samples were split at median log2 TPM into high (n = 184) and low expression (n = 184; log-rank Mantel-Cox test). (C) Drp1(-/17) expression relative to Drp1(16/17; log2 TPM + 1). Mutually exclusive high and low expression of variant pairs is based on median log2 TPM + 1 expression cut-offs indicated by a dotted line. (D) Overall survival data of TCGA ovarian cancer patients grouped into mutually exclusive high/low expression of Drp1 transcript variant pairs. Low and high cutoffs are based on median expression. Patients with high Drp1(-/17) and low Drp1(16/17) expression display significantly decreased overall survival compared to patients with high Drp1(16/17) and low Drp1(-/17) transcript levels in their tumors.
Figure EV2
Figure EV2. Drp1(-/17) displays decreased association with mitochondria and increased localization to microtubules in SKOV3 cells.
(A) Western blot analysis of Drp1 expression following transfection of GFP vector control, GFP-tagged Drp1(-/17) or Drp1(16/17) (overexpression: OE) in SKOV3 cells. (B) Representative epifluorescence images of mitochondrial morphology and Drp1 distribution in SKOV3 cells. (Green: GFP or GFP-tagged Drp1, Red: mito-RFP to label mitochondria, Magenta: anti-Tubulin antibody, Blue: DAPI). Drp1(-/17) expression is strongly co-localized with Tubulin, while Drp1(16/17) localizes to mitochondrial fission puncta. Scale bar: 20 μm. (C) Representative histograms of fluorescence intensity (dotted line in panel B images) illustrate that Drp1(-/17) (green) is more closely aligned with Tubulin (blue) and less so with mitochondria (red) in SKOV3 cells. In contrast, GFP-Drp1(16/17) fluorescence peaks coincide with mitochondrial (red) peaks, reflective of association with mitochondrial fission puncta. (D) Drp1(-/17) expressing SKOV3 cells display elongated and branched mitochondrial networks compared to cells expressing Drp1(16/17). Quantification of mitochondrial morphology was carried out using a mitochondria analyzer in ImageJ. (GFP control n = 180 cells, Drp1(-/17) n = 224 cells, Drp1(16/17) n = 252 cells, median + IQR, one-way ANOVA mean form factor P < 0.0001; branch length P < 0.0001; branches/mito P < 0.0001. Tukey’s post test comparison P values are shown).
Figure EV3
Figure EV3. Drp1(-/17) displays decreased association with mitochondria in response to FCCP.
(A) Drp1(-/17) preserves its localization with Tubulin upon treatment with the fission stimulus FCCP. In contrast, Drp1(16/17) associates with fission puncta at mitochondria in response to FCCP. Representative epifluorescence images are shown of mitochondrial morphology and Drp1 distribution after 30 min with FCCP treatment (1 μM) in OVCA433 cells. (Green: GFP or GFP-tagged Drp1, Red: mitochondria-targeted RFP, Magenta: anti-Tubulin, Blue: DAPI; Scale bar: 20 μm). (B) Representative histogram of fluorescence intensity of GFP-Drp1 (green) in conjunction with mitochondria (red) and Tubulin (blue), illustrates that GFP-Drp1(16/17) strongly overlaps with mitochondria following FCCP treatment (1 μM, 30 min). Conversely, Drp1(-/17) continues to show overlapping localization with tubulin rather than mitochondria. (C) OVCA433 cells expressing Drp1(16/17) or GFP control display decreased mitochondrial length and increased fragmentation compared to cells expressing Drp1(-/17) in response to FCCP. Quantification of mitochondrial morphological represented by three independent descriptors as analyzed by mitochondria analyzer in ImageJ. n = 301 cells from GFP control, n = 285 cells from Drp1(-/17), and n = 287 from Drp1(16/17) were analyzed (median + IQR, one-way ANOVA mean form factor P < 0.0001; branch length P < 0.0001 and branches/mito P < 0.0001. Tukey’s post test comparison P values shown).
Figure EV4
Figure EV4. Expression of Drp1(-/17) increases mitochondrial respiration and ECAR but does not affect levels of ETC components, mitochondrial membrane potential, or MitoSOX oxidation.
(A) Expression of Drp1(-/17) increases oxygen consumption rates (OCR) in SKOV3 cells as assessed by Seahorse extracellular flux analysis and mitochondrial stress test (O: oligomycin A, R/A: rotenone/antimycin A; OCR is normalized to cell viability and expressed relative to GFP control). Basal OCR and ATP-linked OCR are increased in SKOV3 cells expressing Drp1(-/17) compared to Drp1(16/17). Data are expressed relative to GFP control (mean ± SEM of four biological replicates each derived from the average of 2–4 technical repeats, one-way ANOVA Basal OCR P < 0.0001; ATP-linked OCR P = 0.0001; Tukey’s post test comparison P values shown). (B) Levels of nuclear-DNA encoded SDH-A (Complex II) and mitochondrial DNA encoded COX1 (Complex IV) proteins are unchanged in both Drp1(-/17) and Drp1(16/17) expressing cells compared to GFP control cells. Data from one experimental replicate western blot is shown. Quantification of SDH-A and MT-COX1 protein expression normalized to β-Actin in OVCA433 and SKOV3 cells by densitometry using ImageJ. (mean ± SEM from lysates of three independent cultures, one-way ANOVA SDH-A expression; OVCA433 p = 0.8407, SKOV3 P = 0.3893, MT-COX1 expression; OVCA333 P = 0.4876, SKOV3 P = 0.2842). (C) Mitochondrial membrane potential was measured using TMRE (100 nM) at baseline and with FCCP treatment (10 μM, 30 min) in OVCA433 and SKOV3 cells expressing GFP control, Drp1(-/17) or Drp1(16/17) (mean ± SEM from three biological replicates each derived from the average of six technical repeats, one-way ANOVA of untreated cells OVCA433 P = 0.3908, SKOV3 P = 0.0256, Tukey’s post test *P = 0.0264; one-way ANOVA comparison of FCCP treated cells OVCA433 P = 0.3449, SKOV3 P = 0.1715). (D) Drp1(-/17) and Drp1(16/17) overexpression in OVCA433 and SKOV3 cells did not alter the mean fluorescence intensity (MFI) of MitoSOX, a mitochondrial targeted dye susceptible to superoxide-mediated oxidation (mean ± SEM of MFIs from three biological replicates, one-way ANOVA OVCA433 P = 0.7971, SKOV3 P = 0.3830). Antimycin A (50 μM) was used as positive control. (E) ECAR traces derived from mitochondrial stress test (Figs. 4A OVCA433 and EV4A SKOV3). Basal ECAR and ΔECAR following oligomycin A inhibition of ATP-synthase were quantified and expressed relative to GFP control (mean ± SEM of 4 biological replicates each derived from the average of 2–4 technical repeats, one-way ANOVA, OVCA433 Basal ECAR P = 0.0743; OVCA433 ΔECAR P = 0.1501, SKOV3 Basal ECAR P = 0.0088; ΔECAR P = 0.0003; Tukey’s post test comparison P values shown). (F) Total NAD(H) levels are increased in response to Drp1(-/17) expression relative to SKOV3 cells expressing GFP control or Drp1(16/17), while the ratio of NAD+/NADH is significantly decreased (NAD(H): mean ± SEM of four biological replicates each derived from the average of three technical repeats, one-way ANOVA P = 0.0002; NAD+/NADH: mean ± SEM of four biological replicates each derived from the average of three technical repeats one-way ANOVA P = 0.0004; Tukey’s post test P values shown).
Figure EV5
Figure EV5. Specific knock-down of endogenous Drp1(−/−) and Drp1(16/-) variants and effects on mitochondrial morphology, cell proliferation, and migration.
(A) Individual Drp1(−/−) and Drp1(16/-) variant-specific knockdown was achieved by use of siRNAs targeting Exon/Exon junction of splice variants (represented by red bars) and knock-down assessed by RT-PCR with primers flanking the variable domain region. (B) Representative epifluorescence images of mitochondrial morphology upon splice variant-specific siRNA Drp1 knockdown in SKOV3 cells (Green: mitotracker green, Blue: DAPI). Scale bar: 10 μm, inset 2 μm. (C) Quantification of mitochondrial morphological represented by three independent descriptors as analyzed by mitochondria analyzer in ImageJ. (n = 560 cells siControl, n = 334 cells siDrp1(total), n = 630 siDrp1(16/17), n = 655 siDrp1(-/17), n = 555 siDrp1(−/−)&(16/-); median + IQR, one-way ANOVA mean form factor P < 0.0001; branch length P < 0.0001 and branches/mito P < 0.0001. Tukey’s post test was performed to assess differences between groups and analysis comparing groups to siDrp1(total) are shown, ****P < 0.0001). (D) Individual Drp1(−/−) and Drp1(16/-) variant-specific knockdown did not alter cell proliferation in SKOV3 cells, as there was no difference in proliferation rate compared to siControl cells. Cell proliferation was assessed by FluoReporter dsDNA quantification and proliferation rate expressed as an increase in the cell density relative to day 1 (mean ± SEM of four biological replicates each derived from the average of four technical repeats, two-way ANOVA group factor variance P < 0.0001, Tukey’s post test ****P < 0.0001). (E) Cell migration was unchanged upon knock-down of either Drp1(−/−) or Drp1(16/-) splice variant in SKOV3 cells. Post Drp1 knock-down, cell migration was assessed using the Boyden chamber transwell assay and quantified by measuring the absorbance of the crystal violet staining of migrated cells. Images are representative of four independent assays (n = 4, mean  ± SEM, one-way ANOVA P < 0.0001, Tukey’s post test ***P = 0.001, with select comparisons shown).

Update of

Similar articles

Cited by

References

    1. Alan L, Scorrano L (2022) Shaping fuel utilization by mitochondria. Curr Biol 32:R618–R623 - PubMed
    1. Anderson AS, Roberts PC, Frisard MI, Hulver MW, Schmelz EM (2014) Ovarian tumor-initiating cells display a flexible metabolism. Exp Cell Res 328:44–57 - PMC - PubMed
    1. Archer SL (2013) Mitochondrial dynamics-mitochondrial fission and fusion in human diseases. N Engl J Med 369:2236–2251 - PubMed
    1. Arnoult D, Rismanchi N, Grodet A, Roberts RG, Seeburg DP, Estaquier J, Sheng M, Blackstone C (2005) Bax/Bak-dependent release of DDP/TIMM8a promotes Drp1-mediated mitochondrial fission and mitoptosis during programmed cell death. Curr Biol 15:2112–2118 - PubMed
    1. Banerjee R, Mukherjee A, Nagotu S (2022) Mitochondrial dynamics and its impact on human health and diseases: inside the DRP1 blackbox. J Mol Med 100:1–21 - PubMed

MeSH terms