. 2024 Aug 27;14(1):19899.
doi: 10.1038/s41598-024-70911-8.

Prenatal vitamin D deficiency exposure leads to long-term changes in immune cell proportions

Affiliations

Prenatal vitamin D deficiency exposure leads to long-term changes in immune cell proportions

Koki Ueda et al. Sci Rep. .

Abstract

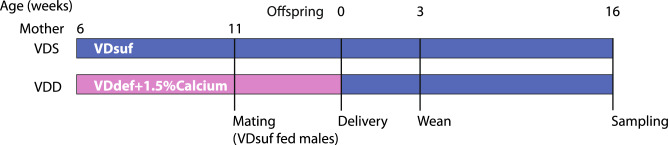
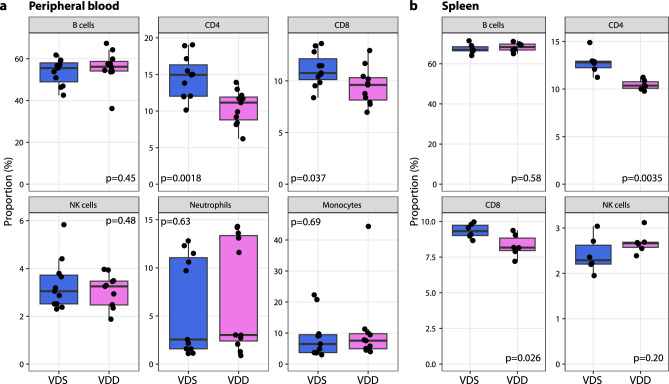
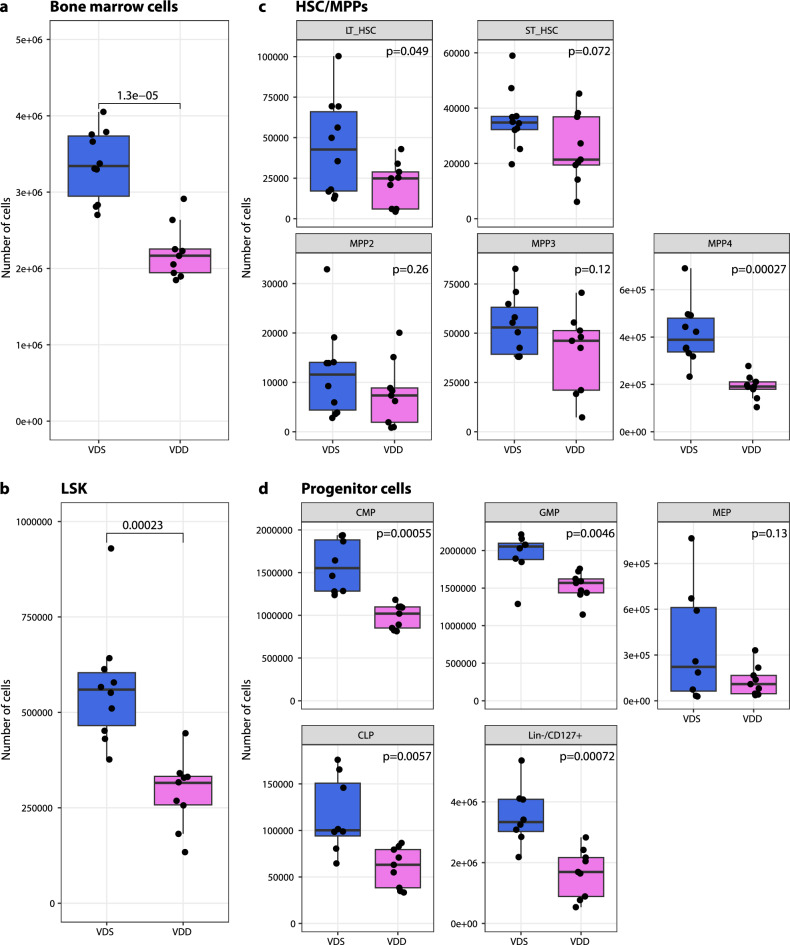
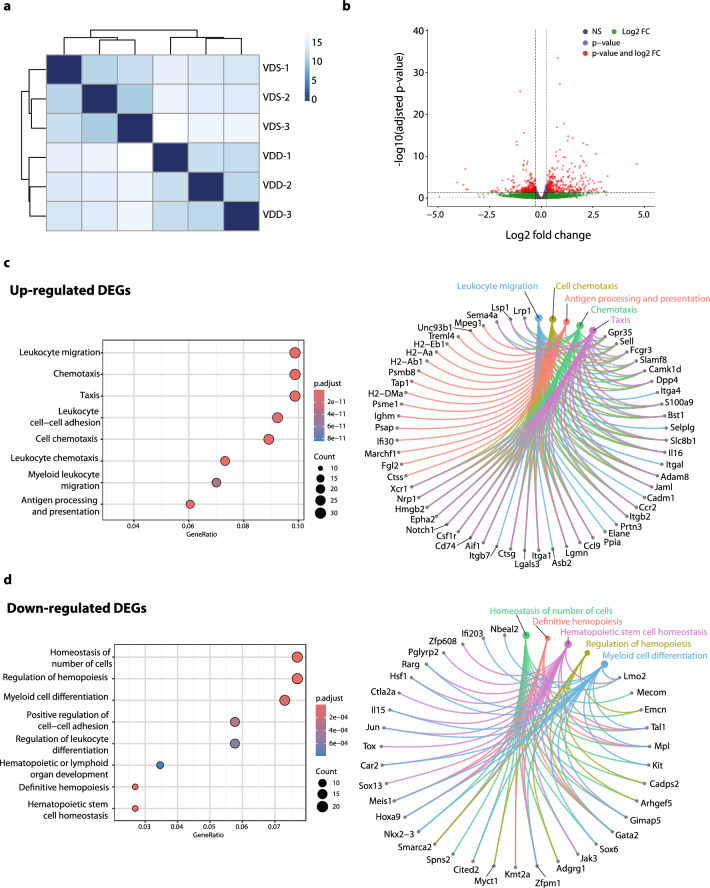
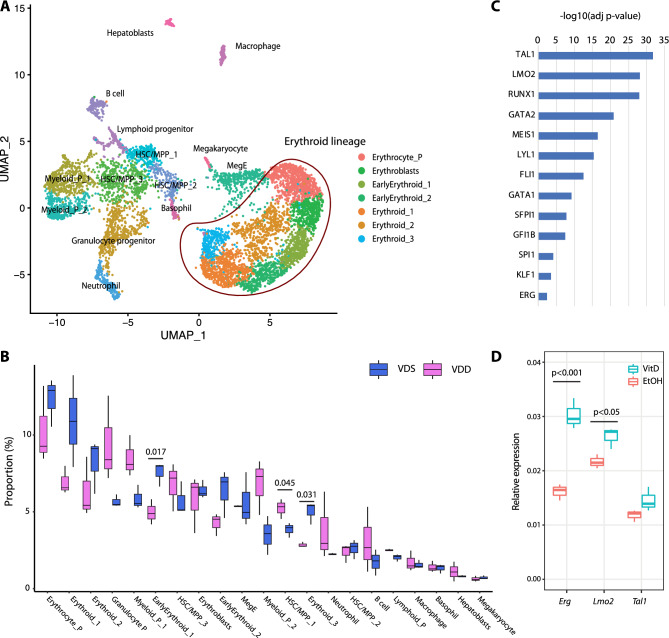
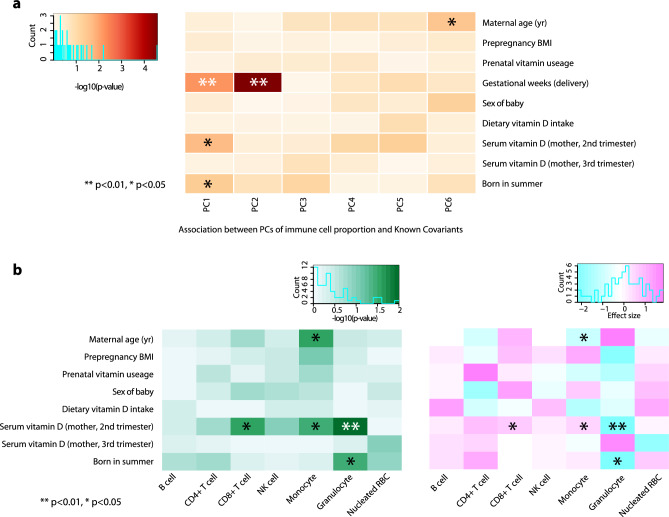
Vitamin D deficiency is a common deficiency worldwide, particularly among women of reproductive age. During pregnancy, it increases the risk of immune-related diseases in offspring later in life. However, how the body remembers exposure to an adverse environment during development is poorly understood. Herein, we explore the effects of prenatal vitamin D deficiency on immune cell proportions in offspring using vitamin D deficient mice established by dietary manipulation. We found that prenatal vitamin D deficiency alters immune cell proportions in offspring by changing the transcriptional properties of genes downstream of vitamin D receptor signaling in hematopoietic stem and progenitor cells of both the fetus and adults. Moreover, further investigations of the associations between maternal vitamin D levels and cord blood immune cell profiles from 75 healthy pregnant women and their term offspring also confirm that maternal vitamin D levels in the second trimester significantly affect immune cell proportions in the offspring. These findings imply that the differentiation properties of hematopoiesis act as long-term memories of prenatal vitamin D deficiency exposure in later life.


Conflict of interest statement

The authors declare no competing interests.

Figures

Fig. 1
Fig. 1
Study design. Six-week-old female C57BL/6J mice were randomly assigned to the VDsuf or VDdef diet and fed the assigned diet for 5 weeks before mating with a control diet-fed male. 1.5% calcium gluconate water was supplemented to VDdef diet-fed group. After delivery, all F0 mice were fed VDsuf diets. The offspring were fed VDsuf diet after weaning and maintained the diet until the sampling.
Fig. 2
Fig. 2
Prenatal vitamin D deficiency reduces CD4+ and CD8+ T cells in the peripheral blood and spleen in male offspring at the adult stage. T cell proportions in the peripheral blood (a) and spleen (b) were significantly decreased in VDD offspring. Each dot on the plot represents a sample (blood, n = 11 per group; spleen, n = 6 per group). The box shows the range between the first and third quartiles. The upper and lower whiskers represent 1.5 times the interquartile range, while the black bars indicate the median. The values shown in the plot are p-values calculated using Student’s t-test.
Fig. 3
Fig. 3
Prenatal vitamin D deficiency decreased the number of bone marrow cells and LSKs and concomitantly reduced lymphoid lineage cells at the adult stage. Prenatal vitamin D deficiency reduced the total number of bone marrow cells (n = 9 for VDD and n = 10 for VDS) (a) and the number of LSKs in bone marrow (n = 9 per group) (b). The differences in total HSC, long-term and short-term HSC, and three MPPs in the bone marrow (n = 9 for VDD and n = 10 for VDS) (c) and hematopoietic progenitor cells in the bone marrow (n = 9 per group) of VDD and VDS mice are displayed in the box plots (d). A significant decrease in MPP4, CLP, and Lin−/CD127+ cells was observed in VDD mice, indicating that prenatal vitamin D deficiency disproportionately affects the production of hematopoietic lineages. Each dot on the plot represents a sample. The box shows the range between the first and third quartiles. The upper and lower whiskers represent 1.5 times the interquartile range, while the black bars indicate the median. The values shown in the plot are p-values calculated using Student’s t-test.
Fig. 4
Fig. 4
Bulk RNA-seq analyses reveal the transcriptional alterations in MPP4. Bulk RNA-seq analysis identified significant differences in the transcriptional profiles of MPP4 between VDD and VDS (n = 3 per group). (a) The heatmap and dendrogram show a distinct clustering between VDD and VDS. (b) The volcano plot displays the − log10 adjusted p-values and log2 fold-change differences of the identified DEGs. Each dot represents a gene, and significant DEGs are indicated by red dots. (c) The GO enrichment analysis reveals that the up-regulated DEGs between VDD and VDS MPP4 are enriched in Leukocyte migration and chemotaxis-related genes. The dot plot shows the significance and the gene ratios of the top eight GO terms (left), and the Cnet plot indicates the identified DEGs of the top five GO terms (right). (d) The GO enrichment analysis reveals that the down-regulated DEGs between VDD and VDS MPP4 are enriched in the regulation of hematopoiesis-related genes. The dot plot shows the significance and the gene ratios of the top eight GO terms (left), and the Cnet plot indicates the identified DEGs of the top five GO terms (right).
Fig. 5
Fig. 5
Prenatal vitamin D deficiency alters cellular compositions of the embryonic liver, suggesting immune cell proportion changes start during development. (a) UMAP representation of single-cell RNA-seq gene expression data and cellular lineage identification of E14.5 fetal liver (n = 3 per group). (b) The boxplots indicate prenatal vitamin D deficiency alters cellular compositions of E14.5 fetal liver. (c) Genes downregulated in VDD E14.5 fetal liver are enriched in the genes regulated by hematopoietic transcription factors. (d) Treating HPC7 cells with 1-alpha-25-dihydroxyvitamin D3 significantly increases gene expression levels of Erg and Lmo2, suggesting these genes are regulated by VDR (n = 3 per treatment group).
Fig. 6
Fig. 6
Maternal serum vitamin D status in the second trimester is positively associated with the CD8+ T cell proportion in the cord blood. (a) The heatmap shows that the gestational week at the delivery has the strongest associations with immune cell composition variations assessed by the principal component (PC), followed by maternal serum vitamin D (2nd trimester) and being born in the summer season. (b) After adjusting for the sex of the fetus, gestational age, the season of T1, and the gestational week at T1, maternal serum vitamin D (2nd trimester) maintains significant associations with immune cell composition, specifically positive association with proportions of CD8+ T cell and monocytes, and negative association with granulocytes. Asterisks indicate the significance (**p < 0.01 and *p < 0.05, Student’s t-test). The left panel shows − log10(p-value), and the right panel shows the direction of the associations.

References

    1. Mostafa, W. Z. & Hegazy, R. A. Vitamin D and the skin: Focus on a complex relationship: A review. J. Adv. Res.6, 793–804 (2015). 10.1016/j.jare.2014.01.011 - DOI - PMC - PubMed
    1. Bodnar, L. M. et al. Maternal vitamin D deficiency increases the risk of preeclampsia. J. Clin. Endocrinol. Metab.92, 3517–3522 (2007). 10.1210/jc.2007-0718 - DOI - PMC - PubMed
    1. van der Pligt, P. et al. Associations of maternal vitamin D deficiency with pregnancy and neonatal complications in developing countries: A systematic review. Nutrients10, 640 (2018). 10.3390/nu10050640 - DOI - PMC - PubMed
    1. Zosky, G. R. et al. Vitamin D deficiency at 16 to 20 weeks’ gestation is associated with impaired lung function and asthma at 6 years of age. Ann. Am. Thorac. Soc.11, 571–577 (2014). 10.1513/AnnalsATS.201312-423OC - DOI - PubMed
    1. Weinert, L. S. & Silveiro, S. P. Maternal-fetal impact of vitamin D deficiency: A critical review. Matern. Child Health J.19, 94–101 (2015). 10.1007/s10995-014-1499-7 - DOI - PubMed