. 2024 Oct;43(20):4542-4577.
doi: 10.1038/s44318-024-00212-3. Epub 2024 Aug 27.

Heterochromatin formation and remodeling by IRTKS condensates counteract cellular senescence

Affiliations

Heterochromatin formation and remodeling by IRTKS condensates counteract cellular senescence

Jia Xie et al. EMBO J. 2024 Oct.

Abstract

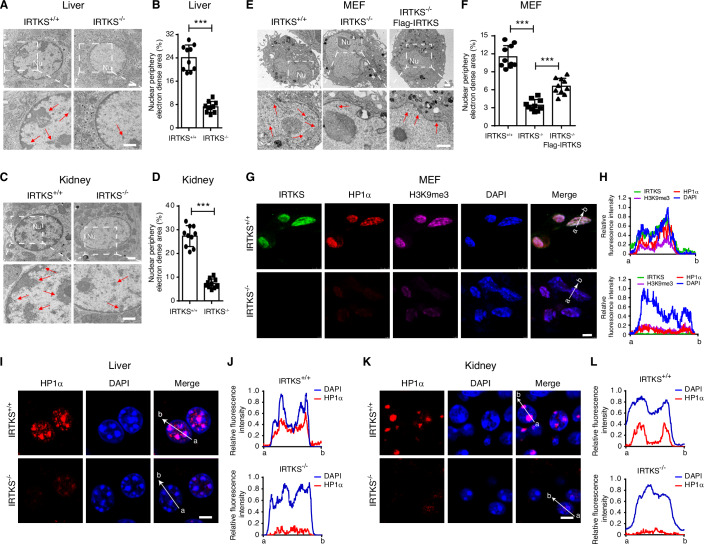
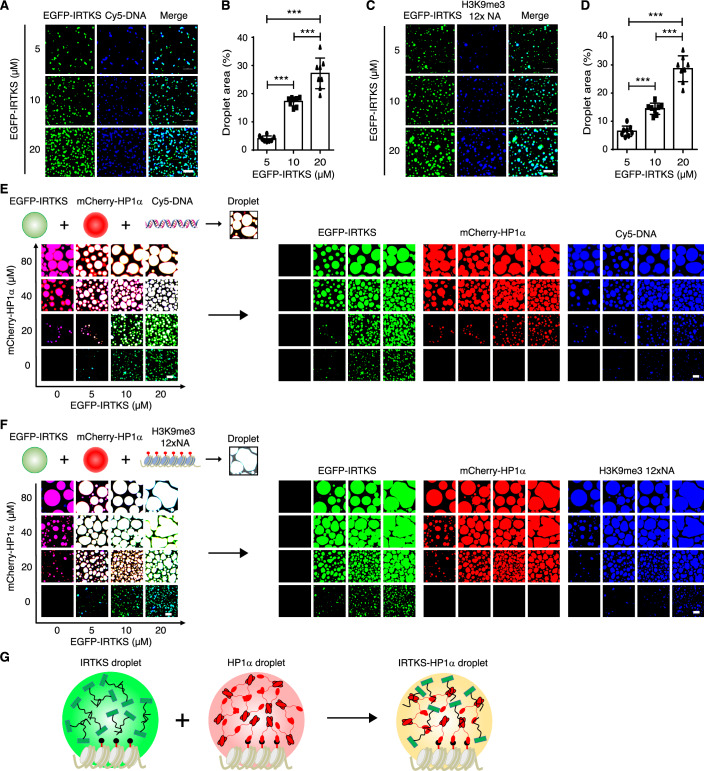
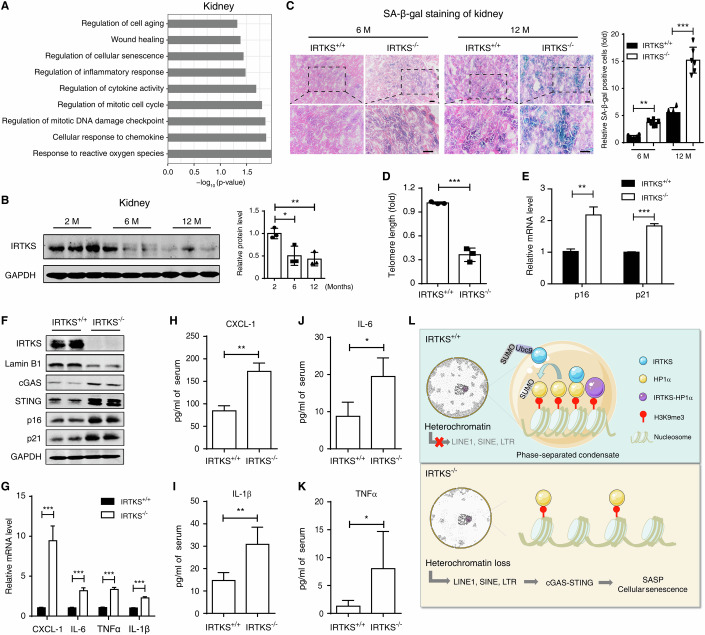
Heterochromatin, a key component of the eukaryotic nucleus, is fundamental to the regulation of genome stability, gene expression and cellular functions. However, the factors and mechanisms involved in heterochromatin formation and maintenance still remain largely unknown. Here, we show that insulin receptor tyrosine kinase substrate (IRTKS), an I-BAR domain protein, is indispensable for constitutive heterochromatin formation via liquid‒liquid phase separation (LLPS). In particular, IRTKS droplets can infiltrate heterochromatin condensates composed of HP1α and diverse DNA-bound nucleosomes. IRTKS can stabilize HP1α by recruiting the E2 ligase Ubc9 to SUMOylate HP1α, which enables it to form larger phase-separated droplets than unmodified HP1α. Furthermore, IRTKS deficiency leads to loss of heterochromatin, resulting in genome-wide changes in chromatin accessibility and aberrant transcription of repetitive DNA elements. This leads to activation of cGAS-STING pathway and type-I interferon (IFN-I) signaling, as well as to the induction of cellular senescence and senescence-associated secretory phenotype (SASP) responses. Collectively, our findings establish a mechanism by which IRTKS condensates consolidate constitutive heterochromatin, revealing an unexpected role of IRTKS as an epigenetic mediator of cellular senescence.

Keywords: Cellular Senescence; Heterochromatin Formation; IRTKS; Liquid-Liquid Phase Separation; SUMOylation.


Conflict of interest statement

The authors declare no competing interests.

Figures

Figure 1
Figure 1. IRTKS is required for heterochromatin formation.
(AD) Representative images of electron microscopy and statistical analysis of the electron-dense areas of the heterochromatin regions at the nuclear periphery in the liver (A, B) and kidney (C, D) tissues from WT and Irtks KO mice. Parts of the upper panel were enlarged and are shown in the lower panel. Red arrows indicate the electron-dense heterochromatin regions. Nu, nucleolus. n = 10 cells analyzed for each condition (B, ***p = 8.3836 × 10⁻⁸; D, ***p = 1.17 × 10⁻⁸). Scale bar, 1 µm. (E) Ectopically expressed IRTKS can rescue heterochromatin at the nuclear periphery of Irtks KO MEFs. Red arrows indicate the electron-dense heterochromatin regions. Nu, nucleolus. Scale bar, 1 µm. (F) Quantification of the electron-dense heterochromatin regions in MEFs. n = 10 cells analyzed for each condition. ***p = 7.34 × 10⁻¹³ (IRTKS+/+ vs IRTKS−/−) and 3.36 × 10⁻⁵ (IRTKS−/− vs IRTKS−/−-Flag-IRTKS). (G, H) Immunofluorescence images (G) of MEFs show that IRTKS (green) co-localizes with HP1α (red) and H3K9me3 (purple). Nuclei were counterstained with DAPI (blue). (H) Line scans of the images of a cell co-stained for IRTKS, HP1α, H3K9me3, and DAPI at the position depicted by the white arrow. Scale bar, 5 µm. (IL) Representative confocal images of HP1α foci (red) and nuclei (DAPI, blue) in the livers (I) and kidneys (K) of WT and Irtks KO mice. Quantification of lines scanned across HP1α foci and nuclei at the position depicted by the white arrow (J, L). Scale bar, 5 µm. Data are presented as the mean ± SD. Figure 1F was tested by one-way ANOVA followed by Tukey’s post hoc test. The remaining plots were tested by two-tailed Student’s t test. Source data are available online for this figure.
Figure 2
Figure 2. IRTKS recruits Ubc9 to SUMOylate HP1α.
(A) Electron microscopy images and quantification of the electron-dense heterochromatin regions in SK-Hep-1 cells treated with CRISPR/Cas9 single-guide RNA (sgRNA) lentivirus (sgHP1α) to knock out HP1α coupled with the Flag-IRTKS construct. Red arrows indicate the electron-dense heterochromatin regions. Nu, nucleolus. n = 8 cells analyzed for each condition. ***p = 3.39 × 10⁻¹¹, ns = 0.967612. Scale bar, 1 µm. (B) HP1α was abundantly SUMOylated by SUMO-1 when co-expressed with IRTKS in HEK293T cells, as detected by immunoprecipitation assay. HEK293T cells transfected with HA-IRTKS, Flag-HP1α, and GFP-SUMO1 were immunoprecipitated with an anti-Flag antibody for the SUMOylation assay, followed by western blotting with the indicated antibodies. (C) In vitro SUMOylation assay showing that IRTKS visibly enhanced HP1α SUMOylation in the presence of SUMO E1, E2 and SUMO-1 proteins. (D) Droplet formation assays showing that SUMO-mCherry-HP1α forms liquid-like droplets. mCherry-HP1α or SUMO-mCherry-HP1α was added to the droplet formation buffer to 40 µM. Scale bars, 10 μm. n = 8 fields for each group were quantified. ***p = 2.39 × 10⁻⁷. (E) Representative images and quantification of droplet formation at various protein concentrations (n = 6 fields for each group were quantified). ***p = 1.34 × 10⁻⁸ (10 μM vs 20 μM), 2.58 × 10⁻¹³ (10 μM vs 40 μM), and 1.96 × 10⁻⁹ (20 μM vs 40 μM). SUMO-mCherry-HP1α was added to droplet formation buffer to final concentrations as indicated. Scale bar, 10 μm. (F) Time-lapse fluorescence images showing that the droplets of SUMO-mCherry-HP1α rapidly fused. Scale bar, 2 μm. (G) Representative images and the fluorescence recovery curve of the SUMO-mCherry-HP1α FRAP experiments. Scale bar, 10 μm. n = 8 biological replicates for the FRAP curve construction. Data are presented as the mean ± SD. Figure 2D was tested by two-tailed Student’s t test. The remaining plots were tested by one-way ANOVA followed by Tukey’s post hoc test. Source data are available online for this figure.
Figure 3
Figure 3. IRTKS undergoes LLPS in vivo and in vitro.
(A) Prediction of disordered regions by PONDR algorithms. (B) Representative images of droplet formation showing that EGFP-IRTKS has liquid-like properties. EGFP served as a negative control. EGFP-IRTKS and EGFP were added to droplet formation buffer to 20 µM. Scale bar, 5 µm. (C) Turbidity assay demonstrating phase separation of IRTKS. n = 6 (two independent experiments, each with three technical repeats). ns = 0.7066, ***p = 1.5 × 10⁻²². (D) Representative images and quantification of the droplet formation ability of EGFP-IRTKS in the absence or presence of 5% 1,6-hexanediol (n = 8 fields for each group were quantified). EGFP-IRTKS was added to droplet formation buffer to 10 µM. ***p = 6.19 × 10⁻⁷. Scale bar, 5 μm. (E) Time-lapse fluorescence images showing that the EGFP-IRTKS droplets rapidly fused. Scale bar, 1 μm. (F) Representative FRAP images showing that the EGFP-IRTKS signal within the puncta recovered within a few minutes. The fluorescence recovery curve of the EGFP-IRTKS FRAP experiments (n = 8 biological replicates for the FRAP curve construction). Scale bar, 1 μm. (G) A model showing that the interactions among IDRs (black tails) of IRTKS mediate the formation of phase-separated liquid droplets in vitro. (H) Immunofluorescent staining of IRTKS (green) and DAPI (blue) in liver sections of WT and Irtks KO mice. Scale bar, 5 μm. (I) Immunofluorescent staining of IRTKS (green) and DAPI (blue) in liver sections of mice infected with empty vector AAV8 (AAV-E.V.) (control) or AAV8-IRTKS. Scale bar, 5 μm. (J) Immunofluorescence imaging of endogenously mEGFP-tagged IRTKS (green) and DAPI (blue) in HEK293T cells. Scale bar, 10 μm. (K) Representative live-cell images of the endogenous mEGFP-tagged IRTKS puncta shown by FRAP experiments in HEK293T cells. Scale bar, 5 μm. (L) Representative images of live cell imaging of EGFP (control) or EGFP-IRTKS-expressing HEK293T cells. Scale bar, 10 μm. (M) Representative live-cell images and quantification of EGFP-IRTKS-expressing HEK293T cells before and after treatment with 5% 1,6-hexanediol (n = 3 biological replicates for each group). Scale bar, 10 μm. (N) Representative live-cell images and the fluorescence recovery curve of the EGFP-IRTKS FRAP experiments (n = 8 biological replicates for the FRAP curve construction). Scale bar, 2 μm. Data are presented as the mean ± SD or mean ± SEM. Figure 3C was tested by one-way ANOVA followed by Tukey’s post hoc test. Figure 3D was tested by two-tailed Student’s t test. Source data are available online for this figure.
Figure 4
Figure 4. IRTKS participates in heterochromatin-associated phase separation.
(A, B) Liquid‒liquid phase separation assay of EGFP-IRTKS proteins at different concentrations mixed with DNA oligos. A total of 160 nM fluorescent DNA for the droplet assay was labeled with Cy5 fluorophore modifications (n = 8 fields for each group were quantified). ***p = 8.44 × 10⁻⁸ (5 μM vs 10 μM), 3.96 × 10⁻¹² (5 μM vs 20 μM), and 5.56 × 10⁻⁶ (10 μM vs 20 μM). Scale bar, 5 µm. (C, D) In vitro phase separation assay of EGFP-IRTKS proteins at various concentrations mixed with reconstituted H3K9me3 12× nucleosomal arrays (NA). Reconstituted H3K9me3 12× NA (330 nM) for the droplet assay was stained using DAPI (n = 8 fields for each group were quantified). ***p = 3.97 × 10⁻⁵ (5 μM vs 10 μM), 2.38 × 10⁻¹² (5 μM vs 20 μM), and 7.89 × 10⁻⁹ (10 μM vs 20 μM). Scale bar, 5 µm. (E) Droplet experiments with DNA oligos examining the ability of IRTKS to form condensates with HP1α. Concentrations of IRTKS and HP1α are indicated at the bottom and left of the images, respectively. Fluorescent naked DNA for droplet assays was labeled with a Cy5 fluorophore modification. Scale bars, 5 μm. (F) Liquid‒liquid phase separation assay with reconstituted H3K9me3 12× NA to examine the ability of IRTKS to form condensates with HP1α and reconstituted H3K9me3 12× NA stained using DAPI. Scale bar, 5 µm. (G) A schematic model showing that IRTKS and HP1α droplets can be co-incorporated into the phase-separated heterochromatin condensates with a nucleosomal array. Data are presented as the mean ± SD and the p value of one-way ANOVA followed by Tukey’s post hoc test. Source data are available online for this figure.
Figure 5
Figure 5. IRTKS deficiency leads to the genome-wide epigenetic alterations.
(A, B) ChIP-seq enrichment profiles of H3K9me3 (A) and HP1α (B) peaks showing the reduction of H3K9me3 and HP1α signals at repetitive sequence regions (DNA transposon, low complexity, simple repeat, SINE, LINE, and LTR) in the livers of Irtks KO mice. (C, D) Enrichment of H3K9me3 (C, ***p = 7.12 × 10⁻⁵ (SINE), 3.52 × 10⁻⁵ (LINE1), and 1.93 × 10⁻⁷ (IAP)) and HP1α (D, ***p = 6.23 × 10⁻⁶ (SINE), 1.61 × 10⁻⁶ (LINE1), and 8.73 × 10⁻¹⁰ (IAP)) within the regions of repetitive sequences (LINE1, SINE and IAP) in the livers of WT and Irtks KO mice as measured by ChIP‒qPCR. n = 3 animals for each condition. (E) Visualization of the co-localization of H3K9me3 and HP1α on representative genomic regions corresponding to the indicated repetitive sequences in livers from WT and Irtks-KO mice. (F) Heatmaps showing ATAC signals ranging from 5 kb upstream to 5 kb downstream of ATAC-seq peaks of repetitive sequence regions (LTR, LINE, and simple repeats) in livers from WT and Irtks KO mice. (G) The expression levels of repetitive sequences and non-repetitive sequences (non-REs) in the livers of WT and Irtks KO mice, as shown by RNA-seq analysis. Y-axis indicated the log2 counts, as normalized by the respective expression of Actb with alignment to 104. n = 4 animals for each condition. Data are presented as the mean ± SD or mean ± SEM. The p values of Fig. 5A, B, F and G were provided in Source data. Figure 5C and D were tested by one-way ANOVA followed by Tukey’s post hoc test. The remaining plots were tested by Student’s t test. Source data are available online for this figure.
Figure 6
Figure 6. IRTKS deficiency results in cellular senescence.
(A) GO analysis of DEGs in the kidneys of Irtks-KO mice. (B) Western blotting images and quantification showing that IRTKS was downregulated in the kidneys of mice at the indicated ages (n = 3 animals for each condition). *p = 0.0105, **p = 0.0056. Fold change represents the normalized IRTKS signal (IRTKS/GAPDH). (C) Representative images and quantification of SA-β-gal staining in the cortex and medulla cells of kidneys of WT and Irtks KO mice at the indicated ages. Scale bars, 100 µm. n = 6 animals for each condition. **p = 0.0017, ***p = 4.65 × 10⁻¹¹. (D) Telomere length analysis in kidneys of WT and Irtks-KO mice by qPCR. n = 3 animals for each condition. ***p = 1.94 × 10⁻⁴. (E) p21 and p16 transcriptional expression in kidneys of WT and Irtks-KO mice by qPCR. n = 3 animals for each condition. **p = 0.0015, ***p = 2.19 × 10⁻⁶. (F) Western blotting analyses of cellular senescence-related molecules in kidneys of WT and Irtks-KO mice. GAPDH was used as the loading control. (G) SASP-associated genes are significantly upregulated in kidneys of Irtks KO mice compared to those of WT mice. n = 6 animals for each condition. ***p = 2.76 × 10⁻⁴ (CXCL-1), 1.78 × 10⁻⁵ (IL-6), 3.23 × 10⁻⁸ (TNFα), 3.46 × 10⁻⁷ (IL-1β). (HK) Key SASP-associated molecules, including CXCL1 (H, **p = 0.0058), IL1β (I, **p = 0.0034), IL6 (J, *p = 0.0161), and TNFα (K, *p = 0.0472), were significantly elevated in sera from Irtks KO mice compared with those in sera from WT mice, as measured by ELISA. n = 4 animals for each condition. (L) A working model illustrating the mechanism by which IRTKS deficiency increases chromatin accessibility and repetitive DNA sequence reactivation, thus accelerating cellular senescence. Data are presented as the mean ± SD or mean ± SEM. Figure 6D,H–K were tested by two-tailed Student’s t test. The remaining plots were tested by one-way ANOVA followed by Tukey’s post hoc test. Source data are available online for this figure.
Figure EV1
Figure EV1. IRTKS regulates heterochromatin formation.
(A, B) Quantification of electron-dense regions (EDRs) around the nucleolus of the livers (A, ***p = 2.72 × 10⁻¹⁰) and kidneys (B, ***p = 2.73 × 10⁻⁹) from WT and Irtks KO mice. n = 10 cells analyzed for each condition. (CE) Representative images (C) and quantification of EDRs at the nuclear periphery (D, ***p = 3.09 × 10⁻⁹) and around the nucleolus (E, ***p = 5.49 × 10⁻¹¹) of the stomach tissues of WT and Irtks KO mice. Red arrows indicate the electron-dense heterochromatin regions. Nu, nucleolus. n = 10 cells analyzed for each condition. Scale bar, 1 µm. (F) Quantification of EDRs around the nucleolus in MEF cells. n = 10 cells analyzed for each condition. ***p = 1.22 × 10⁻¹³, *p = 0.0134. (G, H) Electron microscopy images (G) and quantification of EDRs at the nuclear periphery (H, ***p = 2.14 × 10⁻⁸) and around the nucleolus (I), ***p = 1.19 × 10⁻¹⁰) in WT and Irtks-KO SK-Hep-1 cells. Red arrows indicate the electron-dense heterochromatin regions. Nu, nucleolus. n = 10 cells analyzed for each condition. Scale bar, 1 µm. (JO) Electron microscopy images and quantification of the electron-dense heterochromatin regions at the nuclear periphery and around the nucleolus in MEFs (JL, respectively) and SK-Hep-1 cells (MO, respectively) that were transfected with empty vector or Flag-IRTKS construct. Red arrows indicate the electron-dense heterochromatin regions. Nu, nucleolus. n = 10 cells analyzed for each condition (K, ***p = 1.39 × 10⁻⁹; L, *p = 0.0370; N, ***p = 5.68 × 10⁻⁶; O, ***p = 6.90 × 10⁻⁸). Scale bar, 1 µm. (P, Q) Representative confocal images (P) and line scan analysis (Q) of HP1α foci (red) and nuclei (DAPI, blue) in the stomach tissues of WT and Irtks KO mice. Quantification of lines scanned across HP1α foci and nuclei at the position depicted by the white arrow. Scale bar, 5 µm. (R, S) Western blotting analyses of HP1α expression in the livers (R) and kidneys (S) of WT and Irtks-KO mice. GAPDH was used as the loading control. (T) Representative confocal images and line scan analysis (right) on H3K9me3 (green) and nuclei (DAPI, blue) in the livers of WT and Irtks KO mice. Quantification of lines scanned across H3K9me3 foci and nuclei at the position depicted by the white arrow. Scale bar, 5 µm. (U) Representative confocal microscopy and line scan analysis of SK-Hep-1 cells showing the location of EGFP-HP1α foci. Nuclei were labeled with Hoechst 33342 (blue). Quantification of lines scanned across HP1α foci and nuclei at the position depicted by the white arrow. Scale bar, 5 µm. (V) Live-cell images and fluorescence recovery curves of FRAP experiments of EGFP-HP1α in SK-Hep-1 cells. Red arrow indicates the bleached point, which is boxed and amplified in the images on the right. n = 8 biological replicates for the FRAP curve construction. ***p = 3.10 × 10⁻⁹. Scale bar, 5 µm. (W) Representative confocal microscopy and line scan analysis of MEF cells showing the location of EGFP-HP1α foci. Nuclei were labeled with Hoechst 33342 (blue). Quantification of lines scanned across HP1α foci and nuclei at the position depicted by the white arrow. Scale bar, 5 µm. (X) Live-cell images and fluorescence recovery curves of FRAP experiments of EGFP-HP1α in MEF cells. Red arrow indicates the bleached point, which is boxed and amplified in the images on the right. n = 8 biological replicates for the FRAP curve construction. ***p = 1.03 × 10⁻⁶. Scale bar, 5 µm. Data are presented as the mean ± SD. Figure EV1V and y were tested by two-way ANOVA. The remaining plots were tested by two-tailed unpaired Student’s t test. Source data are available online for this figure.
Figure EV2
Figure EV2. IRTKS directly associates with HP1α.
(A) Western blotting analysis of several important epigenetic factors associated with heterochromatin formation in liver tissues from WT and Irtks KO mice. GAPDH was used as the loading control. (B) Western blotting analysis of HP1α and IRTKS expression in SK-Hep-1 cells treated with CRISPR/Cas9 single-guide RNA (sgRNA) lentivirus (sgHP1α), to knock out HP1α, coupled with the Flag-IRTKS construct. GAPDH was used as the loading control. (C) Western blotting analysis of HP1α and IRTKS expression in these SK-Hep-1 cells treated with CRISPR/Cas9 single-guide RNA (sgRNA) lentivirus (sgIRTKS) to knock out IRTKS, and then coupled with the Flag-HP1α construct. GAPDH was used as the loading control. (D) Electron microscopy images and quantification (bottom) of the electron-dense heterochromatin regions in SK-Hep-1 cells that were genetically engineered with CRISPR/Cas9 single-guide RNA (sgRNA) lentivirus (sgIRTKS) to knock out IRTKS, and then transfected with the Flag-HP1α construct. Red arrows indicate the electron-dense heterochromatin regions. Nu, nucleolus. n = 10 cells analyzed for each condition. ***p = 7.52 × 10⁻¹¹ (sgControl vs sgIRTKS) and 4 × 10⁻⁵ (sgIRTKS vs sgIRTKS-Flag-HP1α). Scale bar, 1 µm. (E, F) IRTKS and HP1α reciprocally interact directly in a GST pull-down assay. Equivalent amounts of His-HP1α were incubated with either GST (negative control) or GST-IRTKS. After GST pulldown, HP1α was detected by western blotting. The mirror experiment was performed using His-IRTKS and GST-HP1α. (G, H) The reciprocal interaction between IRTKS and HP1α was detected by co-immunoprecipitation (co-IP) with anti-IRTKS and anti-HP1α antibodies in MEFs (G) and HEK293T cells (H). The immunoglobulin G (IgG) group was the negative control. (I) Schematic summaries of the interactions between diverse IRTKS and HP1α truncations. (J) Direct interaction between full-length or truncated GST-HP1α proteins and His-IRTKS revealed by GST pulldown assay. Full-length and truncated GST-HP1α proteins were visualized by Coomassie blue staining. (K) GST pulldown assays were performed with recombinant His-HP1α and full-length or truncated GST-IRTKS. The pulldown samples were analyzed by western blotting. (L) A 3D structural model of the IRTKS-HP1α complex was constructed using the Z-DOCK server. The 3D structures of IRTKS and HP1α were predicted by AlphaFold algorithms (upper panel). The interaction between IRTKS and HP1α is depicted by the yellow and blue colors, respectively. Details of the key residues of HP1α that interact with IRTKS are also shown in the lower panel. Data are presented as the mean ± SD. Figure EV2D was tested by one-way ANOVA followed by Tukey’s post hoc test. Source data are available online for this figure.
Figure EV3
Figure EV3. SUMOylated HP1α follows the principle of phase separation.
(A) RT–qPCR showing RNA levels of HP1α in the livers, kidneys, and MEFs of WT and Irtks-KO mice. Relative RNA levels are normalized to GAPDH. n = 3 biological replicates. ns = 0.9397 (liver), 0.3482 (kidney), and 0.4195 (MEF). (B) Western blotting analysis showed the stability of HP1α in HEK293T cells that were transfected with empty vector or Flag-IRTKS construct after treatment with the protein synthesis inhibitor cycloheximide (CHX, 100 μg/ml) at the indicated time. (C) The HP1α level was not restored by MG132 (10 μM, 9 h), a proteasome inhibitor, in MEFs. (D) IRTKS can directly interact with Ubc9 in a GST pull-down assay in vitro. (E) The reciprocal interaction between IRTKS and Ubc9 was detected by co-immunoprecipitation (co-IP) with anti-IRTKS or anti-Ubc9 antibodies in HEK293T cells. The immunoglobulin G (IgG) group was the negative control. (F) The SUMO-1-mediated SUMOylation of HP1α was obviously enhanced by the co-expressed IRTKS in NIH3T3 cells, as detected by immunoprecipitation assay. NIH3T3 cells were transfected with HA-IRTKS, Flag-HP1α, and GFP-SUMO1, and then were immunoprecipitated with an anti-Flag antibody for the SUMOylation assay, followed by western blotting with the indicated antibodies. (G, H) Coomassie blue-stained images of purified GST-HP1α (G), GST-SUMO1, SAE1/2, and Ubc9 (H). (I) Western blotting analysis showing that mCherry-HP1α protein was SUMOylated by coexpression with E1E2SUMO1. (J) Results of Acquity UPLC I-class/VION IMS QTOF analysis for mCherry-HP1α and SUMO-mcherry-HP1α. The observed masses of mCherry-HP1α and SUMO-mCherry-HP1α proteins are also shown. The observed masses of SUMO-mCherry-HP1α proteins are increased compared with that of unmodified mCherry-HP1α. (K) Representative images and quantification of droplet formation at various salt concentrations. SUMO-mCherry-HP1α was added to droplet formation buffer to achieve a 20 µM protein concentration with a final NaCl concentration as indicated (n = 8 fields for each group were quantified). ***p = 6.6 × 10⁻⁷ (50 mM vs 150 mM), 2.03 × 10⁻⁹ (50 mM vs 300 mM), and 4.21 × 10⁻⁴ (150 mM vs 300 mM). Scale bar, 5 μm. (L) The droplet formation ability of SUMO-mCherry-HP1α was significantly depressed by 5% 1,6-hexanediol treatment. n = 8 fields for each group were quantified. ***p = 9.36 × 10⁻⁵. Scale bar, 5 μm. Data are presented as the mean ± SD or mean ± SEM. Figure EV3K was tested by one-way ANOVA followed by Tukey’s post hoc test. The remaining plots were tested by two-tailed Student’s t test. Source data are available online for this figure.
Figure EV4
Figure EV4. IRTKS possesses phase-separated properties.
(A) Schematic diagram of IRTKS domains and intrinsically disordered region (IDR) prediction by the D2P2 algorithm. (B) Coomassie blue staining image of purified EGFP and EGFP-IRTKS proteins. (C) Representative images of droplet formation showing that mCherry-HP1α has liquid-like properties. mCherry and mCherry-HP1α were added to droplet formation buffer to 40 µM. Scale bar, 5 µm. (D) In vitro droplet assay of mCherry-HP1α at the indicated concentrations (n = 8 fields for each group were quantified). ***p = 1.55 × 10⁻⁶ (20 μM vs 40 μM), 6.48 × 10⁻²³ (20 μM vs 80 μM), and 1.42 × 10⁻²¹ (40 μM vs 80 μM). Scale bar, 5 µm. (E) Coomassie blue staining image of purified His-IRTKS. (F) Representative DIC images of droplet formation showing that His-IRTKS has liquid-like properties. His-IRTKS was added to droplet formation buffer to 20 µM. Scale bar, 5 µm. (G) Representative images and quantification of droplet formation at various protein concentrations. EGFP-IRTKS was added to droplet formation buffer to final concentrations as indicated (n = 8 fields for each group were quantified). ***p = 4.13 × 10⁻⁸ (5 μM vs 10 μM), 4.29 × 10⁻¹⁵ (5 μM vs 20 μM) and 1.55 × 10⁻¹⁰ (10 μM vs 20 μM). Scale bar, 5 μm. (H) Visualization of turbidity associated with droplet formation. Tubes containing EGFP (left pair) and EGFP-IRTKS (right pair) in the presence (+) or absence (–) of PEG-8000 are shown. Blank tubes are included between pairs for contrast. (I) Representative images and quantification of droplet formation at various salt concentrations. EGFP-IRTKS was added to droplet formation buffer to achieve a 10 µM protein concentration with a final NaCl concentration as indicated (n = 8 fields for each group were quantified). ***p = 7.87 × 10⁻¹⁵ (50 mM vs 150 mM), 6.92 × 10⁻¹⁷ (50 mM vs 300 mM), and 4.65 × 10⁻⁵ (150 mM vs 300 mM). Scale bar, 5 μm. (J) Coomassie blue staining image of purified EGFP-IRTKS truncations (I-BAR, SH3, and WH2). (K) A schematic summary of the droplet formation ability of full-length or truncated EGFP-IRTKS and representative images of droplet formation of various EGFP-IRTKS truncations. Scale bar, 5 μm. (L) Heatmap analyzing the amino acid composition and position of IRTKS. Each row represents information for a single amino acid. The length of the row corresponds to the length of the IRTKS protein. The purple bar represents the IDR of IRTKS shown in Extended Data Fig. 4a. (M) Predictions of IDRs of IRTKS with mutation of all prolines (P), serines (S) or threonines (T) to alanine (A) using the PONDR algorithm. (N) Mutating all prolines to alanine (P to A) disrupts phase separation. Representative images of droplet formation by wild-type IRTKS-IDR or the IRTKS-IDR P-to-A mutant fused to EGFP. Scale bar, 5 μm. (O) Quantification of IRTKS puncta number per 10 cells was analyzed in the livers from WT and Irtks KO mice. n = 10 for each group. ***p = 7.21 × 10⁻⁵. (P, Q) Immunofluorescent staining (P) of IRTKS (green) and DAPI (blue) and quantification (Q, ***p = 1.1 × 10⁻⁴) of IRTKS puncta number per 10 cells in kidney sections of WT and Irtks KO mice. Scale bar, 5 μm. n = 10 for each group. (R) Quantification of IRTKS puncta number per 10 cells was analyzed in the livers of these mice infected with AAV8-IRTKS and empty vector AAV8 (AAV-E.V.) as control. ***p = 1.43 × 10⁻⁵. n = 10 for each group. (S) Schematic of the strategy used to generate endogenously mEGFP-tagged IRTKS HEK293T cells. (T) Western blotting analysis of HEK293T cells with mEGFP knock-in at the endogenous IRTKS locus. (U) Time-lapse fluorescence images showing that the endogenous mEGFP-tagged IRTKS puncta rapidly fused in HEK293T cell. The fused puncta are boxed and enlarged in the images on the right. Scale bar, 5 μm. (V) Live-cell imaging of endogenous mEGFP-tagged IRTKS puncta in HEK293T cells. The white box indicated the fission events of IRTKS puncta and enlarged in the images on the right. Scale bar, 5 μm. (W) The fluorescence recovery curves of endogenous mEGFP-tagged IRTKS puncta shown by FRAP experiments (n = 8 biological replicates for the FRAP curve construction). (X) Fusion events of droplets over time indicate liquid-like material properties of EGFP-IRTKS in HEK293T cells. Red arrows indicate fusion events. Scale bar, 10 μm. Data are presented as the mean ± SD. Figures EV4O, Q and R were tested by two-tailed Student’s t test. The remaining plots were tested by one-way ANOVA followed by Tukey’s post hoc test. Source data are available online for this figure.
Figure EV5
Figure EV5. Liquid‒liquid phase separation of IRTKS and HP1α droplets with diverse DNA-containing substrates.
(A) Representative images of droplet formation at different concentrations of IRTKS and HP1α protein. Concentrations of IRTKS and HP1α are indicated at the bottom and left of the images, respectively. Scale bars, 5 μm. (B) Representative images of droplet formation at various concentrations of EGFP-IRTKS and SUMO-mCherry-HP1α protein. Concentrations of EGFP-IRTKS and SUMO-mCherry-HP1α are indicated at the bottom and left of the images, respectively. Scale bars, 10 μm. (C, D) In vitro phase separation assay of EGFP-IRTKS protein at various concentrations mixed with nucleosomal DNA. A total of 6 nM nucleosomal DNA for the droplet assay was stained using DAPI (n = 8 fields for each group were quantified). ***p = 3.3 × 10⁻⁶ (5 μM vs 10 μM), 8.34 × 10⁻¹⁷ (5 μM vs 20 μM), and 3.42 × 10⁻¹⁴ (10 μM vs 20 μM). Scale bar, 5 µm. (E, F) Droplet formation of various concentrations of EGFP-IRTKS protein mixed with reconstituted native 12× nucleosomal arrays (NA). A total of 330 nM reconstituted native 12× NA for the droplet assay was stained using DAPI (n = 8 fields for each group were quantified). *p = 0.0162 (5 μM vs 10 μM), ***p = 1.22 × 10⁻¹⁵ (5 μM vs 20 μM), and 1.71 × 10⁻¹⁴ (10 μM vs 20 μM). Scale bar, 5 µm. (G) Liquid‒liquid phase separation assay with nucleosomal DNA to examine the ability of IRTKS to form condensates with HP1α and nucleosomal DNA stained using DAPI. Scale bar, 5 µm. (HJ) A phase diagram of IRTKS and HP1α mixed with Cy5-labeled DNA oligos (H), nucleosomal DNA (I), and reconstituted H3K9me3 12× NA (J). n = 8 fields for each group were quantified. (K, L) Representative images (K) and line scan analysis (L) of EGFP or EGFP-IRTKS with different truncations (full-length, I-BAR, IDR and IDR-mutant) in NIH3T3 cells. Nuclei were labeled with Hoechst 33342. Quantification of lines scanned across EGFP or EGFP-IRTKS with different truncations and nuclei at the position depicted by the white arrow. Scale bar, 2 µm. (M, N) Live-cell images (M) and line scan analysis (N) of EGFP or EGFP-IRTKS-expressing SK-Hep-1 cells. Nuclei were labeled with Hoechst 33342. Quantification of lines scanned across EGFP or EGFP-IRTKS and nuclei at the position depicted by the white arrow. Scale bar, 5 µm. (O, P) Electron microscopy images (O) and quantification of the electron-dense heterochromatin regions (P) in MEF cells overexpressed EGFP or EGFP-IRTKS with different truncations (full-length, I-BAR, IDR, and IDR-mutant). Red arrows indicate the electron-dense heterochromatin regions. Nu, nucleolus. n = 8 cells analyzed for each condition. Scale bar, 1 µm. (Q) Enrichment of H3K9me3 and HP1α within the regions of repetitive sequences (LINE1, IAP, and SINE) in the MEFs of WT and Irtks KO mice as measured by ChIP-qPCR. n = 3 technical replicates in independent experiments. The p values of Fig. EV5P and Q were provided in Source data. Data are presented as the mean ± SD or mean ± SEM and the p value of one-way ANOVA followed by Tukey’s post hoc test. Source data are available online for this figure.

References

    1. Ahmed S, Goh WI, Bu W (2010) I-BAR domains, IRSp53 and filopodium formation. Semin Cell Dev Biol 21:350–356 - PubMed
    1. Aitio O, Hellman M, Kazlauskas A, Vingadassalom DF, Leong JM, Saksela K, Permi P (2010) Recognition of tandem PxxP motifs as a unique Src homology 3-binding mode triggers pathogen-driven actin assembly. Proc Natl Acad Sci USA 107:21743–21748 - PMC - PubMed
    1. Alberti S, Gladfelter A, Mittag T (2019) Considerations and challenges in studying liquid-liquid phase separation and biomolecular condensates. Cell 176:419–434 - PMC - PubMed
    1. Allshire RC, Madhani HD (2018) Ten principles of heterochromatin formation and function. Nat Rev Mol Cell Biol 19:229–244 - PMC - PubMed
    1. Becker JS, Nicetto D, Zaret KS (2016) H3K9me3-dependent heterochromatin: barrier to cell fate changes. Trends Genet 32:29–41 - PMC - PubMed