. 2024 Oct;43(20):4492-4521.
doi: 10.1038/s44318-024-00176-4. Epub 2024 Aug 27.

A cell state-specific metabolic vulnerability to GPX4-dependent ferroptosis in glioblastoma

Affiliations

A cell state-specific metabolic vulnerability to GPX4-dependent ferroptosis in glioblastoma

Matei A Banu et al. EMBO J. 2024 Oct.

Abstract

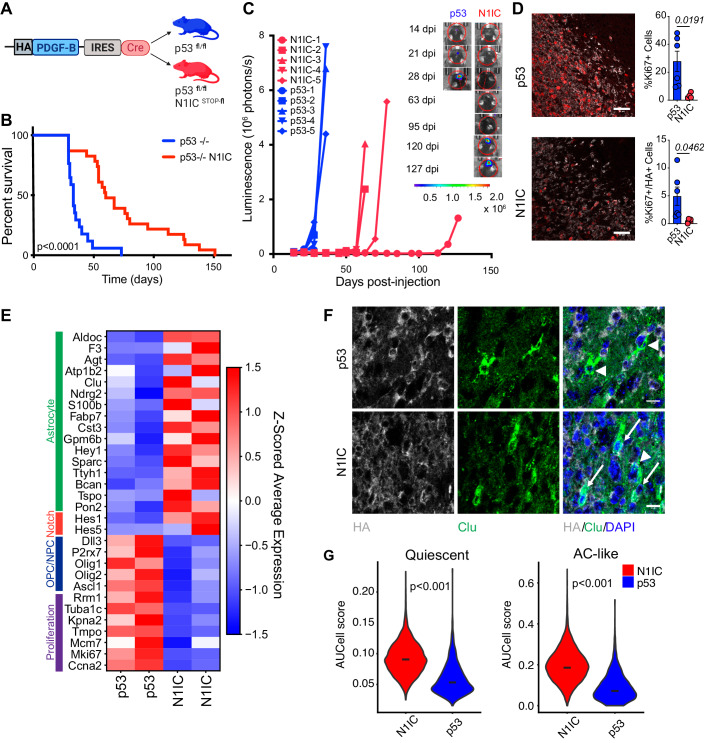
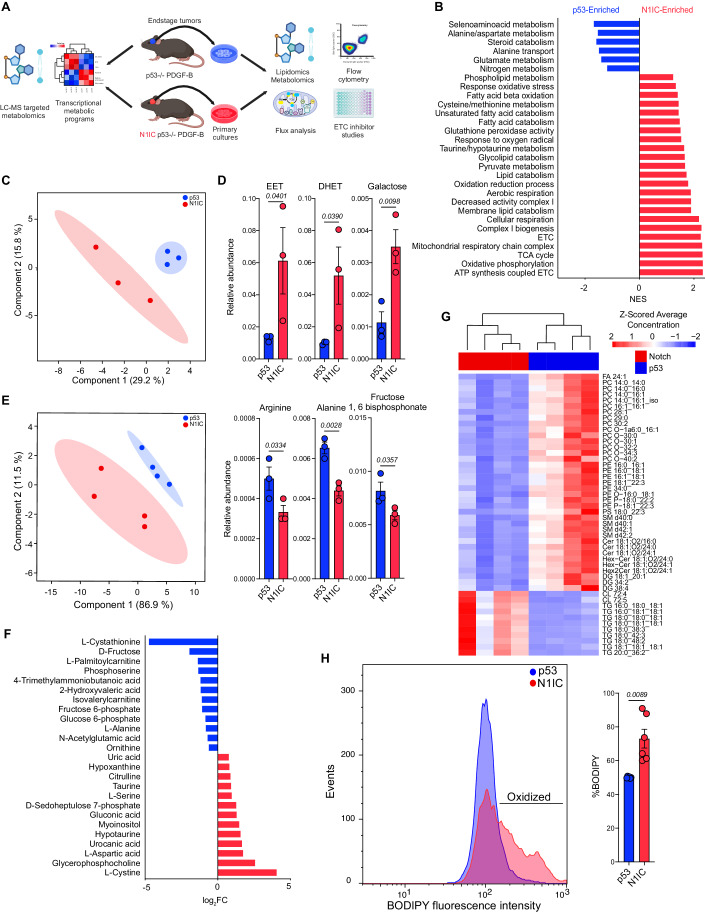
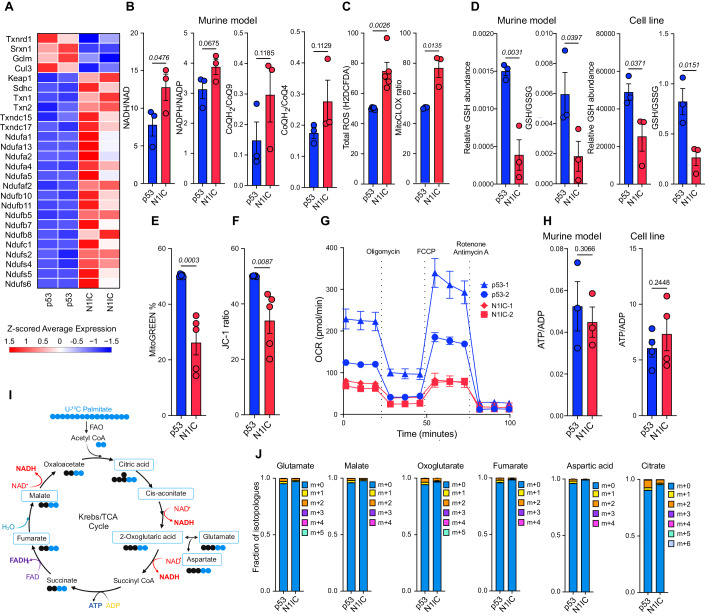
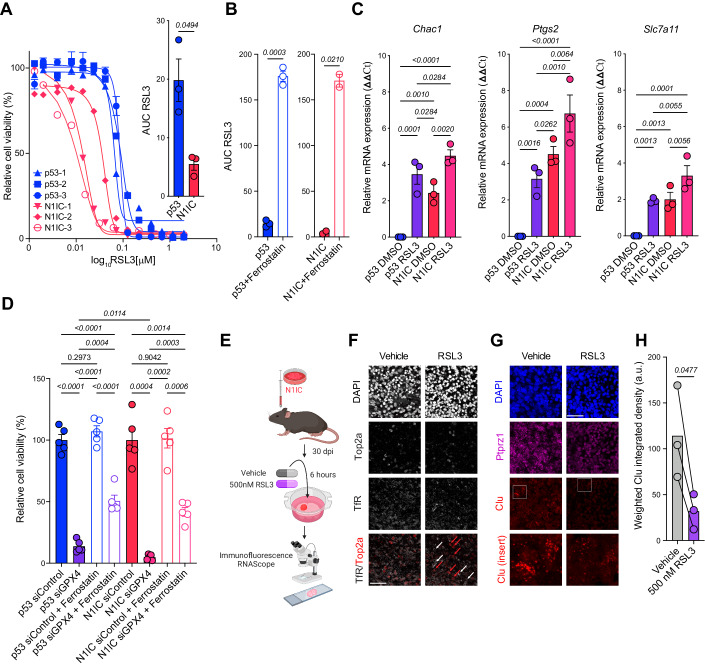
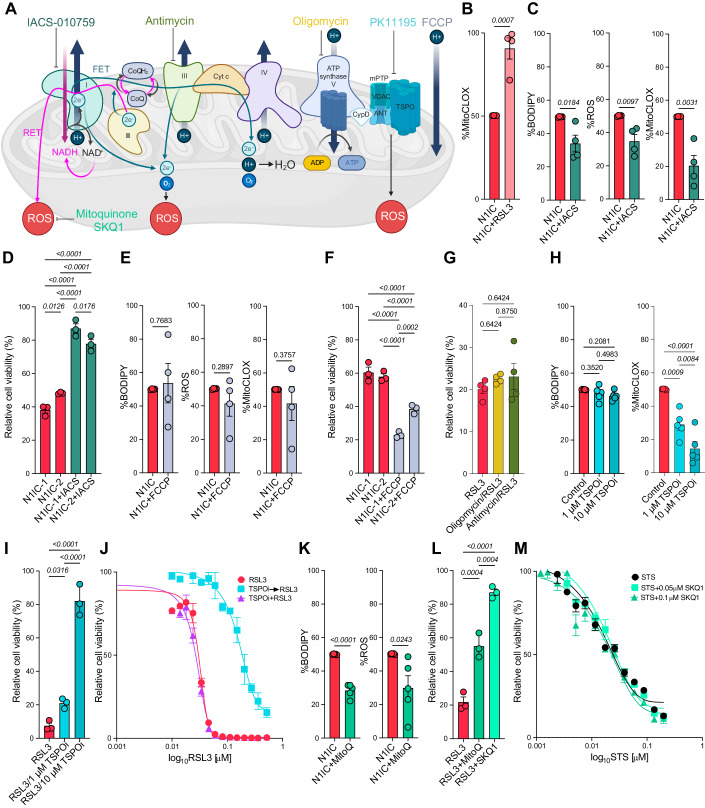
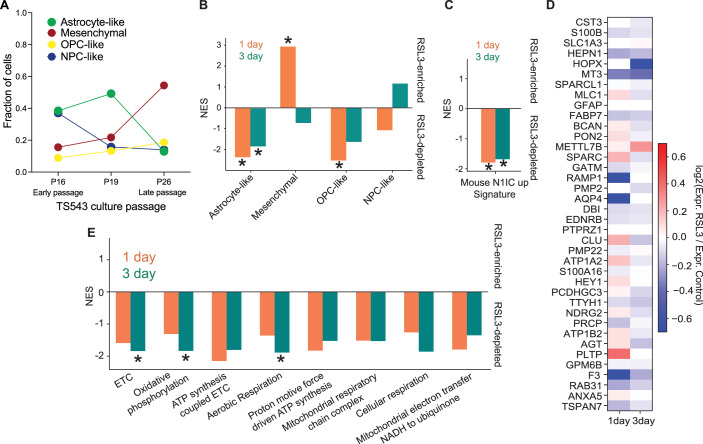
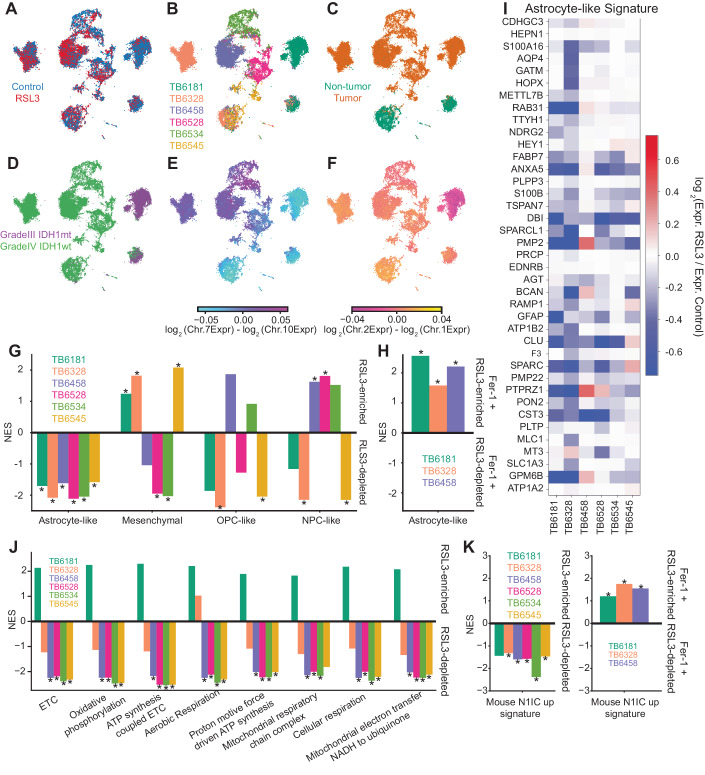
Glioma cells hijack developmental programs to control cell state. Here, we uncover a glioma cell state-specific metabolic liability that can be therapeutically targeted. To model cell conditions at brain tumor inception, we generated genetically engineered murine gliomas, with deletion of p53 alone (p53) or with constitutively active Notch signaling (N1IC), a pathway critical in controlling astrocyte differentiation during brain development. N1IC tumors harbored quiescent astrocyte-like transformed cell populations while p53 tumors were predominantly comprised of proliferating progenitor-like cell states. Further, N1IC transformed cells exhibited increased mitochondrial lipid peroxidation, high ROS production and depletion of reduced glutathione. This altered mitochondrial phenotype rendered the astrocyte-like, quiescent populations more sensitive to pharmacologic or genetic inhibition of the lipid hydroperoxidase GPX4 and induction of ferroptosis. Treatment of patient-derived early-passage cell lines and glioma slice cultures generated from surgical samples with a GPX4 inhibitor induced selective depletion of quiescent astrocyte-like glioma cell populations with similar metabolic profiles. Collectively, these findings reveal a specific therapeutic vulnerability to ferroptosis linked to mitochondrial redox imbalance in a subpopulation of quiescent astrocyte-like glioma cells resistant to standard forms of treatment.

Keywords: Astrocytic; Ferroptosis; Glioma; Mitochondrial-metabolism; Quiescent.


Figures

Figure 1
Figure 1. Notch-driven murine glioma model of a quiescent astrocyte-like tumor cell state.
(A) Schematic depicting genetically engineered murine glioma models with or without Notch activation. HA tagged PDGF-B IRES Cre retrovirus was injected in the corpus callosum of p53fl/fl or p53fl/fl N1ICSTOP-fl mice at 6 weeks. (B) Survival curve for the two glioma models. Survival was significantly longer in p53−/− N1IC mice compared to p53−/− only mice, p calculated by Mantel–Cox Log-rank test. Note the significant variability in survival for N1IC mice (29–151 days survival). (C) Serial IVIS imaging demonstrating increased latency in signal detection and tumor formation in N1IC tumors compared to p53 tumors with subsequent sharp increase in bioluminescence and aggressive tumor growth. Inset demonstrates representative IVIS images for one mouse from each model. Also refer to Appendix Fig. S1. (D) Representative immunofluorescence images of Ki67 (red) and HA (gray) in N1IC and p53 endstage tumors. Quantification of Ki67+ cells and Ki67/HA double + cells demonstrating a decreased proliferative transformed population in N1IC tumors as well as an increased recruited proliferative population in p53 tumors. Bar graph shows mean proportions ± SEM. P-values calculated by Welch’s t test, data pooled from n = 6 p53/n = 4 N1IC animals. Scale bar, 50 μm. (E) Heatmap showing the expression of selected glioma cell state markers, proliferation genes as well as Notch canonical downstream targets in the p53 and N1IC transformed populations, as derived from scRNA-seq of the retrovirus induced tumors (n = 2 from each model). Also refer to Appendix Fig. S1. (F) Representative immunofluorescence of Clu (green) and HA (gray) demonstrating double positive transformed astrocytic tumor cells only in the N1IC model (arrows) with presence of Clu+/HA- non-transformed tumor-associated astrocytes in both models (arrow heads). Scale bar, 10 μm. (G) Violin plots of AUCell scores of the AC-like cell state and quiescence gene signatures, as derived from single cell RNAseq, in tumor cells from the two models (n = 2 mice per genotype). P-value calculated by Welch’s t test. Source data are available online for this figure.
Figure 2
Figure 2. Multi-omic analysis reveals differences in metabolic programs between N1IC and p53 models.
(A) Schematic diagram depicting workflow for multi-omic analysis including gene ontology for transcriptional metabolic programs using scRNA-seq and metabolomic analysis using LC-MS in murine tumors as well as functional studies, metabolic and lipidomic LC-MS analysis of primary cell cultures isolated from the two models. Also refer to Appendix Fig. S2 for further characterization of isolated cell lines. (B) Bar graph depicting significant metabolic gene ontologies in the two models via GSEA. NES – normalized enrichment score. Full list of transcriptional metabolic programs provided in Dataset EV2. (C) PLS-DA analysis based on LC-MS metabolomic/lipidomic studies performed on p53 and N1IC endstage tumors demonstrating separation of models based on metabolic features. Shaded area represents 95% CI. Full list of analyzed metabolites provided in Dataset EV3. n = 3 independent tumors per model. (D) Bar graphs depicting mean ± SEM relative abundance of select metabolites in the two murine models. P-values calculated via unpaired one-tailed t-test. n = 3 independent tumors per model. (E) PLS-DA analysis of LC-MS untargeted metabolomics performed on p53 and N1IC primary cell cultures demonstrating separation of models based on metabolic profile. Shaded area represents 95% CI. n = 4 replicates per model. Full list of analyzed metabolites provided in Dataset EV3. (F) Bar graph demonstrating log2FC of significant differentially enriched metabolites in N1IC and p53 cells. P-values provided in Dataset EV3. Also refer to Appendix Fig. S3 for in depth description of N1IC metabolic pathways based on integrated transcriptomic and metabolomic data. (G) Heatmap of differentially enriched lipid species in p53 and N1IC cell cultures in both the positive and negative mode. Scale bar represents Z-scored average concentration of distinct lipid species normalized by protein concentration. FDR-corrected P-values (Welch’s t-test) and lipid ontology analysis provided in Dataset EV4 and Appendix Fig. S3. (H) Ridge plot depicting flow cytometry of BODIPY-C11 fluorescence demonstrating higher lipid peroxidation in N1IC vs. p53 primary cell culture at baseline. Right: Quantification of lipid peroxidation in p53 and N1IC cell lines. P-value calculated by Welch’s t-test. Data pooled from n = 6 independent experiments.
Figure 3
Figure 3. Altered complex I activity leads to increased ROS and mitochondrial lipid peroxidation in the N1IC AC-like model.
(A) Heatmap showing differentially expressed genes involved in complex I activity or redox metabolism identified by scRNA-seq in the p53 and N1IC transformed cell populations. n = 2 samples for each model. (B) Bar graph depicting mean ratio ± SEM of reductive substrates based on LC-MS analysis of tumor tissue from the p53 and N1IC murine models. n = 3 samples for each model. P-values calculated by unpaired one-tailed t-test. Also refer to Dataset EV3. (C) Bar graph depicting mean ± SEM H2DCFDA and MitoCLOX ratio demonstrating increased ROS and mitochondrial lipid peroxidation in N1IC primary cultures compared to p53. Data pooled from n = 5 (H2DCFDA) and n = 3 (MitoCLOX) independent experiments. P-values calculated by unpaired two-tailed t-test. (D) Bar graphs depicting mean GSH relative abundance and GSH/GSSG ratio ± SEM in the murine tumors and primary cell cultures from p53 and N1IC models. P-values calculated by unpaired one-tailed t-test. n = 3 independent tumor samples for each model (murine model, left) and n = 3 independent measurements in a pair of cell lines (cell line, right). (E) Bar graph of MitoGREEN median gate ± SEM demonstrating difference in mitochondrial numbers in p53 and N1IC primary cell cultures. P-values calculated by unpaired two-tailed t-test. Data pooled from n = 5 independent experiments. (F) Bar graph depicting mean ± SEM JC-1 ratio demonstrating decreased mitochondrial membrane potential in N1IC compared to p53 primary cell cultures. Data pooled from n = 5 independent experiments. P-values calculated by unpaired two-tailed t-test. Also refer to Appendix Fig. S4. (G) Seahorse OCR analysis of two different p53 and N1IC primary cell cultures demonstrating higher energetic metabolism in p53 tumor cells compared to N1IC tumor cells. Each point represents mean, error bars represent SEM of minimum n = 3 replicates. Also refer to Appendix Fig. S4. (H) Bar graph depicting mean ATP/ADP ratio ± SEM in murine tumors and primary cell cultures demonstrating no difference in energetic balance between the p53 and N1IC models. n = 3 (tumors) or n = 4 (cell culture) independent samples for each model. P-values calculated by unpaired two-tailed t-test. (I) Schematic depiction of C13 palmitate flux analysis to measure fatty acid oxidation (FAO) in primary cell cultures. Boxed metabolites were measured and are depicted in Panel (J). (J) Quantification of TCA cycle metabolites incorporating C13 from FAO of tagged palmitic acid demonstrates increased uptake in the p53 primary cell cultures. Stacked bar graphs depict mean ± SEM from n = 3 independent measurements. Source data are available online for this figure.
Figure 4
Figure 4. Differential sensitivity to Gpx4 inhibition and ferroptosis of the quiescent AC-like cell state.
(A) RSL3 drug screen on n = 3 p53 and N1IC independent primary cell cultures, error bars represent SEM from n = 3 replicates. Inset: Bar graph depicting mean area under the curve (AUC) ± SEM for panel a, comparison by Welch’s t test. (B) AUC from RSL3 dose–response curves with and without 2 μM Ferrostatin-1 in n = 3 p53 cell lines and n = 2 N1IC cell lines. P-values calculated via paired t-test. Also refer to Appendix Fig. S5. (C) PCR ΔΔCT ± SEM values of canonical ferroptosis markers in p53 and N1IC primary cell cultures treated with 500 nM RSL3 or DMSO control for 2 h. Data pooled from n = 3 independent experiments. Normalized to actin, p53 DMSO used as reference. Displayed Q-values calculated by ANOVA with FDR correction via Benjamini, Krieger, and Yekutieli. (D) Bar graph depicting mean cell numbers ± SEM assessed in primary cell cultures from the two models undergoing transfection with control or GPX4 siRNA for 48 h demonstrating increased cell death in the N1IC model and partial rescue with Ferrostatin-1. n = 5 fields per condition. Displayed P-values calculated by one-way Brown-Forsythe and Welch ANOVA tests. Also refer to Appendix Fig. S5. (E) Experimental setup schematic representation of murine organotypic slice cultures. 3 slices per condition were generated from 3 different tumor-bearing mice. Mice were sacrificed at 30 dpi. Treatment with 500 nM RSL3 or DMSO vehicle for 6 h. (F) Double immunofluorescence of proliferation marker Top2a and ferroptosis marker transferrin receptor (TfR) demonstrating lack of TfR staining in vehicle treated slices and upregulation of TfR after 500 nM RSL3 in Top2a negative non-proliferating cells. Red arrows mark Top2a+ cells, white arrows mark TfR+ cells. Scale bar, 50 μm. (G) RNAScope of Ptprz1 (tumor marker—magenta) and Clu (astrocytic marker—red) after 500 nM RSL3 or DMSO vehicle demonstrating depletion of the Clu+ transformed cell population. Scale bar, 50 μm, insets 40 × 40 μm. (H) Quantification of weighted integrated density on n = 3 independent slice cultures. Bar graph depicting mean with individual paired values. P-value via paired t-test. Source data are available online for this figure.
Figure 5
Figure 5. Mechanistic link between complex I-driven mitochondrial lipid peroxidation and sensitivity to Gpx4-dependent ferroptosis in the AC-like cell state.
(A) Schematic depiction of electron flow (forward – FET, reverse – RET) in the electron transport chain, sites of ROS production in the ETC and pharmacologic inhibitors used to modulate the ETC in conjunction with GPX4 inhibition. Mitoquinone and SKQ1 are mitochondrial specific ROS scavengers. PK11195 is a TSPO inhibitor (TSPOi) and modulates mPTP opening to control ROS production. Schematic generated with BioRender. (B) Bar graph depicting mean ± SEM MitoCLOX with or without RSL3 treatment (500 nM, 30 min) demonstrating increased mitochondrial lipid peroxidation after GPX4 inhibition. Data pooled from n = 4 independent experiments. P calculated via unpaired two-tailed t-test. (C) Bar graphs depicting mean ± SEM for BODIPY-C11, H2DCFDA/ROS and MitoCLOX levels with or without inhibition of complex I via IACS-010759 demonstrating decreased total/mitochondrial lipid peroxidation and total ROS production. Data pooled from n = 4 independent experiments. P-values calculated via unpaired two-tailed t-test. (D) Bar graphs depicting mean cell viability ± SEM after treatment with 20 nM RSL3 alone (red) or RSL3 + IACS-010759 (dark green) in two different N1IC cell lines demonstrating decreased response to ferroptosis after complex I inhibition. n = 3 biological replicates. Displayed Q-values calculated by ANOVA with FDR correction via Benjamini, Krieger, and Yekutieli. (E) Bar graphs depicting mean ± SEM for BODIPY-C11, H2DCFDA/ROS and mitoCLOX levels with or without uncoupling of oxidative phosphorylation via FCCP demonstrating no effects on total/mitochondrial lipid peroxidation or total ROS production. Data pooled from n = 4 independent experiments. P-values calculated via unpaired two-tailed t-test. (F) Bar graphs depicting mean cell viability ± SEM after treatment with 20 nM RSL3 alone (red) or RSL3 + FCCP (light blue) in two different N1IC cell lines demonstrating increased cell death after GPX4 inhibition and uncoupling. n = 3 biological replicates. Displayed Q-values calculated by ANOVA with FDR correction via Benjamini, Krieger, and Yekutieli. (G) Bar graphs depicting mean cell viability ± SEM after treatment with DMSO followed by 20 nM RSL3 (red), 0.5 μM Oligomycin followed by 20 nM RSL3 (yellow) or 5 μM Antimycin followed by 20 nM RSL3 (green) demonstrating no effects of ATP synthase or complex III inhibition on response to ferroptosis. n = 4 biological replicates. Data normalized to DMSO, Oligomycin or Antimycin alone, respectively. Q-values calculated by ANOVA with FDR correction via Benjamini, Krieger, and Yekutieli. (H) Bar graphs depicting mean ± SEM for BODIPY-C11 and MitoCLOX levels with or without TSPO inhibition with 1 and 10 μM PK11195 (TSPOi) demonstrating dose-dependent decrease in mitochondrial but not in cellular lipid peroxidation. Data pooled from n = 5 independent experiments. Displayed Q-values calculated by ANOVA with FDR correction via Benjamini, Krieger, and Yekutieli. Also refer to Appendix Fig. S7. (I) Bar graphs depicting mean cell viability ± SEM after treatment with DMSO followed by RSL3 (red), 1 μM or 10 μM PK11195 followed by RSL3 (turquoise) demonstrating dose-dependent rescue of ferroptosis with TSPO inhibition. n = 3 biological replicates. Displayed Q-values calculated by ANOVA with FDR correction via Benjamini, Krieger, and Yekutieli. (J) Dose–response curves in N1IC cells treated with DMSO followed by RSL3 (red), 10 μM PK11195 followed by RSL3 (turquoise) and RSL3 combined with 10 μΜ PK11195 (purple) demonstrating rescue of cell death with sequential TSPO inhibition only. Error bars represent SEM from n = 3 replicates. (K) Bar graphs depicting mean ± SEM for BODIPY-C11 and H2DCFDA levels with or without MitoQ treatment demonstrating decreased lipid peroxidation and total ROS production with mitochondrial specific ROS scavengers. Data pooled from n = 5 independent experiments. P-values calculated via unpaired two-tailed t-test. (L) Bar graphs depicting mean cell viability ± SEM after treatment with RSL3 alone (red), RSL3 with 0.25 μΜ MitoQ and RSL3 with 0.1 μM SKQ1 (green) demonstrating rescue of ferroptosis with two different mitochondrial ROS scavengers. n = 3 biological replicates. Displayed Q-values calculated by ANOVA with FDR correction via Benjamini, Krieger, and Yekutieli. (M) Dose–response curves in N1IC cells treated with apoptosis inducer STS alone (black), STS combined with 0.05 μM SKQ1 and STS combined with 0.1 μM SKQ1(green) demonstrating no effect on apoptosis driven cell death with mitochondrial ROS scavengers. Error bars represent SEM from n = 3 replicates. Source data are available online for this figure.
Figure 6
Figure 6. GPX4 inhibition targets an AC-like subpopulation in an early passage patient derived cell line.
(A) The phenotypic cell states of TS543 culture change over time. The cell state of each cell from scRNA-seq data of 3 different TS543 culture passages was determined using gene signatures described in Neftel et al (2019). Number of cells at each cell state were counted and used to calculate the cell fraction at each culture passage. (B) Normalized enrichment scores (NES) for glioma cell state-specific gene signatures comparing the vehicle-treated and RSL3-treated TS543 glioma neurospheres treated for one (orange) or three (green) days showing consistent depletion of the astrocyte-like cell state. (C) Same as (B). but for the mouse “N1IC_up” astrocyte-like gene signature showing consistent depletion for both treatment times. (D) Heatmap showing differential expression fold-changes comparing vehicle- and RSL3-treated TS543 neurospheres at one and three days for markers of the astrocyte-like signature. (E) Same as (A). but for mitochondrial metabolic gene signatures showing consistent depletion for both treatment times and significant depletion of ETC, oxidative phosphorylation, and aerobic respiration at day 3. For all panels, * indicates FDR < 0.05. Source data are available online for this figure.
Figure 7
Figure 7. RSL3 targets quiescent AC-like transformed cell populations in acute slice cultures from human glioma.
(AF) UMAP embedding of scRNA-seq data from vehicle- and RSL3-treated slice cultures from six gliomas, including five primary GBMs and one primary IDH1 mutant adult-type diffuse glioma. Panel (A) shows the cells annotated by treatment; control (Blue), RSL3 (Red). Panel (B) shows the cells annotated by tumor. Panel (C) shows cells annotated as non-tumor (green) or tumor (orange). Panel (D) shows cells annotated by IDHmt (purple) or IDHwt (green). Panels (E) and (F) show cells annotated by chromosomal copy number alterations. Also refer to Appendix Fig. S11. (G) Normalized enrichment scores (NES) for glioma cell state-specific gene signatures comparing the vehicle treated vs. RSL3 treated slices for all 6 cases. (H) NES for the astrocyte-like gene signature, comparing RSL3 treated vs. RSL3+Ferrostatin-1 treated slices for 3 of the 6 cases. (I) Heatmap of the fold-change for each gene in the astrocyte-like gene signature across all six patients comparing the vehicle and RSL3 treated slices. (J) GSEA of mitochondrial metabolic signatures comparing the transformed glioma cells in the vehicle and RSL3 treated slices. (K) Normalized enrichment scores for the “N1IC_up” gene signature derived from the murine model comparing the vehicle treated vs. RSL3 treated slices for all 6 cases. Right panel depicts the same gene signature comparing RSL3 treated vs. RSL3+Ferrostatin-1 treated slices for 3 of the 6 cases. Panels (G), (H), (J), (K): Significant (FDR-corrected p < 0.05) NES marked with asterisk (*). Source data are available online for this figure.

Update of

References

    1. Aibar S, Gonzalez-Blas CB, Moerman T, Huynh-Thu VA, Imrichova H, Hulselmans G, Rambow F, Marine JC, Geurts P, Aerts J et al (2017) SCENIC: single-cell regulatory network inference and clustering. Nat Methods 14:1083–1086 - PMC - PubMed
    1. Al-Dalahmah O, Argenziano MG, Kannan A, Mahajan A, Furnari J, Paryani F, Boyett D, Save A, Humala N, Khan F et al (2023) Re-convolving the compositional landscape of primary and recurrent glioblastoma reveals prognostic and targetable tissue states. Nat Commun 14:2586 - PMC - PubMed
    1. Artegiani B, Lyubimova A, Muraro M, van Es JH, van Oudenaarden A, Clevers H (2017) A single-cell RNA sequencing study reveals cellular and molecular dynamics of the hippocampal neurogenic niche. Cell Rep 21:3271–3284 - PubMed
    1. Barthel FP, Johnson KC, Varn FS, Moskalik AD, Tanner G, Kocakavuk E, Anderson KJ, Abiola O, Aldape K, Alfaro KD et al (2019) Longitudinal molecular trajectories of diffuse glioma in adults. Nature 576:112–120 - PMC - PubMed
    1. Benner EJ, Luciano D, Jo R, Abdi K, Paez-Gonzalez P, Sheng H, Warner DS, Liu C, Eroglu C, Kuo CT (2013) Protective astrogenesis from the SVZ niche after injury is controlled by Notch modulator Thbs4. Nature 497:369–373 - PMC - PubMed

MeSH terms

Substances

LinkOut - more resources