. 2024 Oct;43(20):4699-4719.
doi: 10.1038/s44318-024-00211-4. Epub 2024 Aug 27.

STIC2 selectively binds ribosome-nascent chain complexes in the cotranslational sorting of Arabidopsis thylakoid proteins

Affiliations

STIC2 selectively binds ribosome-nascent chain complexes in the cotranslational sorting of Arabidopsis thylakoid proteins

Dominique S Stolle et al. EMBO J. 2024 Oct.

Abstract

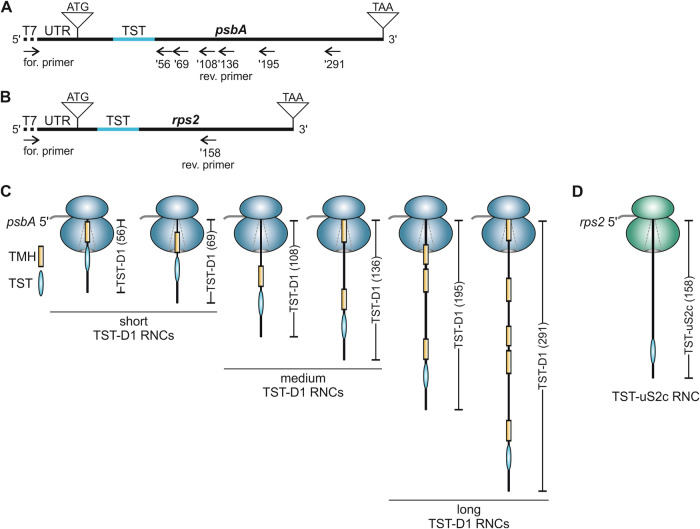
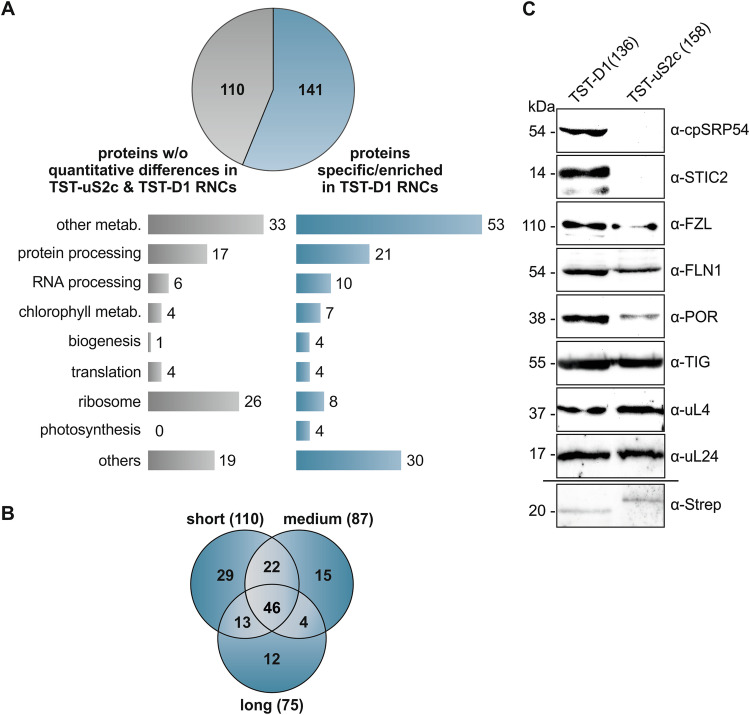
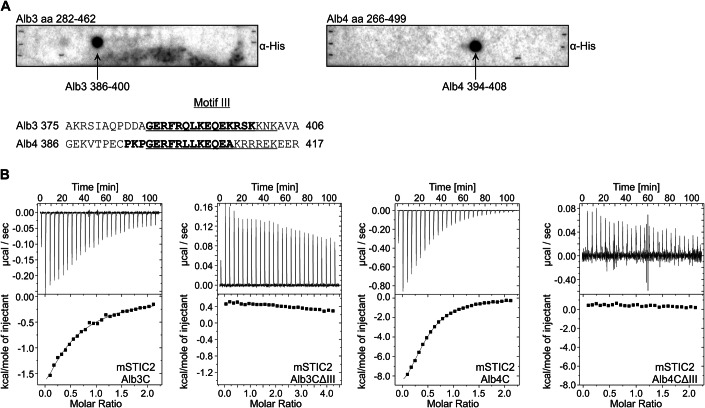
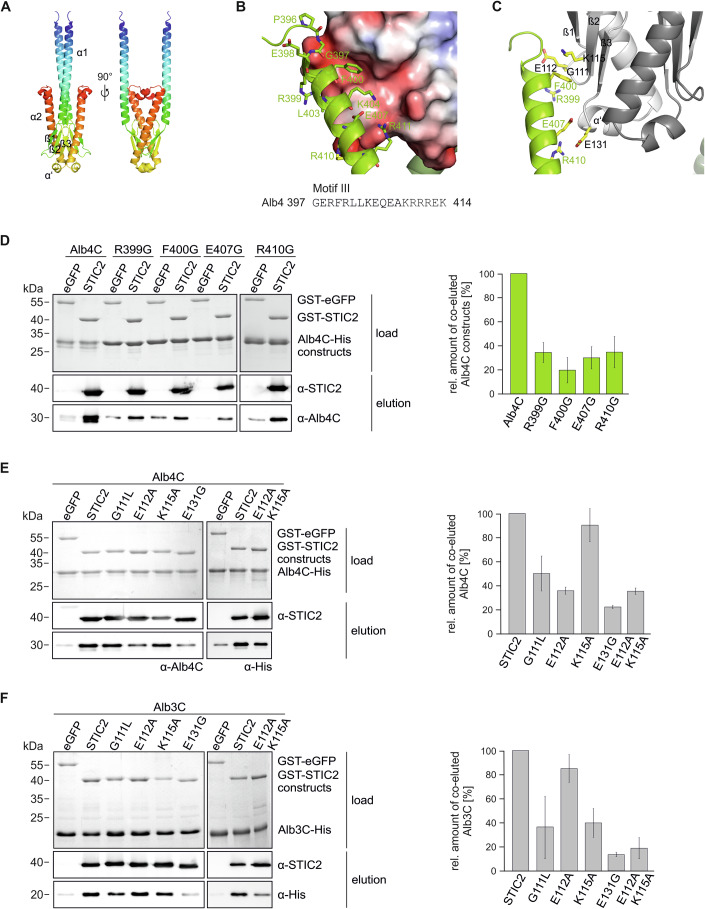
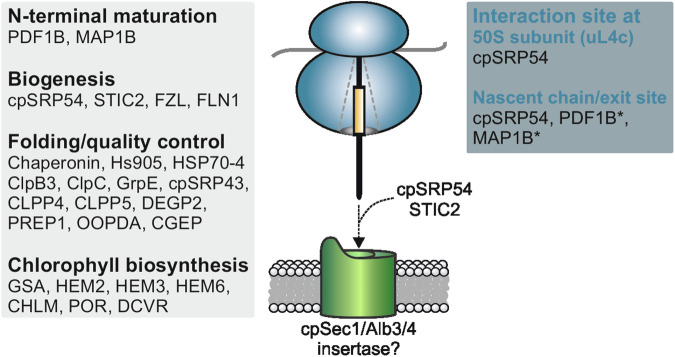
Chloroplast-encoded multi-span thylakoid membrane proteins are crucial for photosynthetic complexes, yet the coordination of their biogenesis remains poorly understood. To identify factors that specifically support the cotranslational biogenesis of the reaction center protein D1 of photosystem (PS) II, we generated and affinity-purified stalled ribosome-nascent chain complexes (RNCs) bearing D1 nascent chains. Stalled RNCs translating the soluble ribosomal subunit uS2c were used for comparison. Quantitative tandem-mass spectrometry of the purified RNCs identified around 140 proteins specifically associated with D1 RNCs, mainly involved in protein and cofactor biogenesis, including chlorophyll biosynthesis, and other metabolic pathways. Functional analysis of STIC2, a newly identified D1 RNC interactor, revealed its cooperation with chloroplast protein SRP54 in the de novo biogenesis and repair of D1, and potentially other cotranslationally-targeted reaction center subunits of PSII and PSI. The primary binding interface between STIC2 and the thylakoid insertase Alb3 and its homolog Alb4 was mapped to STIC2's β-sheet region, and the conserved Motif III in the C-terminal regions of Alb3/4.

Keywords: Arabidopsis; Cotranslational Targeting; Photosystem II; STIC2; Thylakoid Membrane.


Conflict of interest statement

The authors declare no competing interests.

Figures

Figure 1
Figure 1. Generation of stalled affinity-tagged ribosome-nascent chain complexes (RNCs).
(A) Schematic representation of the psbA cDNA with T7 promotor sequence (dotted line) at the 5’ end and the endogenous psbA 5’ UTR (87 nt) used for PCR production of truncated templates for in vitro transcription into mRNA. A 90 nt Twin-Strep-tag (TST) coding sequence (blue line) was inserted at position +76 of the psbA sequence. The reverse primers (’56, ’69, ’108, ’136, ’195, and ‘291) lacking a stop codon, determine the length of the PCR product and are named according to the number of D1 amino acids encoded by the corresponding mRNA. (B) Scheme of the rps2 cDNA used for PCR production of a truncated template for in vitro transcription into mRNA (description as in (A)). The endogenous 5’ UTR comprises 90 nt. The TST coding sequence was inserted at position +52. The reverse primer (’158) lacks a stop codon and was used for PCR amplification of a product that corresponds to 158 amino acids of the uS2c protein. (C, D) Schematic RNCs generated by in vitro translation of mRNA from truncated templates as shown in (A) and (B). An internal TST is used for the affinity purification of the complexes. The nascent peptides of the D1 protein comprise at least one transmembrane helix (TMH) that is buried in the ribosome peptide tunnel or is exposed to the surrounding environment depending on the nascent peptide length. The nascent peptide of the soluble uS2c protein lacks any hydrophobic TMH.
Figure 2
Figure 2. Identification of proteins associated with affinity-purified stalled D1 RNCs.
(A) Label-free quantitative tandem mass spectrometry identified 259 proteins in affinity-purified, stalled RNC complexes translating TST-uS2c (158) and TST-D1 of different lengths (TST-D1 (56), (69), (108), (136) (195), and (291)). Of these proteins, 141 were significantly enriched or exclusively present in TST-D1 RNCs, while 110 proteins showed no significant quantitative differences between the uS2c and D1 samples. Identified proteins were functionally categorized as indicated. The stalled RNCs were generated using the chloroplast-derived in vitro translation system and affinity-purified with MagStrep XT magnetic beads. (B) The set of 141 TST-D1 RNCs-associated proteins were visualized in a Venn diagram showing their distribution among the RNCs with short, medium, and long nascent TST-D1 peptides (as classified in Fig. 1) or overlaps of these groups. (C) Stalled RNCs of TST-D1 (136) and TST-uS2c (158) were generated using the chloroplast-derived in vitro translation system and purification was performed with StrepTrap XT columns. The purified complexes were subjected to immunoblot analysis using the indicated antibodies. The detection of the tagged D1 nascent chain using the α-Strep antibody was performed with the TST-D1 (195) variant because of a nonspecific signal of the α-Strep antibody at the size of TST-D1 (136). Source data are available online for this figure.
Figure 3
Figure 3. The combined loss of STIC2 and cpSRP54 causes high light sensitivity and low accumulation of D1.
(A) Left: 9-week-old plants of wild type (WT), stic2-3 (stic2), ffc1-2 (ffc) and ffc1-2 stic2-3 (ffc stic2) grown at 50 µmol photons m−2 s−1 with a 12 h photoperiod were shifted to high light (500 µmol photons m−2 s−1). The maximum quantum yield of PSII (Fv/Fm) was determined before the shift (0 h) and 2 and 4 h after the shift. Signal intensities for Fv/Fm are indicated by the false color scale at the bottom of the figure. Right: Overview of experimental setup indicating the time points for Fv/Fm measurements (0, 2, and 4 h) relative to the photoperiod and the light intensity (dotted line) (top). The maximum quantum yield of PSII (Fv/Fm) from young (middle) and mature (bottom) leaves of plants shown in the left panel. Averages and standard deviation are shown (n = 4–10). Statistically significant differences of the means (p < 0.05) between genotypes for the individual time point indicated by letters were determined by the Games-Howell multiple comparison test. (B) Total protein extracts from 5-week-old wild type (WT), stic2-3, ffc1-2 and three lines of ffc1-2 stic2-3 ((1), (2), (3)) were separated by SDS-PAGE and blotted for immunodetection with the indicated antibodies. The Actin level was monitored as loading control. The WT samples corresponded to 25, 50, and 100% of total protein. The protein levels were quantified using ImageJ in relation to WT (100%). Means and SDs were calculated from at least three independent biological replicates. (C) Leaf discs of wild type (WT) and the indicated A. thaliana mutants were incubated in a [35S]-methionine containing solution in presence of cycloheximide at ambient light. After an incubation for 15, 30, 45, and 60 min thylakoid membrane proteins were extracted and used for SDS-PAGE and phosphor imaging. Signals were quantified (ImageJ) in relation to WT with WT corresponding to 100% for each time point. Means and SDs were calculated from at least three independent biological replicates. Source data are available online for this figure.
Figure 4
Figure 4. Analysis of cofractionation of STIC2 with stromal ribosomes and thylakoid membranes and the effect of the stic2 mutation on ribosomal footprints.
(A) The interaction of endogenous STIC2 and ribosomes was tested by sucrose density gradient centrifugation of leaf extracts of A. thaliana WT plants. The gradient fractions were separated by SDS-PAGE and applied to immunoblotting using the indicated antibodies. A representative experiment from two independent biological and two technical replicates is shown. (B) Isolated chloroplasts from A. thaliana WT were lysed and separated into stromal and thylakoid fractions by centrifugation. Samples equivalent to 5 µg chlorophyll of chloroplast extract (C), washed thylakoids (T), and stroma (S) were separated on SDS-PAGE and blotted for immunodetection using antisera raised against STIC2, Alb3 and the small subunit of Rubisco (SSU). The Alb3 insertase and SSU were used as controls for successful fractionation. A Coomassie blue stained SDS gel served as loading control. A representative experiment from two independent biological replicates is shown. (C) Ribosome footprint yield was determined for soluble (yellow) and membrane (green) fractions of WT, stic2-3, ffc1-2, and ffc1-2 stic2-3 and normalized to the amount of fresh weight used as starting material. Means and SDs are derived from two (ffc1-2) or three (WT, stic2-3, ffc1-2 stic2-3) independent biological replicates. Source data are available online for this figure.
Figure 5
Figure 5. The conserved C-terminal Motif III of Alb3 and Alb4 is the primary interaction site for STIC2.
(A) The interaction of His-STIC2 with the C-terminal regions of Alb3 (aa 282–462, left side) and Alb4 (aa 266–499, right side) was analyzed using pepspot-labeled nitrocellulose membranes. Recombinant His-STIC2 was incubated in a final concentration of 5 µg/ml with the pepspot membranes. Bound His-STIC2 was detected with antisera directed against the His-tag. Detected spots correspond to amino acids 386–400 of Alb3 and amino acids 394–408 of Alb4. These residues are indicated in bold in an alignment of a C-terminal region of Alb3 and Alb4 comprising the conserved Motif III (underlined). (B) Representative measurements of isothermal titration calorimetry (ITC) to determine binding affinities for the interaction of STIC2 with the C-terminal regions of Alb3 and Alb4. Left panels: 1.5 mM His-STIC2 was titrated into 0.15 mM of Alb3C-His or Alb3CΔIII-His. Right panels: 1 mM His-STIC2 was titrated into 0.1 mM Alb4C-His or Alb4CΔIII-His solutions. The resulting changes in heating power were recorded (top panels). After integration, the resulting enthalpy changes are plotted versus the molar ratio of STIC2 and the indicated binding partners (bottom panels). The titration isotherms resulted in a Kd of 150 ± 30 µM for the STIC2/Alb3C interaction and a Kd of 17 ± 4 µM for the STIC2/Alb4C interaction. No binding was detected for STIC2/Alb3CΔIII and STIC2/Alb4CΔIII. Data were calculated from two to five independent experiments. Source data are available online for this figure.
Figure 6
Figure 6. Characterization of the interaction interface between STIC2 and the C-terminal region of Alb4 and Alb3.
(A) Alphafold-Multimer Model of the STIC2 dimer. STIC2 is shown in two orientations in cartoon representation with rainbow coloring from blue to red. (B) Interaction of Alb4 Motif III with STIC2. Shown is the STIC2 electrostatic surface (Connolly surface colored with APBS potential from red to blue (−4 to +4 kJ/mol/e)) together with a cartoon representation of Alb4C in green. Residues of Alb4 within 4 Å of STIC2 are shown as sticks and labeled. (C) Interacting residues investigated in the study. Shown is STIC2 as gray cartoon model (monomer A, light gray, monomer B darker gray), Alb4C as green cartoon. Interacting residues characterized experimentally are shown as yellow sticks and labeled. (DF) Pull-down experiments using purified GST-STIC2 and Alb4C variants are shown in (D) or the indicated GST-STIC2 point mutation variants and Alb4C (E) or Alb3C (F). GST-eGFP was used as a control. Assays were conducted using glutathione sepharose beads. Load samples are shown by Coomassie stained SDS-Gels. Eluates were analyzed by SDS-PAGE and subsequent immunoblotting using the indicated antibodies. Coelution was quantified using ImageJ. Means and SDs were calculated from three independent experiments. Source data are available online for this figure.
Figure 7
Figure 7. Chloroplast ribosome interactors during D1 synthesis.
Summary of the interactors of D1 RNCs identified in this work, whose relation to D1 biosynthesis is discussed in the main text. The functional categories (gray box) and the interaction sites with RNCs (blue box) are indicated. The interaction of cpSRP54 with the ribosomal 50S subunit uL4c and nascent D1 peptides were described previously (Hristou et al, , Nilsson et al, , Nilsson and van Wijk, 2002). The ribosomal interaction sites of marked (*) factors of nascent chain maturation and chaperones are indicated according to the interaction sites for prokaryotic protein biosynthesis (see main text). The cooperative function of the two biogenesis factors, STIC2 and cpSRP54, is required for efficient D1 biogenesis. In this context, the interaction of STIC2 with the thylakoid membrane proteins, Alb3 and/or Alb4, might be important to ensure efficient coupling of translation and insertion of the nascent chain into the membrane by the insertase machinery, likely formed by a cpSec1/Alb3/4 complex.

References

    1. Ackermann B, Dünschede B, Pietzenuk B, Justesen BH, Krämer U, Hofmann E, Günther Pomorski T, Schünemann D (2021) Chloroplast ribosomes interact with the insertase Alb3 in the thylakoid membrane. Front Plant Sci 12:781857 - PMC - PubMed
    1. Adam Z, Frottin F, Espagne C, Meinnel T, Giglione C (2011) Interplay between N-terminal methionine excision and FtsH protease is essential for normal chloroplast development and function in Arabidopsis. Plant Cell 23:3745–3760 - PMC - PubMed
    1. Akopian D, Shen K, Zhang X, Shan SO (2013) Signal recognition particle: an essential protein-targeting machine. Annu Rev Biochem 82:693–721 - PMC - PubMed
    1. Amin P, Sy DA, Pilgrim ML, Parry DH, Nussaume L, Hoffman NE (1999) Arabidopsis mutants lacking the 43- and 54-kilodalton subunits of the chloroplast signal recognition particle have distinct phenotypes. Plant Physiol 121:61–70 - PMC - PubMed
    1. Bals T, Dünschede B, Funke S, Schünemann D (2010) Interplay between the cpSRP pathway components, the substrate LHCP and the translocase Alb3: an in vivo and in vitro study. FEBS Lett 584:4138–4144 - PubMed

MeSH terms

Substances

LinkOut - more resources