. 2024 Sep;56(9):1832-1840.
doi: 10.1038/s41588-024-01884-7. Epub 2024 Aug 27.

Genetic architecture of telomere length in 462,666 UK Biobank whole-genome sequences

Collaborators, Affiliations

Genetic architecture of telomere length in 462,666 UK Biobank whole-genome sequences

Oliver S Burren et al. Nat Genet. 2024 Sep.

Abstract

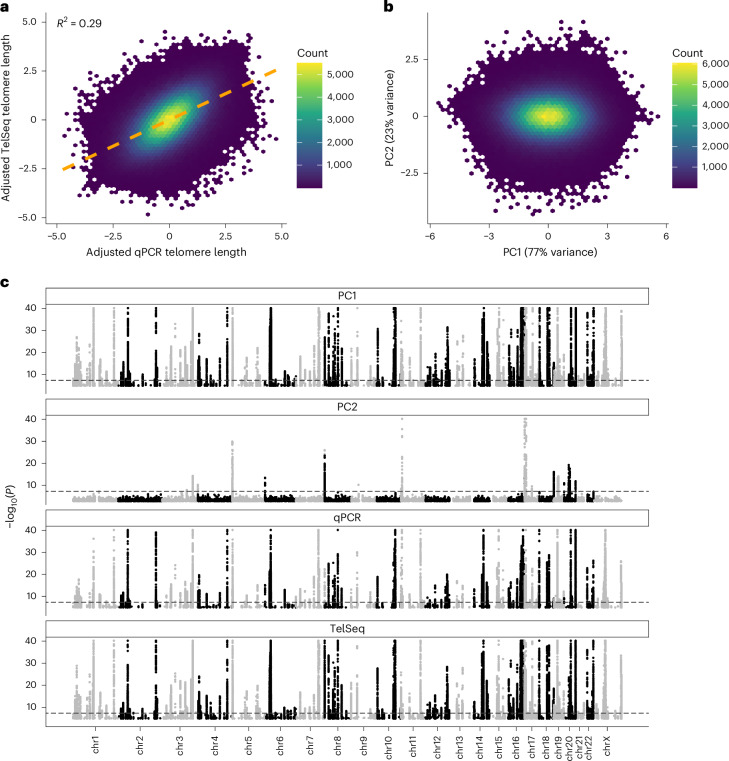
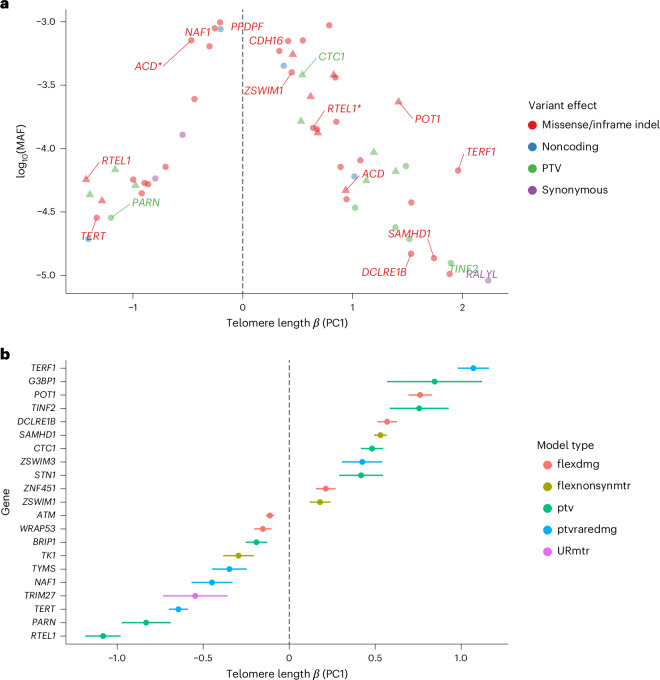
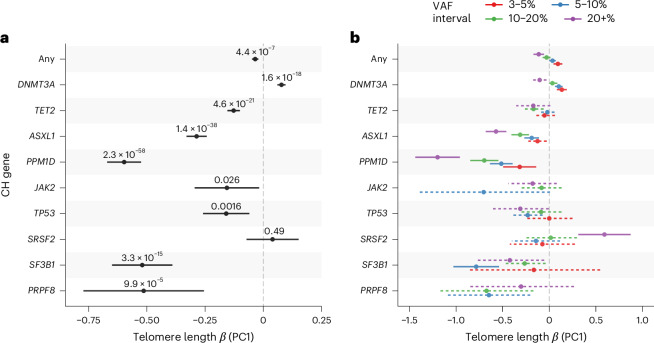
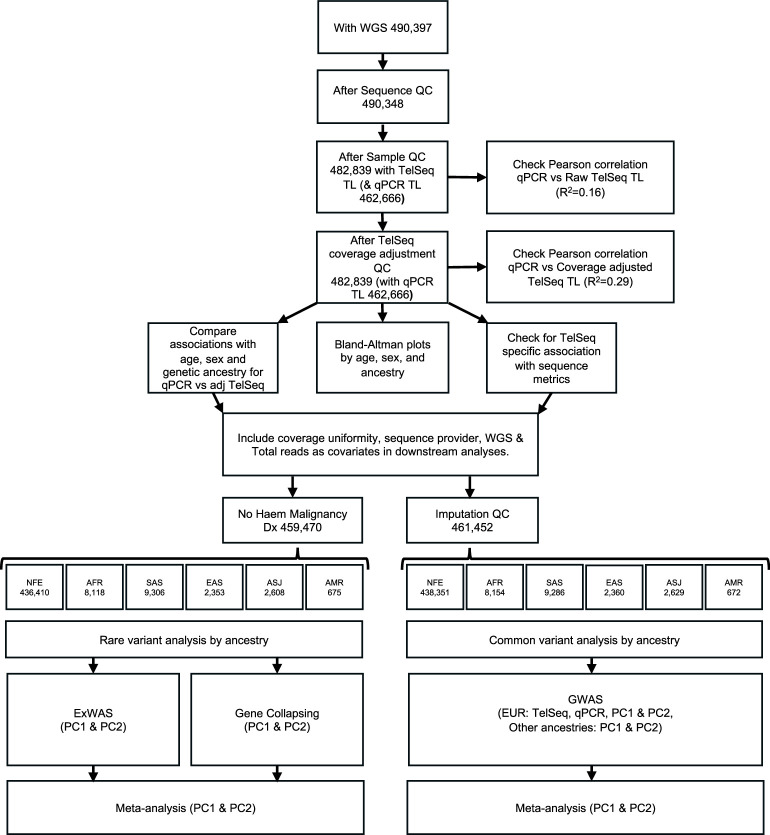
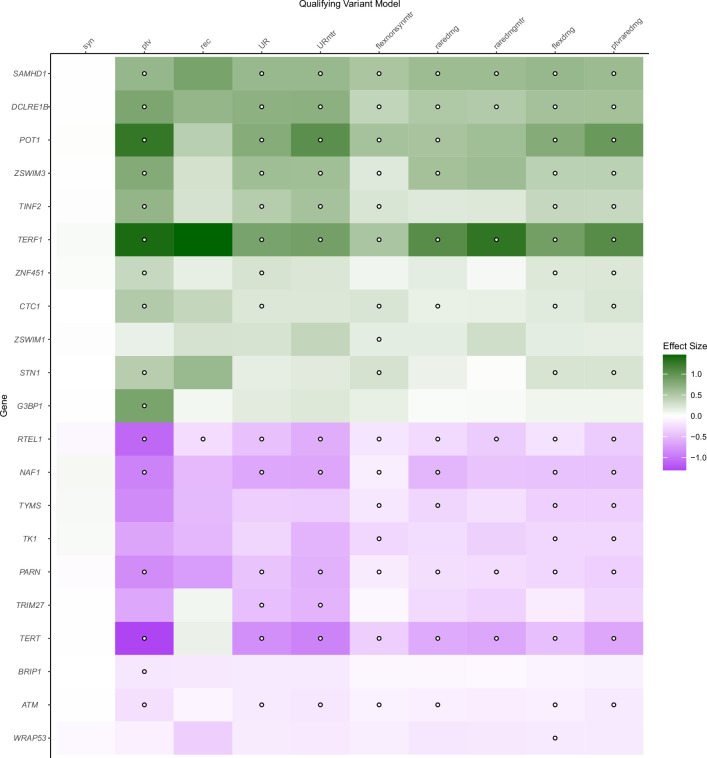
Telomeres protect chromosome ends from damage and their length is linked with human disease and aging. We developed a joint telomere length metric, combining quantitative PCR and whole-genome sequencing measurements from 462,666 UK Biobank participants. This metric increased SNP heritability, suggesting that it better captures genetic regulation of telomere length. Exome-wide rare-variant and gene-level collapsing association studies identified 64 variants and 30 genes significantly associated with telomere length, including allelic series in ACD and RTEL1. Notably, 16% of these genes are known drivers of clonal hematopoiesis-an age-related somatic mosaicism associated with myeloid cancers and several nonmalignant diseases. Somatic variant analyses revealed gene-specific associations with telomere length, including lengthened telomeres in individuals with large SRSF2-mutant clones, compared with shortened telomeres in individuals with clonal expansions driven by other genes. Collectively, our findings demonstrate the impact of rare variants on telomere length, with larger effects observed among genes also associated with clonal hematopoiesis.


Conflict of interest statement

O.S.B., R.S.D., S.V.V.D., S. Wen, A.N., J.M., F.H., D.S.L., K.R.S., N.R., H.O., A.P., P.V., Q. Wu, R.E.M., S. Wasilewski, K.C. M.F., Q. Wang, M.N.P. and S.P. are current employees and/or stockholders of AstraZeneca. All other authors declare no competing interests.

Figures

Fig. 1
Fig. 1. Combining telomere length metrics improves genetic discovery.
a, Correlation between inverse normal transformed qPCR and WGS TelSeq telomere length metrics. The orange dashed line indicates a linear model line of best fit. b, Biplot for PCA of qPCR and TelSeq telomere length metrics. c, Manhattan plot of common variant analysis of PC1, PC2, qPCR and TelSeq in the NFE broad genetic ancestry group. P values (two-sided, unadjusted) are derived from REGENIE analysis of 438,351 independent samples; the dotted line indicates P = 5 × 10−8 and for clarity y axes are truncated at P < 1 × 10−40.
Fig. 2
Fig. 2. Rare-variant analysis of telomere length.
a, ExWAS analysis of PC1 telomere length in the NFE broad genetic ancestry group, showing only rare germline variants that are significant (P ≤ 1 × 10−8) for PC1 and not PC2. For clarity the variant with the largest effect for a gene is labeled, variants with opposing effect size in the same gene are starred and triangles indicate HGMD pathogenic variants. P values (two-sided, unadjusted) were calculated from fitting a linear regression model. Color represents the functional effect of the variant on protein. b, Collapsing analysis of PC1, showing the most significant (P ≤ 1 × 10−8) association for a gene over all qualifying variant models (Supplementary Table 9). Associations driven by putative somatic variants are excluded. Colors represent the qualifying variant model used in collapsing analysis. Error bars represent 95% CIs. For both plots N = 436,410 independent samples.
Fig. 3
Fig. 3. Associations between telomere length and CH.
a, Collapsing analysis of somatic variants in select CH genes with telomere length PC1 metric. b, Collapsing analysis of somatic variants in CH genes stratified by VAF intervals (colors). Associations not reaching significance are shown with dashed error bars. In both plots, ‘Any’ indicates an overall analysis of the selected CH genes and estimates and 95% CIs (error bars) and P values (two-sided, unadjusted) are derived from fitting a linear model across 388,111 independent samples of broad NFE genetic ancestry.
Extended Data Fig. 1
Extended Data Fig. 1. Flowchart of sample QC and analyses.
Abbreviations; WGS = Whole genome sequencing, Dx = Diagnosis, Broad genetic ancestry groupings - AFR = African, AMR = Admixed American/Hispanic ASJ = Ashkenazi Jewish, EAS = East Asian, NFE = Non-Finnish European, SAS = South Asian.
Extended Data Fig. 2
Extended Data Fig. 2. Age, ancestry, and sex relationships with TelSeq & qPCR telomere length measurements.
For each panel y-axes denote telomere length residuals after regressing out age, sex, or ancestry depending on the x-axis variable. In all panels N for qPCR and TelSeq + Coverage is 462,666 and 482,839 independent UKB participants respectively. For each boxplot the centre is the median, the lower and upper hinges indicate the 25th and 75th percentile and outliers are represented as individual points. (A) Boxplot of age by telomere length residuals. (B) Boxplot for broad genetic ancestry group (AFR = African, AMR = Admixed American/Hispanic ASJ = Ashkenazi Jewish, EAS = East Asian, NFE = Non-Finnish European, SAS = South Asian) by telomere length residuals. (C) Boxplot for sex by telomere length residuals.
Extended Data Fig. 3
Extended Data Fig. 3. Association of whole genome sequencing technical variables with qPCR and coverage adjusted TL metrics.
(A) Forest plot of Bonferroni significant associations (P < 1 x 10⁻³) from a univariate linear regression of technical variables (two-sided) with either qPCR (coral) or inverse rank normal transformed TelSeq coverage adjusted (azure) telomere lengths (n = 462,666 independent samples). All variables have been standardised to facilitate effect size comparison on telomere length (x-axis), 95% confidence intervals are shown. A full table of all results with descriptions is available as Supplementary Table 3. Sequencing pipeline (deCODE, WSI, and WSI_vanguard (baseline)) and sex are treated as categorical variables. (B) Pearson correlation heatmap of significantly associated WGS technical variables. Variable order is derived from hierarchical (complete linkage) clustering of the full correlation matrix. Age and sex are included as biological variables with known associations with telomere length for comparison.
Extended Data Fig. 4
Extended Data Fig. 4. Comparison of PC1 and PC2 rotations.
Density plots of mean qPCR and TelSeq transformed telomere length estimates vs PC1 rotation values (A), mean qPCR and TelSeq transformed telomere length estimates vs PC2 rotation values (B), difference between qPCR and TelSeq transformed telomere length estimates vs PC1 rotation values (C), and difference between qPCR and TelSeq transformed telomere length estimates vs PC2 rotation values (D). Dotted lines indicate x = y (Top) and x = -y (Bottom) and are included for reference.
Extended Data Fig. 5
Extended Data Fig. 5. Comparison of GWAS effect sizes with Codd et al.
(y-axis) for different TL measurements effect sizes with EUR only effect sizes from Codd et al. (x-axis) and NFE from this study (P < 5 ×10⁻⁸). P values are derived from linear regression and are two sided and unadjusted. Crosses indicate 95% confidence intervals for each estimated effect size; Pearson’s correlation coefficients are labelled on each panel; blue dotted line shows equivalence (x = y).
Extended Data Fig. 6
Extended Data Fig. 6. Heatmap of genome-wide significant telomere length associated genes from gene collapsing analyses.
Shading indicates effect size (green = unit increased telomere length, purple = unit decreased telomere length), points indicate genome-wide significance (P ≤ 1x10⁻⁸). The x-axis indicates the different qualifying variant models implemented which are described fully in Wang et al. Briefly, ptv= rare protein truncating variants, UR = ultra rare variants, URmtr = ultra rare variants in missense intolerant regions (MTR), raredmg = rare damaging (REVEL) variants, raredmgmtr = as raredmg but with additional MTR filter, flexdmg = flexible non-synonymous, flexnonsynmtr = as flexdmg but with additional MRT filter, ptvraredmg = Union of ptv and raredmg models, rec = recessive model, syn = synonymous variants (negative control). P values are derived from linear regression and are two sided and unadjusted.
Extended Data Fig. 7
Extended Data Fig. 7. Comparison of p values for NFE and fixed effect cross-ancestry meta-analysis collapsing analysis (AFR (n = 8,154), ASJ (n = 2,629), EAS (n = 2,360), NFE (438,351) & SAS (9,286)) for the PC1 telomere length metric.
Only variants pNFE < 5 x 10⁻⁵ for PC1 are shown, (A) significance -log10(P) (B) Telomere length effect size (SD). P-values were derived from inverse-weighted meta-analysis and are two-sided.

References

    1. Rossiello, F., Jurk, D., Passos, J. F. & d’Adda di Fagagna, F. Telomere dysfunction in ageing and age-related diseases. Nat. Cell Biol.24, 135–147 (2022). 10.1038/s41556-022-00842-x - DOI - PMC - PubMed
    1. Harley, C. B., Futcher, A. B. & Greider, C. W. Telomeres shorten during ageing of human fibroblasts. Nature345, 458–460 (1990). 10.1038/345458a0 - DOI - PubMed
    1. Njajou, O. T. et al. Telomere length is paternally inherited and is associated with parental lifespan. Proc. Natl Acad. Sci. USA104, 12135–12139 (2007). 10.1073/pnas.0702703104 - DOI - PMC - PubMed
    1. Broer, L. et al. Meta-analysis of telomere length in 19,713 subjects reveals high heritability, stronger maternal inheritance and a paternal age effect. Eur. J. Hum. Genet.21, 1163–1168 (2013). 10.1038/ejhg.2012.303 - DOI - PMC - PubMed
    1. Bountziouka, V. et al. Modifiable traits, healthy behaviours, and leukocyte telomere length: a population-based study in UK Biobank. Lancet Healthy Longev.3, e321–e331 (2022). 10.1016/S2666-7568(22)00072-1 - DOI - PMC - PubMed

LinkOut - more resources